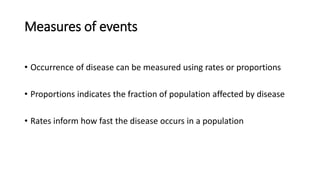
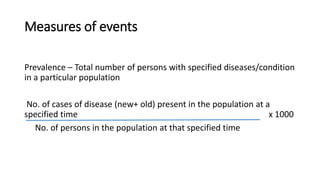
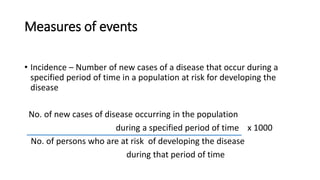
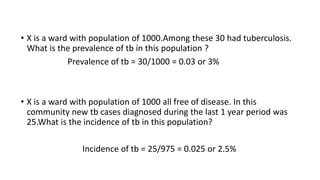
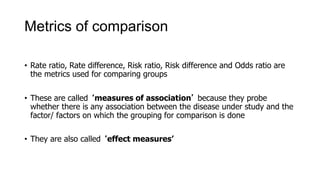
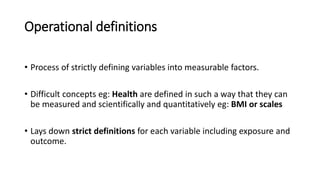
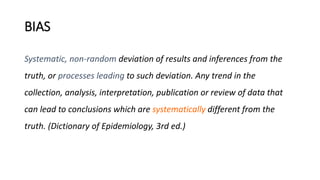
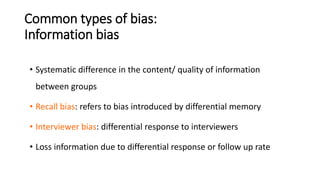
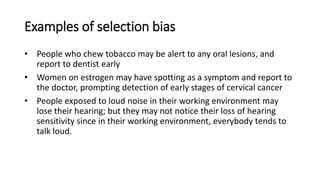
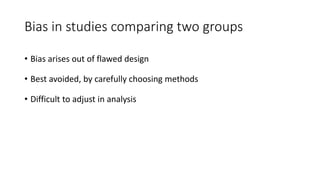
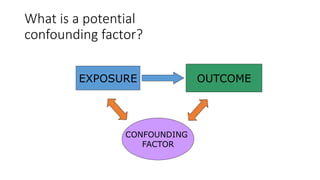
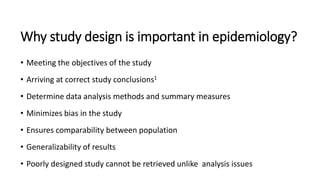
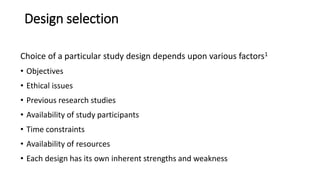
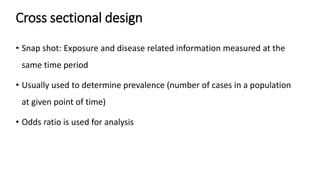
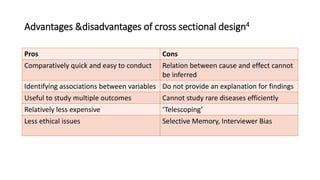
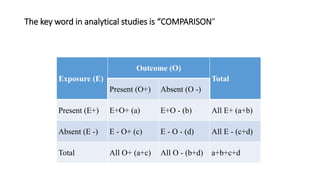
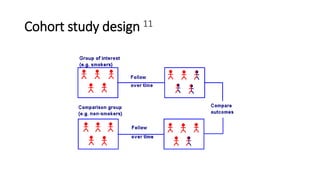
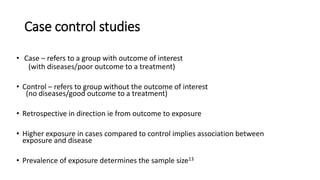
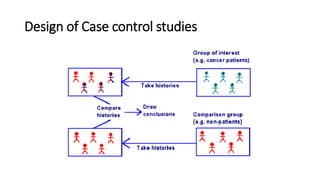
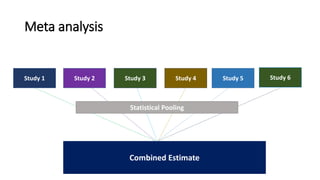
STUDY DESIGNS IN EPIDEMIOLOGY
ARAVIND L R
Measures of events
• Occurrence of disease can be measured using rates or proportions
• Proportions indicates the fraction of population affected by disease
• Rates inform how fast the disease occurs in a population
Measures of events
Prevalence – Total number of persons with specified diseases/condition
in a particular population
No. of cases of disease (new+ old) present in the population at a
specified time x 1000
No. of persons in the population at that specified time
Measures of events
• Incidence – Number of new cases of a disease that occur during a
specified period of time in a population at risk for developing the
disease
No. of new cases of disease occurring in the population
during a specified period of time x 1000
No. of persons who are at risk of developing the disease
during that period of time
• X is a ward with population of 1000.Among these 30 had tuberculosis.
What is the prevalence of tb in this population ?
Prevalence of tb = 30/1000 = 0.03 or 3%
• X is a ward with population of 1000 all free of disease. In this
community new tb cases diagnosed during the last 1 year period was
25.What is the incidence of tb in this population?
Incidence of tb = 25/975 = 0.025 or 2.5%
Probability and odds
• Chance of occurrence of an event. (range 0-1 or 0% to 100%)
Eg: probability of obtaining heads in a coin toss = ½ = 0.5 (50%)
• Odds are simply a different expression of probability (range 0- infinity)
• Odds = probability/(1-probability)
• Eg: Odds = 0.5/(1-0.5) = 1
Metrics of comparison
• Rate ratio, Rate difference, Risk ratio, Risk difference and Odds ratio are
the metrics used for comparing groups
• These are called ‘measures of association’ because they probe
whether there is any association between the disease under study and the
factor/ factors on which the grouping for comparison is done
• They are also called ‘effect measures’
Operational definitions
• Process of strictly defining variables into measurable factors.
• Difficult concepts eg: Health are defined in such a way that they can
be measured and scientifically and quantitatively eg: BMI or scales
• Lays down strict definitions for each variable including exposure and
outcome.
BIAS
Systematic, non-random deviation of results and inferences from the
truth, or processes leading to such deviation. Any trend in the
collection, analysis, interpretation, publication or review of data that
can lead to conclusions which are systematically different from the
truth. (Dictionary of Epidemiology, 3rd ed.)
Common types of bias:
Information bias
• Systematic difference in the content/ quality of information
between groups
• Recall bias: refers to bias introduced by differential memory
• Interviewer bias: differential response to interviewers
• Loss information due to differential response or follow up rate
Examples of selection bias
• People who chew tobacco may be alert to any oral lesions, and
report to dentist early
• Women on estrogen may have spotting as a symptom and report to
the doctor, prompting detection of early stages of cervical cancer
• People exposed to loud noise in their working environment may
lose their hearing; but they may not notice their loss of hearing
sensitivity since in their working environment, everybody tends to
talk loud.
Bias in studies comparing two groups
• Bias arises out of flawed design
• Best avoided, by carefully choosing methods
• Difficult to adjust in analysis
What is a potential
confounding factor?
EXPOSURE OUTCOME
CONFOUNDING
FACTOR
What is a potential
confounding factor?
This should be associated with the disease without being associated with
the exposure, AND associated with the exposure without being
associated with disease
Observed
Association
Coffee drinking
Smoking
Pancreatic cancer
Coffee drinking
Pancreatic cancer
THE DIFFERENCE BETWEEN BIAS AND
CONFOUNDING
Bias creates an association that is not true, but
confounding describes an association that is true, but
potentially misleading.
STUDY DESIGN
Why study design is important in epidemiology?
• Meeting the objectives of the study
• Arriving at correct study conclusions1
• Determine data analysis methods and summary measures
• Minimizes bias in the study
• Ensures comparability between population
• Generalizability of results
• Poorly designed study cannot be retrieved unlike analysis issues
Design selection
Choice of a particular study design depends upon various factors1
• Objectives
• Ethical issues
• Previous research studies
• Availability of study participants
• Time constraints
• Availability of resources
• Each design has its own inherent strengths and weakness
Major classification
Ecological
Descriptive studies Disease surveillance
Cross sectional
Observational study
Cohort
Analytical studies
Case Control
Randomized control Trials
Experimental study Field Trials
Community Intervention Trials
Evidence pyramid
Animal Research/Laboratory Studies
Ideas,Editorials,Opinions
Case Series/Case Reports
Cross sectional Studies
Case Control Studies
Cohort Studies
Randomized Controlled Trials
Systematic Reviews
Meta-analyses
• Descriptive studies describe events in terms of place, person and time
• Considered to be less rigorous than analytical design due to large number of confounders
• In contrast to descriptive studies, in analytical studies, the investigator proceeds with a
‘preformed hypothesis’ regarding a “causal exposure”. A large number of epidemiological
and health research questions are answered by undertaking analytical studies
Ecological study
• Basic observational study
• Studies populations/ groups/cluster rather than individuals
• At least one variable is measured at the group (not individual) level
• Suitable for hypothesis generation on cause and effect
Prostate mortality versus sugar consumption in 71 countries
Colli JL, Colli A. International comparisons of prostate cancer mortality rates with dietary practices
and sunlight levels. Urol Oncol. 2006;24:184–94.
Situations warranting an ecological design14
• New hypothesis
• Lack of information on individual level variables
• Individual level study cannot be performed due to ethical issues
• Effect of interest is from grouped data
• Time and resource constraints
Case series and case reports11
• Case series and case reports consist either of collections of reports on
the treatment of individual patients, or of reports on a single patient.
• No control group to assess outcomes
• Hence no statistical validity Hospital
Cross sectional design
• Snap shot: Exposure and disease related information measured at the
same time period
• Usually used to determine prevalence (number of cases in a population
at given point of time)
• Odds ratio is used for analysis
Advantages &disadvantages of cross sectional design4
Pros Cons
Comparatively quick and easy to conduct Relation between cause and effect cannot
be inferred
Identifying associations between variables Do not provide an explanation for findings
Useful to study multiple outcomes Cannot study rare diseases efficiently
Relatively less expensive ‘Telescoping’
Less ethical issues Selective Memory, Interviewer Bias
The key word in analytical studies is “COMPARISON”
Exposure (E)
Outcome (O)
Total
Present (O+) Absent (O -)
Present (E+) E+O+ (a) E+O - (b) All E+ (a+b)
Absent (E -) E - O+ (c) E - O - (d) All E - (c+d)
Total All O+ (a+c) All O - (b+d) a+b+c+d
How all can we compare?
• we can collect two groups of subjects, all free of CA Colon one group
eating low fibre diet (E+) and another eating high fibre diet (E - );
follow up both these groups for 15 - 20 years and see how many in
each group develop colonic CA.
• The comparison would then be made between “those who develop
the outcome out of total exposed” (i.e. a / (a+b)) and “those who
develop the outcome out of the total not exposed”, (i.e. c / (c+d)).
• we may take a group of patients already suffering from CA Colon (O+)
and another not suffering (O - ) and take the history of low dietary
fibre intake during last 15 - 20 years from all of them.
• the comparison would be made between “those with the outcome
having the exposure” (i.e. a / (a+c)) and those without the outcome
but having the exposure (i.e. b / (b+d)).
Cohort study
• In epidemiology, cohort refers to a group with common characteristics
and which is followed up over time
• Refers to “source population” or population from which cases arise
Cohort study
• Cohort or the group is usually arbitrarily decided by the researcher
• Rate of outcome determines the sample size13
• Expected drop out rates needs to be accounted in design
• Relative Risk is the effect measure
Cohort study design 11
Cohort based on direction
Grimes DA, Schulz KF. Cohort studies : marching towards outcomes. Lancet. 2002;359:341–5.
Smoking
(Exposure)
IHD (Outcome)
TotalDeveloped
(O +)
Did not
Develop (O - )
Present (E+)
150 (10%)
a
1350 (90%)
b
1500 (100%)
a+ b
Absent (E - )
175 (5%)
c
3325 (95%)
d
3500 (100%)
c+ d
Total
325
a+ c
4675
b+ d
5000
a + b + c+ d
Relative Risk = 0.10/0.05 =2.0
Risk ratio
• If we compute incidence (group 1)/ incidence (group 2), it gives
us the risk ratio
• If risk ratio =1, the two groups have comparable risk
• If the risk ratio > 1 or <1, one group has a higher risk ( or the
other group has a lower risk)
• RR>1 implies association between exposure and outcome
Advantages &disadvantages of Cohort study15
Pros Cons
Calculate incidence rate, risk and
relative risk
Time –specific biases
Multiple outcomes Repeated data collection
Less potential for recall bias Expensive
Facilitates causal inference Long follow up period
Widely used for research on risk
factors
Large sample size
Natural course of disease, survival Attrition bias or Loss to follow up
Case control studies
• Case – refers to a group with outcome of interest
(with diseases/poor outcome to a treatment)
• Control – refers to group without the outcome of interest
(no diseases/good outcome to a treatment)
• Retrospective in direction ie from outcome to exposure
• Higher exposure in cases compared to control implies association between
exposure and disease
• Prevalence of exposure determines the sample size13
Design of Case control studies
Selection of controls7
• Most difficult aspect of a case control study
• Controls should be comparable to cases in all aspects except disease status
• Sampled independent of exposure status (exposed/unexposed)
• Controls need to be sampled from same population as cases
Selection of controls 7
• Controls should reflect exposure distribution in source population
• Selecting multiple controls per case can increase likelihood of obtaining
significant associations
• The ratio can be 1:1, 1:2 or even up to 1:4
• Beyond this ratio recruiting further controls does not increase
likelihood
Source of controls
• Hospital controls – exclude controls related to disease as well as related risk
factors
• Friend Controls – similar socio demographic characteristics
• Relative controls
• Neighborhood or community controls – to counter Berksons bias
• Sibling controls – genetic diseases
Types of case control study
1)Unmatched
2)Matched :
Individual (matched pair) or Frequency matching (Group matching)
• Matching is defined as the process of selecting controls so that they are
similar to cases in certain characteristics such as age, race, socioeconomic
status and occupation.18
Calculating Odds ratio in case control study
Cases Controls
112 (a) 176 (b)
88 (c) 224 (d)
Smokers
Non Smokers
Odds ratio = ad/bc = 112*224/176*88 =1.62
Advantages &disadvantages of case control design 15
Pros Cons
Appropriate for rare diseases Recall bias
Multiple exposures can be studied Cannot compute incidence
Understanding etiology of novel diseases Provides only an estimate of relative risk ie. Odds
ratio
Useful for outbreak investigations Natural course of disease, survival cannot be
studied
Diseases with long induction period Assess only one outcome variable in a study
Comparatively less expensive Availability of quality records
Quick and easy to conduct, few subjects Difficulty in selection of controls
Less potential for loss to follow up Subject to various Bias
Systematic reviews
State objectives and eligibility criterion explicitly
Comprehensive search for related literature
Examine thoroughly and assess for methodological
rigor
Apply Eligibility criterion and justify exclusions
Prepare a critical summary of the review, stating
aims, describing materials, and reporting results
Meta analysis
Study 2 Study 4Study 3 Study 5 Study 6Study 1
Combined Estimate
Statistical Pooling
references
1. Thiese MS. Observational and interventional study design types; an
overview. Biochem Medica. 2014;24(2):199–210.
2. WHO
http://www.who.int/ipcs/publications/ehc/216_disinfectants_part_4.pdf
3. IARC http://www.iarc.fr/en/publications/pdfs-
online/epi/cancerepi/CancerEpi-5.pdf
4. Mann CJ. Observational research methods . Research design II :cohort,
cross sectional, and case-control studies. Emerg Med J. 2003;20:54–60.
5. IARC http://www.iarc.fr/en/publications/pdfs-
online/epi/cancerepi/CancerEpi-5.pdf
6. Nelson A, Brunette K. Case-Control Studies for Outbreak Investigations.
Focus F Epidemiol. 3(2).
references
11. EBM Tutorial http://library.downstate.edu/EBM2/research.htm
12. https://onlinecourses.science.psu.edu/stat507/node/46
13. https://onlinecourses.science.psu.edu/stat507/node/68
14. https://onlinecourses.science.psu.edu/stat507/node/45
15. https://onlinecourses.science.psu.edu/stat507/node/62
16. Kleinbaum DG, Sullivan KM, Barker ND. A Pocket Guide to Epidemiology. 2007.
17.Levin KA. Study Design VI - Ecological Studies. Evid Based Dent. 2003;7:60–1.
18.Rothman KJ. Epidemiology An Introduction Oxford University Press 2012,1-268
Thank you

Research Designs

  • 1.
    STUDY DESIGNS INEPIDEMIOLOGY ARAVIND L R
  • 2.
    Measures of events •Occurrence of disease can be measured using rates or proportions • Proportions indicates the fraction of population affected by disease • Rates inform how fast the disease occurs in a population
  • 3.
    Measures of events Prevalence– Total number of persons with specified diseases/condition in a particular population No. of cases of disease (new+ old) present in the population at a specified time x 1000 No. of persons in the population at that specified time
  • 4.
    Measures of events •Incidence – Number of new cases of a disease that occur during a specified period of time in a population at risk for developing the disease No. of new cases of disease occurring in the population during a specified period of time x 1000 No. of persons who are at risk of developing the disease during that period of time
  • 5.
    • X isa ward with population of 1000.Among these 30 had tuberculosis. What is the prevalence of tb in this population ? Prevalence of tb = 30/1000 = 0.03 or 3% • X is a ward with population of 1000 all free of disease. In this community new tb cases diagnosed during the last 1 year period was 25.What is the incidence of tb in this population? Incidence of tb = 25/975 = 0.025 or 2.5%
  • 6.
    Probability and odds •Chance of occurrence of an event. (range 0-1 or 0% to 100%) Eg: probability of obtaining heads in a coin toss = ½ = 0.5 (50%) • Odds are simply a different expression of probability (range 0- infinity) • Odds = probability/(1-probability) • Eg: Odds = 0.5/(1-0.5) = 1
  • 7.
    Metrics of comparison •Rate ratio, Rate difference, Risk ratio, Risk difference and Odds ratio are the metrics used for comparing groups • These are called ‘measures of association’ because they probe whether there is any association between the disease under study and the factor/ factors on which the grouping for comparison is done • They are also called ‘effect measures’
  • 8.
    Operational definitions • Processof strictly defining variables into measurable factors. • Difficult concepts eg: Health are defined in such a way that they can be measured and scientifically and quantitatively eg: BMI or scales • Lays down strict definitions for each variable including exposure and outcome.
  • 9.
    BIAS Systematic, non-random deviationof results and inferences from the truth, or processes leading to such deviation. Any trend in the collection, analysis, interpretation, publication or review of data that can lead to conclusions which are systematically different from the truth. (Dictionary of Epidemiology, 3rd ed.)
  • 10.
    Common types ofbias: Information bias • Systematic difference in the content/ quality of information between groups • Recall bias: refers to bias introduced by differential memory • Interviewer bias: differential response to interviewers • Loss information due to differential response or follow up rate
  • 11.
    Examples of selectionbias • People who chew tobacco may be alert to any oral lesions, and report to dentist early • Women on estrogen may have spotting as a symptom and report to the doctor, prompting detection of early stages of cervical cancer • People exposed to loud noise in their working environment may lose their hearing; but they may not notice their loss of hearing sensitivity since in their working environment, everybody tends to talk loud.
  • 12.
    Bias in studiescomparing two groups • Bias arises out of flawed design • Best avoided, by carefully choosing methods • Difficult to adjust in analysis
  • 13.
    What is apotential confounding factor? EXPOSURE OUTCOME CONFOUNDING FACTOR
  • 14.
    What is apotential confounding factor? This should be associated with the disease without being associated with the exposure, AND associated with the exposure without being associated with disease Observed Association Coffee drinking Smoking Pancreatic cancer Coffee drinking Pancreatic cancer
  • 15.
    THE DIFFERENCE BETWEENBIAS AND CONFOUNDING Bias creates an association that is not true, but confounding describes an association that is true, but potentially misleading.
  • 16.
  • 17.
    Why study designis important in epidemiology? • Meeting the objectives of the study • Arriving at correct study conclusions1 • Determine data analysis methods and summary measures • Minimizes bias in the study • Ensures comparability between population • Generalizability of results • Poorly designed study cannot be retrieved unlike analysis issues
  • 18.
    Design selection Choice ofa particular study design depends upon various factors1 • Objectives • Ethical issues • Previous research studies • Availability of study participants • Time constraints • Availability of resources • Each design has its own inherent strengths and weakness
  • 19.
    Major classification Ecological Descriptive studiesDisease surveillance Cross sectional Observational study Cohort Analytical studies Case Control Randomized control Trials Experimental study Field Trials Community Intervention Trials
  • 20.
    Evidence pyramid Animal Research/LaboratoryStudies Ideas,Editorials,Opinions Case Series/Case Reports Cross sectional Studies Case Control Studies Cohort Studies Randomized Controlled Trials Systematic Reviews Meta-analyses
  • 21.
    • Descriptive studiesdescribe events in terms of place, person and time • Considered to be less rigorous than analytical design due to large number of confounders • In contrast to descriptive studies, in analytical studies, the investigator proceeds with a ‘preformed hypothesis’ regarding a “causal exposure”. A large number of epidemiological and health research questions are answered by undertaking analytical studies
  • 22.
    Ecological study • Basicobservational study • Studies populations/ groups/cluster rather than individuals • At least one variable is measured at the group (not individual) level • Suitable for hypothesis generation on cause and effect
  • 23.
    Prostate mortality versussugar consumption in 71 countries Colli JL, Colli A. International comparisons of prostate cancer mortality rates with dietary practices and sunlight levels. Urol Oncol. 2006;24:184–94.
  • 24.
    Situations warranting anecological design14 • New hypothesis • Lack of information on individual level variables • Individual level study cannot be performed due to ethical issues • Effect of interest is from grouped data • Time and resource constraints
  • 25.
    Case series andcase reports11 • Case series and case reports consist either of collections of reports on the treatment of individual patients, or of reports on a single patient. • No control group to assess outcomes • Hence no statistical validity Hospital
  • 26.
    Cross sectional design •Snap shot: Exposure and disease related information measured at the same time period • Usually used to determine prevalence (number of cases in a population at given point of time) • Odds ratio is used for analysis
  • 27.
    Advantages &disadvantages ofcross sectional design4 Pros Cons Comparatively quick and easy to conduct Relation between cause and effect cannot be inferred Identifying associations between variables Do not provide an explanation for findings Useful to study multiple outcomes Cannot study rare diseases efficiently Relatively less expensive ‘Telescoping’ Less ethical issues Selective Memory, Interviewer Bias
  • 28.
    The key wordin analytical studies is “COMPARISON” Exposure (E) Outcome (O) Total Present (O+) Absent (O -) Present (E+) E+O+ (a) E+O - (b) All E+ (a+b) Absent (E -) E - O+ (c) E - O - (d) All E - (c+d) Total All O+ (a+c) All O - (b+d) a+b+c+d
  • 29.
    How all canwe compare? • we can collect two groups of subjects, all free of CA Colon one group eating low fibre diet (E+) and another eating high fibre diet (E - ); follow up both these groups for 15 - 20 years and see how many in each group develop colonic CA. • The comparison would then be made between “those who develop the outcome out of total exposed” (i.e. a / (a+b)) and “those who develop the outcome out of the total not exposed”, (i.e. c / (c+d)). • we may take a group of patients already suffering from CA Colon (O+) and another not suffering (O - ) and take the history of low dietary fibre intake during last 15 - 20 years from all of them. • the comparison would be made between “those with the outcome having the exposure” (i.e. a / (a+c)) and those without the outcome but having the exposure (i.e. b / (b+d)).
  • 30.
    Cohort study • Inepidemiology, cohort refers to a group with common characteristics and which is followed up over time • Refers to “source population” or population from which cases arise
  • 31.
    Cohort study • Cohortor the group is usually arbitrarily decided by the researcher • Rate of outcome determines the sample size13 • Expected drop out rates needs to be accounted in design • Relative Risk is the effect measure
  • 32.
  • 33.
    Cohort based ondirection Grimes DA, Schulz KF. Cohort studies : marching towards outcomes. Lancet. 2002;359:341–5.
  • 34.
    Smoking (Exposure) IHD (Outcome) TotalDeveloped (O +) Didnot Develop (O - ) Present (E+) 150 (10%) a 1350 (90%) b 1500 (100%) a+ b Absent (E - ) 175 (5%) c 3325 (95%) d 3500 (100%) c+ d Total 325 a+ c 4675 b+ d 5000 a + b + c+ d Relative Risk = 0.10/0.05 =2.0
  • 35.
    Risk ratio • Ifwe compute incidence (group 1)/ incidence (group 2), it gives us the risk ratio • If risk ratio =1, the two groups have comparable risk • If the risk ratio > 1 or <1, one group has a higher risk ( or the other group has a lower risk) • RR>1 implies association between exposure and outcome
  • 36.
    Advantages &disadvantages ofCohort study15 Pros Cons Calculate incidence rate, risk and relative risk Time –specific biases Multiple outcomes Repeated data collection Less potential for recall bias Expensive Facilitates causal inference Long follow up period Widely used for research on risk factors Large sample size Natural course of disease, survival Attrition bias or Loss to follow up
  • 37.
    Case control studies •Case – refers to a group with outcome of interest (with diseases/poor outcome to a treatment) • Control – refers to group without the outcome of interest (no diseases/good outcome to a treatment) • Retrospective in direction ie from outcome to exposure • Higher exposure in cases compared to control implies association between exposure and disease • Prevalence of exposure determines the sample size13
  • 38.
    Design of Casecontrol studies
  • 39.
    Selection of controls7 •Most difficult aspect of a case control study • Controls should be comparable to cases in all aspects except disease status • Sampled independent of exposure status (exposed/unexposed) • Controls need to be sampled from same population as cases
  • 40.
    Selection of controls7 • Controls should reflect exposure distribution in source population • Selecting multiple controls per case can increase likelihood of obtaining significant associations • The ratio can be 1:1, 1:2 or even up to 1:4 • Beyond this ratio recruiting further controls does not increase likelihood
  • 41.
    Source of controls •Hospital controls – exclude controls related to disease as well as related risk factors • Friend Controls – similar socio demographic characteristics • Relative controls • Neighborhood or community controls – to counter Berksons bias • Sibling controls – genetic diseases
  • 42.
    Types of casecontrol study 1)Unmatched 2)Matched : Individual (matched pair) or Frequency matching (Group matching) • Matching is defined as the process of selecting controls so that they are similar to cases in certain characteristics such as age, race, socioeconomic status and occupation.18
  • 43.
    Calculating Odds ratioin case control study Cases Controls 112 (a) 176 (b) 88 (c) 224 (d) Smokers Non Smokers Odds ratio = ad/bc = 112*224/176*88 =1.62
  • 44.
    Advantages &disadvantages ofcase control design 15 Pros Cons Appropriate for rare diseases Recall bias Multiple exposures can be studied Cannot compute incidence Understanding etiology of novel diseases Provides only an estimate of relative risk ie. Odds ratio Useful for outbreak investigations Natural course of disease, survival cannot be studied Diseases with long induction period Assess only one outcome variable in a study Comparatively less expensive Availability of quality records Quick and easy to conduct, few subjects Difficulty in selection of controls Less potential for loss to follow up Subject to various Bias
  • 45.
    Systematic reviews State objectivesand eligibility criterion explicitly Comprehensive search for related literature Examine thoroughly and assess for methodological rigor Apply Eligibility criterion and justify exclusions Prepare a critical summary of the review, stating aims, describing materials, and reporting results
  • 46.
    Meta analysis Study 2Study 4Study 3 Study 5 Study 6Study 1 Combined Estimate Statistical Pooling
  • 47.
    references 1. Thiese MS.Observational and interventional study design types; an overview. Biochem Medica. 2014;24(2):199–210. 2. WHO http://www.who.int/ipcs/publications/ehc/216_disinfectants_part_4.pdf 3. IARC http://www.iarc.fr/en/publications/pdfs- online/epi/cancerepi/CancerEpi-5.pdf 4. Mann CJ. Observational research methods . Research design II :cohort, cross sectional, and case-control studies. Emerg Med J. 2003;20:54–60. 5. IARC http://www.iarc.fr/en/publications/pdfs- online/epi/cancerepi/CancerEpi-5.pdf 6. Nelson A, Brunette K. Case-Control Studies for Outbreak Investigations. Focus F Epidemiol. 3(2).
  • 48.
    references 11. EBM Tutorialhttp://library.downstate.edu/EBM2/research.htm 12. https://onlinecourses.science.psu.edu/stat507/node/46 13. https://onlinecourses.science.psu.edu/stat507/node/68 14. https://onlinecourses.science.psu.edu/stat507/node/45 15. https://onlinecourses.science.psu.edu/stat507/node/62 16. Kleinbaum DG, Sullivan KM, Barker ND. A Pocket Guide to Epidemiology. 2007. 17.Levin KA. Study Design VI - Ecological Studies. Evid Based Dent. 2003;7:60–1. 18.Rothman KJ. Epidemiology An Introduction Oxford University Press 2012,1-268
  • 49.