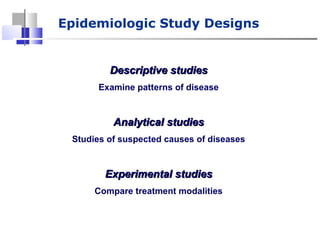
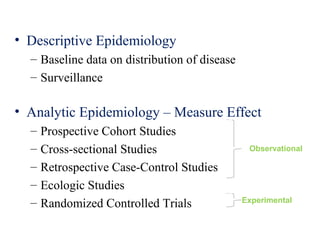
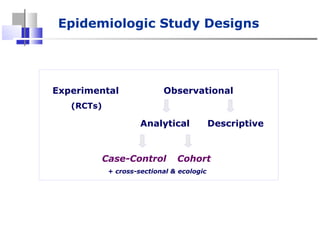
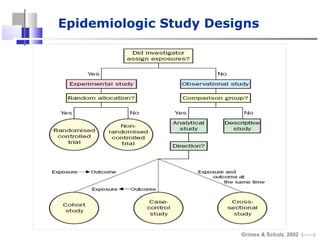
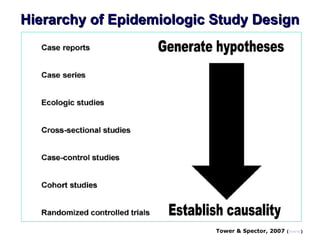
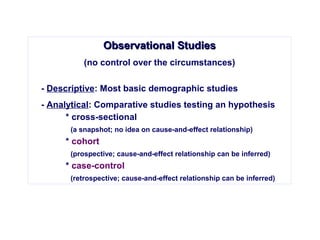
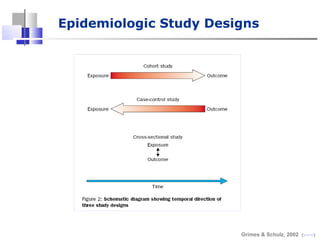
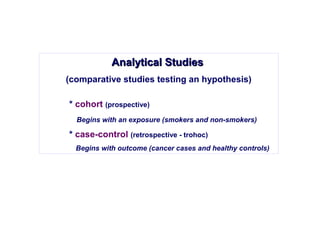
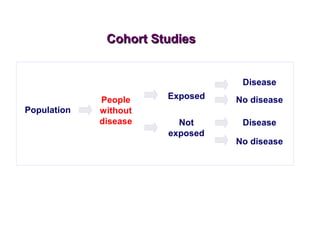
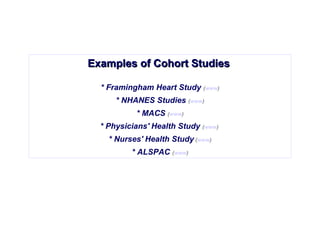
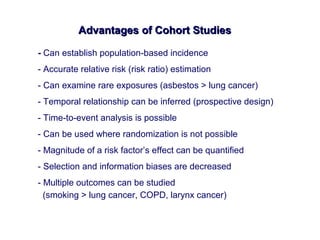
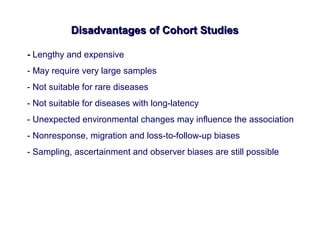
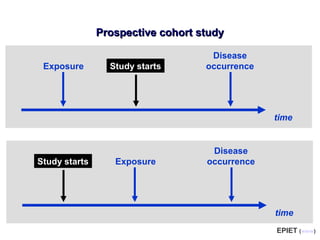
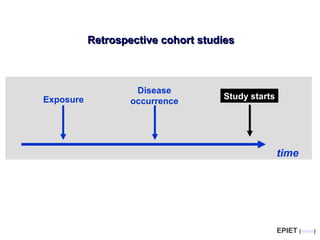
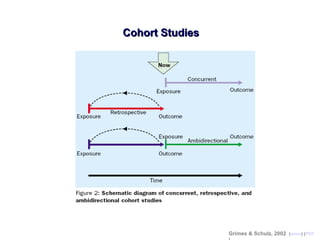
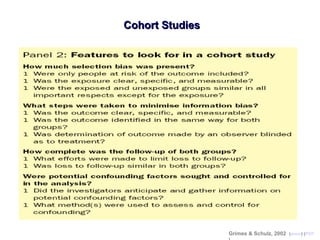
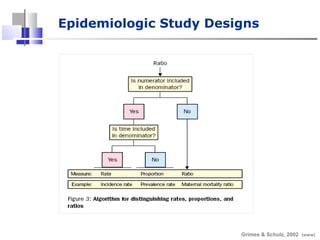
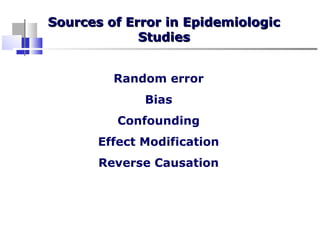
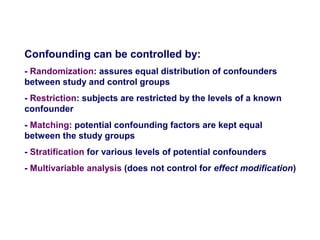
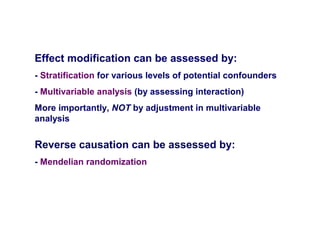
Epidemiologic StudyEpidemiologic Study
DesignsDesigns
Dr. Ismail Zubair MD. MSc
Descriptive studiesDescriptive studies
Examine patterns of disease
Analytical studiesAnalytical studies
Studies of suspected causes of diseases
Experimental studiesExperimental studies
Compare treatment modalities
Epidemiologic Study Designs
Epidemiologic Studies
• Descriptive Epidemiology
– Baseline data on distribution of disease
– Surveillance
• Analytic Epidemiology – Measure Effect
– Prospective Cohort Studies
– Cross-sectional Studies
– Retrospective Case-Control Studies
– Ecologic Studies
– Randomized Controlled Trials
Observational
Experimental
Epidemiologic Study Designs
Experimental Observational
DescriptiveAnalytical
Case-Control Cohort
+ cross-sectional & ecologic
(RCTs)
Epidemiologic Study Designs
Grimes & Schulz, 2002 (www)
Hierarchy of Epidemiologic Study DesignHierarchy of Epidemiologic Study Design
Tower & Spector, 2007 (www)
Observational StudiesObservational Studies
(no control over the circumstances)
- Descriptive: Most basic demographic studies
- Analytical: Comparative studies testing an hypothesis
* cross-sectional
(a snapshot; no idea on cause-and-effect relationship)
* cohort
(prospective; cause-and-effect relationship can be inferred)
* case-control
(retrospective; cause-and-effect relationship can be inferred)
Epidemiologic Study Designs
Grimes & Schulz, 2002 (www)
Analytical StudiesAnalytical Studies
(comparative studies testing an hypothesis)
* cohort (prospective)
Begins with an exposure (smokers and non-smokers)
* case-control (retrospective - trohoc)
Begins with outcome (cancer cases and healthy controls)
Part- Two
Population
People
without
disease
Exposed
Not
exposed
Disease
No disease
Disease
No disease
Cohort StudiesCohort Studies
Examples of Cohort StudiesExamples of Cohort Studies
* Framingham Heart Study (www)
* NHANES Studies (www)
* MACS (www)
* Physicians' Health Study (www)
* Nurses' Health Study (www)
* ALSPAC (www)
Advantages of Cohort StudiesAdvantages of Cohort Studies
- Can establish population-based incidence
- Accurate relative risk (risk ratio) estimation
- Can examine rare exposures (asbestos > lung cancer)
- Temporal relationship can be inferred (prospective design)
- Time-to-event analysis is possible
- Can be used where randomization is not possible
- Magnitude of a risk factor’s effect can be quantified
- Selection and information biases are decreased
- Multiple outcomes can be studied
(smoking > lung cancer, COPD, larynx cancer)
Disadvantages of Cohort StudiesDisadvantages of Cohort Studies
- Lengthy and expensive
- May require very large samples
- Not suitable for rare diseases
- Not suitable for diseases with long-latency
- Unexpected environmental changes may influence the association
- Nonresponse, migration and loss-to-follow-up biases
- Sampling, ascertainment and observer biases are still possible
Relative Risk: Incidence Density Ratios
Disease No Disease Total
(Margins)
Exposed a - PYe
Not exposed c - PY0
Total
(Margins)
a+c - PYe + PY0
IDR =
a
PYe
c
PY0
Incidence Density Ratio is the ratio of incidence
density of the exposed population to that of the
unexposed population.
IDR < 1 means exposure correlates with reduced risk of disease
IDR > 1 means exposure correlates with increased risk of disease
Population Cases
(follow up 2 years)
HIV + 215 8
HIV - 289 1
Presentation of cohort data:Presentation of cohort data:
Population at riskPopulation at risk
Does HIV infection increase risk of developing TB
among a population of drug users?
Source: Selwyn et al., New York, 1989
EPIET (www)
Exposure
Population
(f/u 2 years)
Cases
Incidence
(%)
Relative
Risk
HIV + 215 8 3.7 11
HIV - 298 1 0.3
Does HIV infection increase risk of developing TBDoes HIV infection increase risk of developing TB
among drug users?among drug users?
EPIET (www)
Person-years Cases
Smoke 102,600 133
Do not smoke 42,800 3
Presentation of cohort data:Presentation of cohort data:
Person-years at riskPerson-years at risk
Tobacco smoking and lung cancer, England & Wales, 1951
Source: Doll & Hill
EPIET (www)
Presentation of data:Presentation of data:
Various exposure levelsVarious exposure levels
EPIET (www)
Cohort study: Tobacco smoking and lung cancer,Cohort study: Tobacco smoking and lung cancer,
England & Wales, 1951England & Wales, 1951
Source: Doll & Hill
EPIET (www)
time
Exposure Study starts
Disease
occurrence
Prospective cohort studyProspective cohort study
time
ExposureStudy starts
Disease
occurrence
EPIET (www)
Retrospective cohort studiesRetrospective cohort studies
Exposure
time
Disease
occurrence
Study starts
EPIET (www)
Cohort StudiesCohort Studies
Grimes & Schulz, 2002 (www) (PDF
Cohort StudiesCohort Studies
Grimes & Schulz, 2002 (www) (PDF
Population
Cases
Controls
Exposed
Case-Control StudiesCase-Control Studies
Not
exposed
Exposed
Not
exposed
Case-Control StudiesCase-Control Studies
Schulz & Grimes, 2002 (www) (PDF)
Advantages of Case-Control StudiesAdvantages of Case-Control Studies
- Cheap, easy and quick studies
- Multiple exposures can be examined
- Rare diseases and diseases with long latency
can be studied
- Suitable when randomization is unethical
(alcohol and pregnancy outcome)
Disadvantages of Case-Control StudiesDisadvantages of Case-Control Studies
- Case and control selection troublesome
- Subject to bias (selection, recall, misclassification)
- Direct incidence estimation is not possible
- Temporal relationship is not clear
- Multiple outcomes cannot be studied
- If the incidence of exposure is high, it is difficult to show the
difference between cases and controls
- Not easy to estimate attributable fraction
- Reverse causation is a problem in interpretation - especially
in molecular epidemiology studies
Case-Control Studies:Case-Control Studies:
Potential BiasPotential Bias
Schulz & Grimes, 2002 (www) (PDF)
Cause-and-Effect RelationshipCause-and-Effect Relationship
Grimes & Schulz, 2002 (www)
Cause-and-Effect RelationshipCause-and-Effect Relationship
Grimes & Schulz, 2002 (www)
(Absolute Risk) (AR)
Relative Risk (Risk Ratio) (RR)
Odds Ratio (OR)
Phi coefficient / Cramer’s V / Contingency coefficient
Attributable Fraction (AF)
Attributable Risk (AR)
Relative Risk Reduction (RRR)
Absolute Risk Reduction (ARR)
Number Needed to Treat (NNT)
Measures of test accuracy:
Sensitivity, specificity, positive and negative predictive value
(PPV, NPV)
Epidemiologic Association / Impact MeasuresEpidemiologic Association / Impact Measures
ROCHE Genetic Education (www)
Odds Ratio: 3.6
95% CI = 1.3 to 10.4
OR = ad / bc = 17*30 / 20*7 = 3.6
RR = (a/(a+c)) / (b/(b+d)) = (17/24)/(20/50) = 1.8
EBM toolbox ( www)
EpiMax Table Calculator (www)
a = 17
b = 20
c = 7
d = 30
Epidemiologic Study Designs
Grimes & Schulz, 2002 (www)
Sources of Error in EpidemiologicSources of Error in Epidemiologic
StudiesStudies
Random error
Bias
Confounding
Effect Modification
Reverse Causation
Sources of Error in EpidemiologicSources of Error in Epidemiologic
StudiesStudies
Random error
Large sample size, replication
Bias
Be careful
Confounding
Effect Modification
Reverse Causation
Confounding can be controlled by:
- Randomization: assures equal distribution of confounders
between study and control groups
- Restriction: subjects are restricted by the levels of a known
confounder
- Matching: potential confounding factors are kept equal
between the study groups
- Stratification for various levels of potential confounders
- Multivariable analysis (does not control for effect modification)
Effect modification can be assessed by:
- Stratification for various levels of potential confounders
- Multivariable analysis (by assessing interaction)
More importantly, NOT by adjustment in multivariable
analysis
Reverse causation can be assessed by:
- Mendelian randomization
Thank
You

Epidemiology Study Design

  • 1.
  • 4.
    Descriptive studiesDescriptive studies Examinepatterns of disease Analytical studiesAnalytical studies Studies of suspected causes of diseases Experimental studiesExperimental studies Compare treatment modalities Epidemiologic Study Designs
  • 5.
    Epidemiologic Studies • DescriptiveEpidemiology – Baseline data on distribution of disease – Surveillance • Analytic Epidemiology – Measure Effect – Prospective Cohort Studies – Cross-sectional Studies – Retrospective Case-Control Studies – Ecologic Studies – Randomized Controlled Trials Observational Experimental
  • 6.
    Epidemiologic Study Designs ExperimentalObservational DescriptiveAnalytical Case-Control Cohort + cross-sectional & ecologic (RCTs)
  • 7.
  • 8.
    Hierarchy of EpidemiologicStudy DesignHierarchy of Epidemiologic Study Design Tower & Spector, 2007 (www)
  • 9.
    Observational StudiesObservational Studies (nocontrol over the circumstances) - Descriptive: Most basic demographic studies - Analytical: Comparative studies testing an hypothesis * cross-sectional (a snapshot; no idea on cause-and-effect relationship) * cohort (prospective; cause-and-effect relationship can be inferred) * case-control (retrospective; cause-and-effect relationship can be inferred)
  • 10.
  • 11.
    Analytical StudiesAnalytical Studies (comparativestudies testing an hypothesis) * cohort (prospective) Begins with an exposure (smokers and non-smokers) * case-control (retrospective - trohoc) Begins with outcome (cancer cases and healthy controls)
  • 12.
  • 13.
  • 14.
    Examples of CohortStudiesExamples of Cohort Studies * Framingham Heart Study (www) * NHANES Studies (www) * MACS (www) * Physicians' Health Study (www) * Nurses' Health Study (www) * ALSPAC (www)
  • 15.
    Advantages of CohortStudiesAdvantages of Cohort Studies - Can establish population-based incidence - Accurate relative risk (risk ratio) estimation - Can examine rare exposures (asbestos > lung cancer) - Temporal relationship can be inferred (prospective design) - Time-to-event analysis is possible - Can be used where randomization is not possible - Magnitude of a risk factor’s effect can be quantified - Selection and information biases are decreased - Multiple outcomes can be studied (smoking > lung cancer, COPD, larynx cancer)
  • 16.
    Disadvantages of CohortStudiesDisadvantages of Cohort Studies - Lengthy and expensive - May require very large samples - Not suitable for rare diseases - Not suitable for diseases with long-latency - Unexpected environmental changes may influence the association - Nonresponse, migration and loss-to-follow-up biases - Sampling, ascertainment and observer biases are still possible
  • 19.
    Relative Risk: IncidenceDensity Ratios Disease No Disease Total (Margins) Exposed a - PYe Not exposed c - PY0 Total (Margins) a+c - PYe + PY0 IDR = a PYe c PY0 Incidence Density Ratio is the ratio of incidence density of the exposed population to that of the unexposed population. IDR < 1 means exposure correlates with reduced risk of disease IDR > 1 means exposure correlates with increased risk of disease
  • 20.
    Population Cases (follow up2 years) HIV + 215 8 HIV - 289 1 Presentation of cohort data:Presentation of cohort data: Population at riskPopulation at risk Does HIV infection increase risk of developing TB among a population of drug users? Source: Selwyn et al., New York, 1989 EPIET (www)
  • 21.
    Exposure Population (f/u 2 years) Cases Incidence (%) Relative Risk HIV+ 215 8 3.7 11 HIV - 298 1 0.3 Does HIV infection increase risk of developing TBDoes HIV infection increase risk of developing TB among drug users?among drug users? EPIET (www)
  • 22.
    Person-years Cases Smoke 102,600133 Do not smoke 42,800 3 Presentation of cohort data:Presentation of cohort data: Person-years at riskPerson-years at risk Tobacco smoking and lung cancer, England & Wales, 1951 Source: Doll & Hill EPIET (www)
  • 23.
    Presentation of data:Presentationof data: Various exposure levelsVarious exposure levels EPIET (www)
  • 24.
    Cohort study: Tobaccosmoking and lung cancer,Cohort study: Tobacco smoking and lung cancer, England & Wales, 1951England & Wales, 1951 Source: Doll & Hill EPIET (www)
  • 25.
    time Exposure Study starts Disease occurrence Prospectivecohort studyProspective cohort study time ExposureStudy starts Disease occurrence EPIET (www)
  • 26.
    Retrospective cohort studiesRetrospectivecohort studies Exposure time Disease occurrence Study starts EPIET (www)
  • 27.
    Cohort StudiesCohort Studies Grimes& Schulz, 2002 (www) (PDF
  • 28.
    Cohort StudiesCohort Studies Grimes& Schulz, 2002 (www) (PDF
  • 29.
  • 30.
  • 31.
    Advantages of Case-ControlStudiesAdvantages of Case-Control Studies - Cheap, easy and quick studies - Multiple exposures can be examined - Rare diseases and diseases with long latency can be studied - Suitable when randomization is unethical (alcohol and pregnancy outcome)
  • 32.
    Disadvantages of Case-ControlStudiesDisadvantages of Case-Control Studies - Case and control selection troublesome - Subject to bias (selection, recall, misclassification) - Direct incidence estimation is not possible - Temporal relationship is not clear - Multiple outcomes cannot be studied - If the incidence of exposure is high, it is difficult to show the difference between cases and controls - Not easy to estimate attributable fraction - Reverse causation is a problem in interpretation - especially in molecular epidemiology studies
  • 33.
    Case-Control Studies:Case-Control Studies: PotentialBiasPotential Bias Schulz & Grimes, 2002 (www) (PDF)
  • 34.
  • 35.
  • 36.
    (Absolute Risk) (AR) RelativeRisk (Risk Ratio) (RR) Odds Ratio (OR) Phi coefficient / Cramer’s V / Contingency coefficient Attributable Fraction (AF) Attributable Risk (AR) Relative Risk Reduction (RRR) Absolute Risk Reduction (ARR) Number Needed to Treat (NNT) Measures of test accuracy: Sensitivity, specificity, positive and negative predictive value (PPV, NPV) Epidemiologic Association / Impact MeasuresEpidemiologic Association / Impact Measures
  • 37.
    ROCHE Genetic Education(www) Odds Ratio: 3.6 95% CI = 1.3 to 10.4
  • 38.
    OR = ad/ bc = 17*30 / 20*7 = 3.6 RR = (a/(a+c)) / (b/(b+d)) = (17/24)/(20/50) = 1.8 EBM toolbox ( www) EpiMax Table Calculator (www) a = 17 b = 20 c = 7 d = 30
  • 39.
  • 40.
    Sources of Errorin EpidemiologicSources of Error in Epidemiologic StudiesStudies Random error Bias Confounding Effect Modification Reverse Causation
  • 41.
    Sources of Errorin EpidemiologicSources of Error in Epidemiologic StudiesStudies Random error Large sample size, replication Bias Be careful Confounding Effect Modification Reverse Causation
  • 42.
    Confounding can becontrolled by: - Randomization: assures equal distribution of confounders between study and control groups - Restriction: subjects are restricted by the levels of a known confounder - Matching: potential confounding factors are kept equal between the study groups - Stratification for various levels of potential confounders - Multivariable analysis (does not control for effect modification)
  • 43.
    Effect modification canbe assessed by: - Stratification for various levels of potential confounders - Multivariable analysis (by assessing interaction) More importantly, NOT by adjustment in multivariable analysis Reverse causation can be assessed by: - Mendelian randomization
  • 44.

Editor's Notes

  • #6 Descriptive &amp; Analytical Epi are ends of a continuum. Most studies are both. Both are important. Goal of mathematical epidemiology is to understand how the distribution of disease is created by the determinants (effects of various risk factors, but in a mechanistic/causal rather than correlation framework).
  • #20 Depending on the study design, the RR can be: CIR (logistic regression or Chi squared) IDR (poisson regression) PR (logistic regression or Chi squared) OR (logistic regression or Chi squared) Don’t go into details on the difference, just mention that they are from different study designs. Talk about that during study design sections.