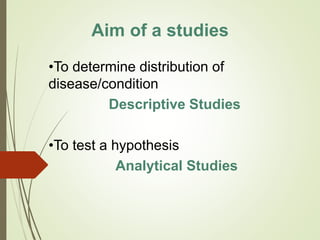
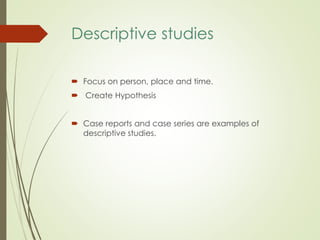
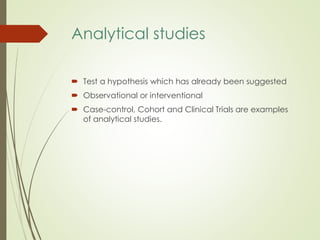
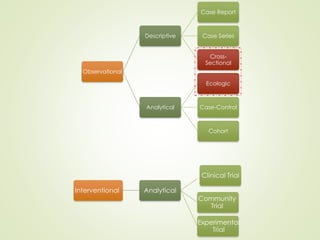
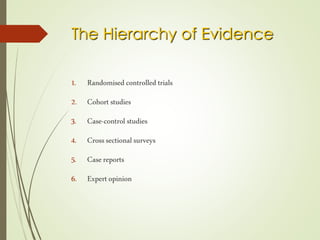
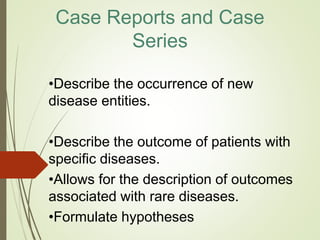
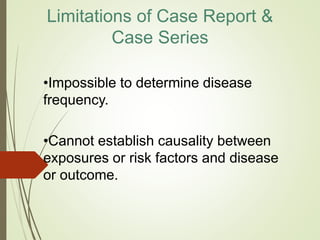
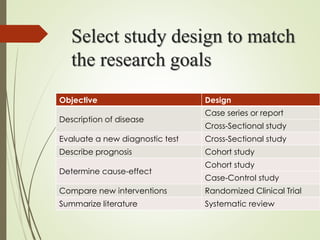
Epidemiological
Studies
By Mehdi Ehtesham
Epidemiologist, Avicenna Research Consulting,
London, UK
Aim of a studies
•To determine distribution of
disease/condition
Descriptive Studies
•To test a hypothesis
Analytical Studies
Descriptive studies
 Focus on person, place and time.
 Create Hypothesis
 Case reports and case series are examples of
descriptive studies.
Analytical studies
 Test a hypothesis which has already been suggested
 Observational or interventional
 Case-control, Cohort and Clinical Trials are examples
of analytical studies.
Observational
Descriptive
Case Report
Case Series
Cross-
Sectional
Analytical
Ecologic
Case-Control
Cohort
Interventional Analytical
Clinical Trial
Community
Trial
Experimental
Trial
The Hierarchy of Evidence
1. Randomised controlled trials
2. Cohort studies
3. Case-control studies
4. Crosssectional surveys
5. Casereports
6. Expert opinion
Case Reports and Case
Series
•Describe the occurrence of new
disease entities.
•Describe the outcome of patients with
specific diseases.
•Allows for the description of outcomes
associated with rare diseases.
•Formulate hypotheses
Limitations of Case Report &
Case Series
•Impossible to determine disease
frequency.
•Cannot establish causality between
exposures or risk factors and disease
or outcome.
Case reports
 Documentation:
In 1961, a published case report of a 40 year-old woman
who developed pulmonary embolism after beginning
use of oral contraceptive
Case Series
 Create hypothesis
In Los Angeles, five young homosexuals men, previously
healthy, were diagnosed with pneumocyst cariini
pneumonia in a 6-month period (80-81)
•Cross-Sectional Studies measure
existing disease and current exposure
levels.
•They provide some indication of the
relationship between the disease and
exposure or non-exposure
•Mostly prevalence studies/surveys
Cross-sectional studies
•Good design for hypothesis generation
•Can estimate exposure proportions in the population
• Can study multiple exposures or multiple outcomes
•Relatively easy, quick and inexpensive
•Best suited to study permanent factors (breed, sex,
blood-type)
•Often good first step for new study issue
Cross Sectional Studies
(Advantages)
• Impractical for rare diseases
• Problems with temporal sequence of data
• Not a useful type of study for establishing
causal relationships
• Confounding is difficult to control
• hard to decide when disease was actually
acquired
• miss diseases still in latent period
• recall of previous exposure may be faulty
Cross Sectional Studies
(Disadvantages)
Case-control studies
Exposure Outcome
Case-Control
Study
Population
Case
Exposed
Unexposed
Control
Exposed
Unexposed
Steps
 Hypothesis definition(Is there association or NOT!)
 Selection of cases and controls(mostly from hospital)
 Match case and control (age, gender or… )
 Exposure measurement(mostly with questionnaire)
 Analysis (Statistic software, such as SPSS, STATA or EPI
info)
 Interpretation
Special features of case
control study
 Studying diseases with long latency
 Efficient in time and cost
 Suitable for rare diseases
 Wide range of potential exposure
Selection of cases
 Sources of cases
Population
Hospital
Registry
 Are the cases representative of total population or a
fraction of it?
case definition
 Strict diagnostic criteria
 Homogenous or heterogeneous?
 Where, when and whom?
 Hospital versus population
 Incident versus prevalent
(survival factors)
Types of controls
 Sources of controls
Population case  Population control
Hospital case  Hospital control
 Hospital controls: Patients with mixture of
diagnosis are usually used as controls
 Dead controls
 Similar disease as controls
 Friend or neighbor controls
 Population controls
Selection of matched
controls
 Increased power efficiency
 Matching variable can not be
investigated as a possible risk factor
 Overmatching (Many variables, wrong variable)
 Difficult to find suitable matches
 Frequency and individual matching
Matched design Matched analysis
Measures of exposure
 Intensity (level or frequency)
 Duration
 Dose
 Average exposure
 Time since first
 Time since last
Cohort studies
Exposure Outcome
Cohort
Study
Population
(Non-diseased)
Exposed
Disease +
-Disease
Unexposed
Disease +
-Disease
Steps
 Hypothesis definition
 Selection of exposed and unexposed
 Follow-up and outcome measurement
 Analysis & interpretation
Selection of the Exposed
Population
•Sample of the general population:
Geographically area, special age groups, birth
cohorts
•A group that is easy to identify:
Nurses health study
•Special population (often occupational
epidemiology):
Rare and special exposure
Selection of the Comparison
Population
• Internal Control Group
– Exposed and non-exposed in the same
Study population (Framingham study,
Nurses health study)
• Minimise the differences between exposed
and non-exposed
• External Control Group
– Chosen in another group, another cohort
(Occupational epidemiology: Asbestosis
vs. cotton workers)
• The General Population
You follow the participants
to define:
 The occurrence of outcome
 Loss to Follow-up
 Define the outcome
 Define “loss”
Cohort
Exposure Outcome
Exposure Outcome
Exposure Outcome
Present Time
Prospective vs. retrospective
Cohort Studies
Prospective Cohort Studies
– Time consuming, expensive
– More valid information on exposure
– Measurements on potential confounders
Retrospective Cohort Studies
– Quick, cheap
– Appropriate to examine outcome with long
latency periods
– Difficult to obtain information of exposure
– Risk of confounding
Ecological Studies
 Use populations as units of analysis
 Correlation (multiple populations)
 Comparison (two populations)
 Populations can be countries, provinces, counties,
schools, etc.
Ecological study– focus on
characteristics of population groups
rather than their individual members.
The unit of analysis
not an individual
but a group: defined by
time (calendar period, birth cohort)
geography (country, province, or city)
social-demographic characteristics (e.g. ethnicity,
religion, or socio-economic status)
Provide the first look of relations for
hypothesis generation
Ecologic studies
 Cannot link factor and a disease at the level of the
individual
 Other factors may account for differences in disease rates
 Relationships which occur when groups used as units of
analysis may not exist when individuals are used as units of
analysis
Daily mortality vs. outside temperature
250
200
150
100
50
0
0 1600140012001000800600
Japan
Denmark
New Zealand
Fed. Repub.
Of Germany
France
Canada
Israel
Switzerland
USA
Australia
Yugoslavia
Hong Kong
Romania
Finland
Poland
Spain
Hungary
Norway
UK
Italy
Sweden
IncidenceRatioper100,000Women
Per Capita Supply of Fat Calories
Correlation between dietary fat intake and breast cancer
by country.
Prentice RL, Kakar F, Hursting S, et al: Aspects of
the rationale for the Women’s Health Trial. J Natl
Cancer Inst 80:802-814, 1988.)
ECOLOGICAL FALLACY
“Ecological fallacy”, “ecological bias”,
“cross-level bias”
“Failure of ecological level
associations to properly reflect
individual level associations”
Randomized Clinical Trials
Basic Trial Design
Population
Sample
Treatment Dx No Dx
Control Dx No DxPlacebo
Randomization
Steps in a randomized controlled trial
1. Select participants
2. Measure baseline variables
3. Randomize
 Eliminates baseline confounding
 Types (simple, stratified, block)
Steps in a randomized
controlled trial
4. Blinding the intervention
 As important as randomization
5. Follow subjects
6. Measure outcome
 Clinically important measures
 Adverse events
Samples
 Randomization is the key
 Allocation is at random, not sampling
 Simple versus systematic Randomization
considerations
 Strict inclusion and exclusion criteria (impact on
generalisability)
 Ethical considerations
 Technical considerations
Title and Abstract
 How participants were allocated to interventions (eg,
“random allocation,” “randomized,” or “randomly
assigned”).
Methods
 Eligibility criteria for participants
 settings and locations
 Precise details of the interventions
 Specific objectives and hypotheses
 Clearly defined primary and secondary outcome measures
 methods used to enhance the quality of measurements
 How sample size was determined
Also …
 Method of Randomization
 Method of Concealment
 Method of Implementation
 Level of blinding
 Participant flow
Select study design to match
the research goals
DesignObjective
Case series or report
Description of disease
Cross-Sectional study
Cross-Sectional studyEvaluate a new diagnostic test
Cohort studyDescribe prognosis
Cohort study
Determine cause-effect
Case-Control study
Randomized Clinical TrialCompare new interventions
Systematic reviewSummarize literature

2-Epidemiological studies

  • 1.
    Epidemiological Studies By Mehdi Ehtesham Epidemiologist,Avicenna Research Consulting, London, UK
  • 2.
    Aim of astudies •To determine distribution of disease/condition Descriptive Studies •To test a hypothesis Analytical Studies
  • 3.
    Descriptive studies  Focuson person, place and time.  Create Hypothesis  Case reports and case series are examples of descriptive studies.
  • 4.
    Analytical studies  Testa hypothesis which has already been suggested  Observational or interventional  Case-control, Cohort and Clinical Trials are examples of analytical studies.
  • 5.
  • 6.
    The Hierarchy ofEvidence 1. Randomised controlled trials 2. Cohort studies 3. Case-control studies 4. Crosssectional surveys 5. Casereports 6. Expert opinion
  • 7.
    Case Reports andCase Series •Describe the occurrence of new disease entities. •Describe the outcome of patients with specific diseases. •Allows for the description of outcomes associated with rare diseases. •Formulate hypotheses
  • 8.
    Limitations of CaseReport & Case Series •Impossible to determine disease frequency. •Cannot establish causality between exposures or risk factors and disease or outcome.
  • 9.
    Case reports  Documentation: In1961, a published case report of a 40 year-old woman who developed pulmonary embolism after beginning use of oral contraceptive
  • 10.
    Case Series  Createhypothesis In Los Angeles, five young homosexuals men, previously healthy, were diagnosed with pneumocyst cariini pneumonia in a 6-month period (80-81)
  • 11.
    •Cross-Sectional Studies measure existingdisease and current exposure levels. •They provide some indication of the relationship between the disease and exposure or non-exposure •Mostly prevalence studies/surveys Cross-sectional studies
  • 12.
    •Good design forhypothesis generation •Can estimate exposure proportions in the population • Can study multiple exposures or multiple outcomes •Relatively easy, quick and inexpensive •Best suited to study permanent factors (breed, sex, blood-type) •Often good first step for new study issue Cross Sectional Studies (Advantages)
  • 13.
    • Impractical forrare diseases • Problems with temporal sequence of data • Not a useful type of study for establishing causal relationships • Confounding is difficult to control • hard to decide when disease was actually acquired • miss diseases still in latent period • recall of previous exposure may be faulty Cross Sectional Studies (Disadvantages)
  • 14.
  • 15.
  • 16.
    Steps  Hypothesis definition(Isthere association or NOT!)  Selection of cases and controls(mostly from hospital)  Match case and control (age, gender or… )  Exposure measurement(mostly with questionnaire)  Analysis (Statistic software, such as SPSS, STATA or EPI info)  Interpretation
  • 17.
    Special features ofcase control study  Studying diseases with long latency  Efficient in time and cost  Suitable for rare diseases  Wide range of potential exposure
  • 18.
    Selection of cases Sources of cases Population Hospital Registry  Are the cases representative of total population or a fraction of it?
  • 19.
    case definition  Strictdiagnostic criteria  Homogenous or heterogeneous?  Where, when and whom?  Hospital versus population  Incident versus prevalent (survival factors)
  • 20.
    Types of controls Sources of controls Population case  Population control Hospital case  Hospital control  Hospital controls: Patients with mixture of diagnosis are usually used as controls  Dead controls  Similar disease as controls  Friend or neighbor controls  Population controls
  • 21.
    Selection of matched controls Increased power efficiency  Matching variable can not be investigated as a possible risk factor  Overmatching (Many variables, wrong variable)  Difficult to find suitable matches  Frequency and individual matching Matched design Matched analysis
  • 22.
    Measures of exposure Intensity (level or frequency)  Duration  Dose  Average exposure  Time since first  Time since last
  • 23.
  • 24.
  • 25.
    Steps  Hypothesis definition Selection of exposed and unexposed  Follow-up and outcome measurement  Analysis & interpretation
  • 26.
    Selection of theExposed Population •Sample of the general population: Geographically area, special age groups, birth cohorts •A group that is easy to identify: Nurses health study •Special population (often occupational epidemiology): Rare and special exposure
  • 27.
    Selection of theComparison Population • Internal Control Group – Exposed and non-exposed in the same Study population (Framingham study, Nurses health study) • Minimise the differences between exposed and non-exposed • External Control Group – Chosen in another group, another cohort (Occupational epidemiology: Asbestosis vs. cotton workers) • The General Population
  • 28.
    You follow theparticipants to define:  The occurrence of outcome  Loss to Follow-up  Define the outcome  Define “loss”
  • 29.
  • 30.
    Prospective vs. retrospective CohortStudies Prospective Cohort Studies – Time consuming, expensive – More valid information on exposure – Measurements on potential confounders Retrospective Cohort Studies – Quick, cheap – Appropriate to examine outcome with long latency periods – Difficult to obtain information of exposure – Risk of confounding
  • 31.
    Ecological Studies  Usepopulations as units of analysis  Correlation (multiple populations)  Comparison (two populations)  Populations can be countries, provinces, counties, schools, etc.
  • 32.
    Ecological study– focuson characteristics of population groups rather than their individual members. The unit of analysis not an individual but a group: defined by time (calendar period, birth cohort) geography (country, province, or city) social-demographic characteristics (e.g. ethnicity, religion, or socio-economic status) Provide the first look of relations for hypothesis generation
  • 33.
    Ecologic studies  Cannotlink factor and a disease at the level of the individual  Other factors may account for differences in disease rates  Relationships which occur when groups used as units of analysis may not exist when individuals are used as units of analysis
  • 34.
    Daily mortality vs.outside temperature
  • 35.
    250 200 150 100 50 0 0 1600140012001000800600 Japan Denmark New Zealand Fed.Repub. Of Germany France Canada Israel Switzerland USA Australia Yugoslavia Hong Kong Romania Finland Poland Spain Hungary Norway UK Italy Sweden IncidenceRatioper100,000Women Per Capita Supply of Fat Calories Correlation between dietary fat intake and breast cancer by country. Prentice RL, Kakar F, Hursting S, et al: Aspects of the rationale for the Women’s Health Trial. J Natl Cancer Inst 80:802-814, 1988.)
  • 36.
    ECOLOGICAL FALLACY “Ecological fallacy”,“ecological bias”, “cross-level bias” “Failure of ecological level associations to properly reflect individual level associations”
  • 37.
    Randomized Clinical Trials BasicTrial Design Population Sample Treatment Dx No Dx Control Dx No DxPlacebo Randomization
  • 38.
    Steps in arandomized controlled trial 1. Select participants 2. Measure baseline variables 3. Randomize  Eliminates baseline confounding  Types (simple, stratified, block)
  • 39.
    Steps in arandomized controlled trial 4. Blinding the intervention  As important as randomization 5. Follow subjects 6. Measure outcome  Clinically important measures  Adverse events
  • 40.
    Samples  Randomization isthe key  Allocation is at random, not sampling  Simple versus systematic Randomization
  • 41.
    considerations  Strict inclusionand exclusion criteria (impact on generalisability)  Ethical considerations  Technical considerations
  • 42.
    Title and Abstract How participants were allocated to interventions (eg, “random allocation,” “randomized,” or “randomly assigned”).
  • 43.
    Methods  Eligibility criteriafor participants  settings and locations  Precise details of the interventions  Specific objectives and hypotheses  Clearly defined primary and secondary outcome measures  methods used to enhance the quality of measurements  How sample size was determined
  • 44.
    Also …  Methodof Randomization  Method of Concealment  Method of Implementation  Level of blinding  Participant flow
  • 45.
    Select study designto match the research goals DesignObjective Case series or report Description of disease Cross-Sectional study Cross-Sectional studyEvaluate a new diagnostic test Cohort studyDescribe prognosis Cohort study Determine cause-effect Case-Control study Randomized Clinical TrialCompare new interventions Systematic reviewSummarize literature