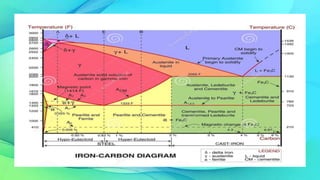
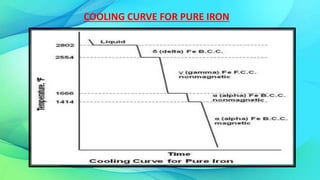
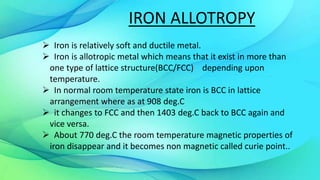
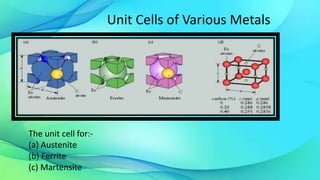
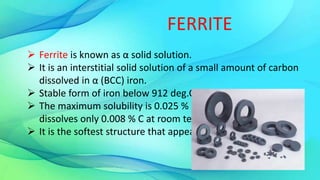
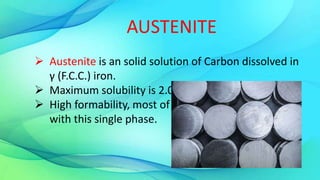
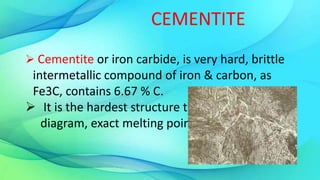
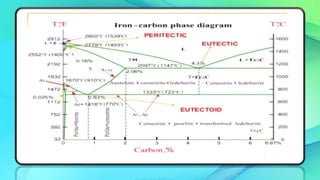
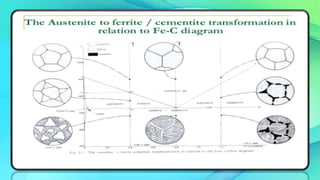
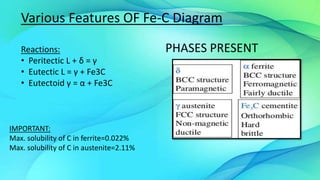
IRON-CARBON EQUILIBRIUM
DIAGRAM
PRESENTED BY:
ADITI RANA
A2305316090
B.Tech(IT-2X)
In their simplest form, steels are alloys of Iron (Fe) and
Carbon (C). The Fe-C phase diagram is a fairly complex one,
but we will only consider the steel and cast iron part of the
diagram, up to 6.67% Carbon.
COOLING CURVE FOR PURE IRON
IRON ALLOTROPY
 Iron is relatively soft and ductile metal.
 Iron is allotropic metal which means that it exist in more than
one type of lattice structure(BCC/FCC) depending upon
temperature.
 In normal room temperature state iron is BCC in lattice
arrangement where as at 908 deg.C
 it changes to FCC and then 1403 deg.C back to BCC again and
vice versa.
 About 770 deg.C the room temperature magnetic properties of
iron disappear and it becomes non magnetic called curie point..
Unit Cells of Various Metals
The unit cell for:-
(a) Austenite
(b) Ferrite
(c) Martensite
Various phases that appear on the Iron- Carbon
equilibrium phase diagram are as under:
•Ferrite
•Austenite
•Cementite
DIFFERENT STRUCTURES
FERRITE
 Ferrite is known as α solid solution.
 It is an interstitial solid solution of a small amount of carbon
dissolved in α (BCC) iron.
 Stable form of iron below 912 deg.C
 The maximum solubility is 0.025 % C at 723°C and it
dissolves only 0.008 % C at room temperature.
 It is the softest structure that appears on the diagram.
 Austenite is an solid solution of Carbon dissolved in
γ (F.C.C.) iron.
 Maximum solubility is 2.0 % C at 1130°C.
 High formability, most of heat treatments begin
with this single phase.
AUSTENITE
CEMENTITE
 Cementite or iron carbide, is very hard, brittle
intermetallic compound of iron & carbon, as
Fe3C, contains 6.67 % C.
 It is the hardest structure that appears on the
diagram, exact melting point unknown.
THE IRON CARBON DIAGRAM
A map of the temperature at which different phase changes
occur on very slow heating and cooling in relation to Carbon,
is called Iron- Carbon Diagram.
Iron- Carbon diagram shows:-
A. The type of alloys formed under very slow cooling.
B. Proper heat-treatment temperature and
C. How the properties of steels and cast irons can be radically
changed by heat-treatment.
It is the graphical representation of the effect of
temperature and composition upon the phase present
in alloy.
An equilibrium diagram is constructed by plotting temp.
along Y axis and % of C along X axis.
This diagram shows range of temp & composition
within which the various phases change are stable and
also the boundaries at which the phase change occurs.
Reactions:
• Peritectic L + δ = γ
• Eutectic L = γ + Fe3C
• Eutectoid γ = α + Fe3C
Various Features OF Fe-C Diagram
PHASES PRESENT
IMPORTANT:
Max. solubility of C in ferrite=0.022%
Max. solubility of C in austenite=2.11%
THREE PHASE REACTIONS
Peritectic, at 1490 deg.C, with low 0.16 wt% C alloys (almost no
engineering importance).
Eutectic, at 1130 deg.C, with 4.3wt% C, alloys called cast irons.
Eutectoid, at 723 deg.C with eutectoid composition of 0.8wt% C,
two-phase mixture (ferrite & cementite). They are steels.
The diagram shows three horizontal lines which indicate
isothermal reactions (on cooling / heating):
 First horizontal line is at 1490°C, and with low 0.16 %C where
PERITECTIC reaction takes place:
Liquid + δ iron <-> austenite
 Second horizontal line is at 1130°C, and with 4.3wt% C where
EUTECTIC reaction takes place:
Liquid <-> austenite + cementite
 Third horizontal line is at 723°C, and 0.8% C where EUTECTOID
reaction takes place:
Austenite <-> ferrite + cementite
The Austenite to ferrite / cementite transformation in
relation to Fe-C diagram:
Hypo-eutectoid steels: Steels having less than 0.8% carbon are called hypo-
eutectoid steels (hypo means "less than").
Consider the cooling of a typical hypo-eutectoid alloy along line y-y‘.
At high temperatures the material is entirely austenite.
Upon cooling it enters a region where the stable phases are ferrite and austenite.
Cont…
 The low-carbon ferrite nucleates and grows, leaving the remaining
austenite richer in carbon.
Hypo-eutectoid steels- At 723°C, the remaining austenite will
have assumed the eutectoid composition (0.8% carbon), and further
cooling transforms it to pearlite.
 The resulting structure, is a mixture of primary or pro- eutectoid
ferrite (ferrite that forms before the eutectoid reaction) and regions
of pearlite.
CAST IRON
Iron-Carbon alloys of 2.11%C or more are cast irons.
Typical composition: 2.0- 4.0%C,0.5-3.0% Si, less than
1.0% Mn and less than 0.2% S.
Si-substitutes partially for C and promotes formation
of graphite as the carbon rich component instead
Fe3C.
APPLICATIONS
It is used tailor properties of steel and to heat
treat them.
It is also used for comparison of crystal
structures for metallurgists in case of rupture or
fatigue.
THANK YOU

Iron Carbon Equilibrium Diagram

  • 1.
  • 3.
    In their simplestform, steels are alloys of Iron (Fe) and Carbon (C). The Fe-C phase diagram is a fairly complex one, but we will only consider the steel and cast iron part of the diagram, up to 6.67% Carbon.
  • 4.
  • 5.
    IRON ALLOTROPY  Ironis relatively soft and ductile metal.  Iron is allotropic metal which means that it exist in more than one type of lattice structure(BCC/FCC) depending upon temperature.  In normal room temperature state iron is BCC in lattice arrangement where as at 908 deg.C  it changes to FCC and then 1403 deg.C back to BCC again and vice versa.  About 770 deg.C the room temperature magnetic properties of iron disappear and it becomes non magnetic called curie point..
  • 6.
    Unit Cells ofVarious Metals The unit cell for:- (a) Austenite (b) Ferrite (c) Martensite
  • 7.
    Various phases thatappear on the Iron- Carbon equilibrium phase diagram are as under: •Ferrite •Austenite •Cementite DIFFERENT STRUCTURES
  • 8.
    FERRITE  Ferrite isknown as α solid solution.  It is an interstitial solid solution of a small amount of carbon dissolved in α (BCC) iron.  Stable form of iron below 912 deg.C  The maximum solubility is 0.025 % C at 723°C and it dissolves only 0.008 % C at room temperature.  It is the softest structure that appears on the diagram.
  • 9.
     Austenite isan solid solution of Carbon dissolved in γ (F.C.C.) iron.  Maximum solubility is 2.0 % C at 1130°C.  High formability, most of heat treatments begin with this single phase. AUSTENITE
  • 10.
    CEMENTITE  Cementite oriron carbide, is very hard, brittle intermetallic compound of iron & carbon, as Fe3C, contains 6.67 % C.  It is the hardest structure that appears on the diagram, exact melting point unknown.
  • 11.
    THE IRON CARBONDIAGRAM A map of the temperature at which different phase changes occur on very slow heating and cooling in relation to Carbon, is called Iron- Carbon Diagram. Iron- Carbon diagram shows:- A. The type of alloys formed under very slow cooling. B. Proper heat-treatment temperature and C. How the properties of steels and cast irons can be radically changed by heat-treatment.
  • 12.
    It is thegraphical representation of the effect of temperature and composition upon the phase present in alloy. An equilibrium diagram is constructed by plotting temp. along Y axis and % of C along X axis. This diagram shows range of temp & composition within which the various phases change are stable and also the boundaries at which the phase change occurs.
  • 15.
    Reactions: • Peritectic L+ δ = γ • Eutectic L = γ + Fe3C • Eutectoid γ = α + Fe3C Various Features OF Fe-C Diagram PHASES PRESENT IMPORTANT: Max. solubility of C in ferrite=0.022% Max. solubility of C in austenite=2.11%
  • 16.
    THREE PHASE REACTIONS Peritectic,at 1490 deg.C, with low 0.16 wt% C alloys (almost no engineering importance). Eutectic, at 1130 deg.C, with 4.3wt% C, alloys called cast irons. Eutectoid, at 723 deg.C with eutectoid composition of 0.8wt% C, two-phase mixture (ferrite & cementite). They are steels.
  • 18.
    The diagram showsthree horizontal lines which indicate isothermal reactions (on cooling / heating):  First horizontal line is at 1490°C, and with low 0.16 %C where PERITECTIC reaction takes place: Liquid + δ iron <-> austenite  Second horizontal line is at 1130°C, and with 4.3wt% C where EUTECTIC reaction takes place: Liquid <-> austenite + cementite  Third horizontal line is at 723°C, and 0.8% C where EUTECTOID reaction takes place: Austenite <-> ferrite + cementite
  • 19.
    The Austenite toferrite / cementite transformation in relation to Fe-C diagram: Hypo-eutectoid steels: Steels having less than 0.8% carbon are called hypo- eutectoid steels (hypo means "less than"). Consider the cooling of a typical hypo-eutectoid alloy along line y-y‘. At high temperatures the material is entirely austenite. Upon cooling it enters a region where the stable phases are ferrite and austenite.
  • 20.
    Cont…  The low-carbonferrite nucleates and grows, leaving the remaining austenite richer in carbon. Hypo-eutectoid steels- At 723°C, the remaining austenite will have assumed the eutectoid composition (0.8% carbon), and further cooling transforms it to pearlite.  The resulting structure, is a mixture of primary or pro- eutectoid ferrite (ferrite that forms before the eutectoid reaction) and regions of pearlite.
  • 21.
    CAST IRON Iron-Carbon alloysof 2.11%C or more are cast irons. Typical composition: 2.0- 4.0%C,0.5-3.0% Si, less than 1.0% Mn and less than 0.2% S. Si-substitutes partially for C and promotes formation of graphite as the carbon rich component instead Fe3C.
  • 22.
    APPLICATIONS It is usedtailor properties of steel and to heat treat them. It is also used for comparison of crystal structures for metallurgists in case of rupture or fatigue.
  • 23.