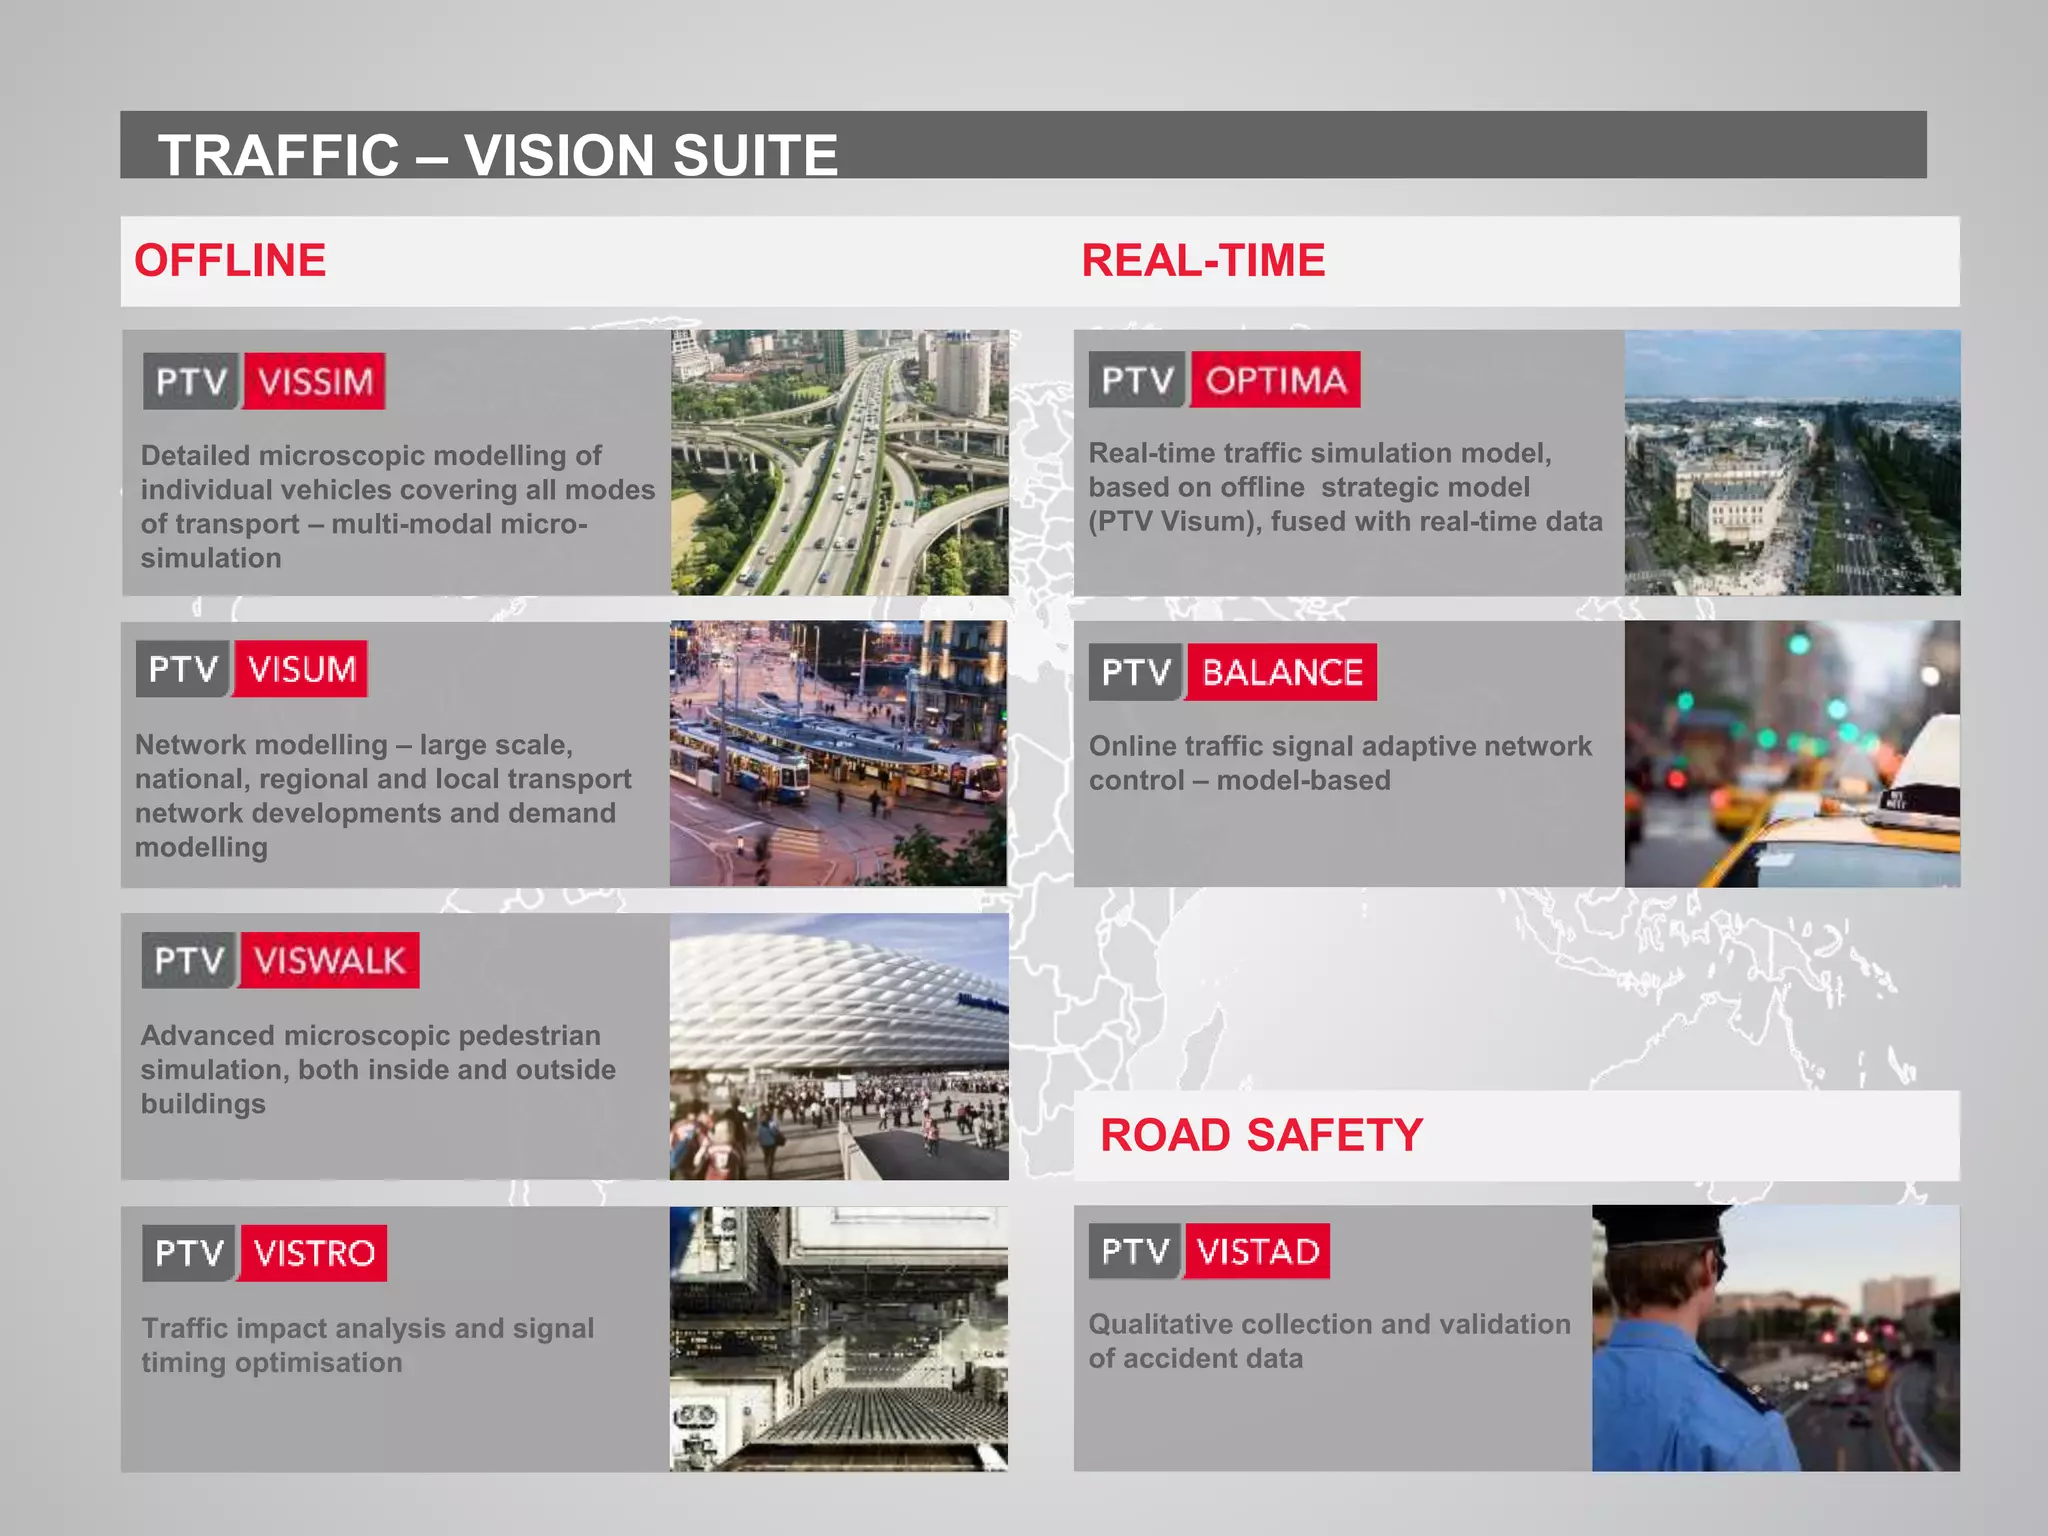
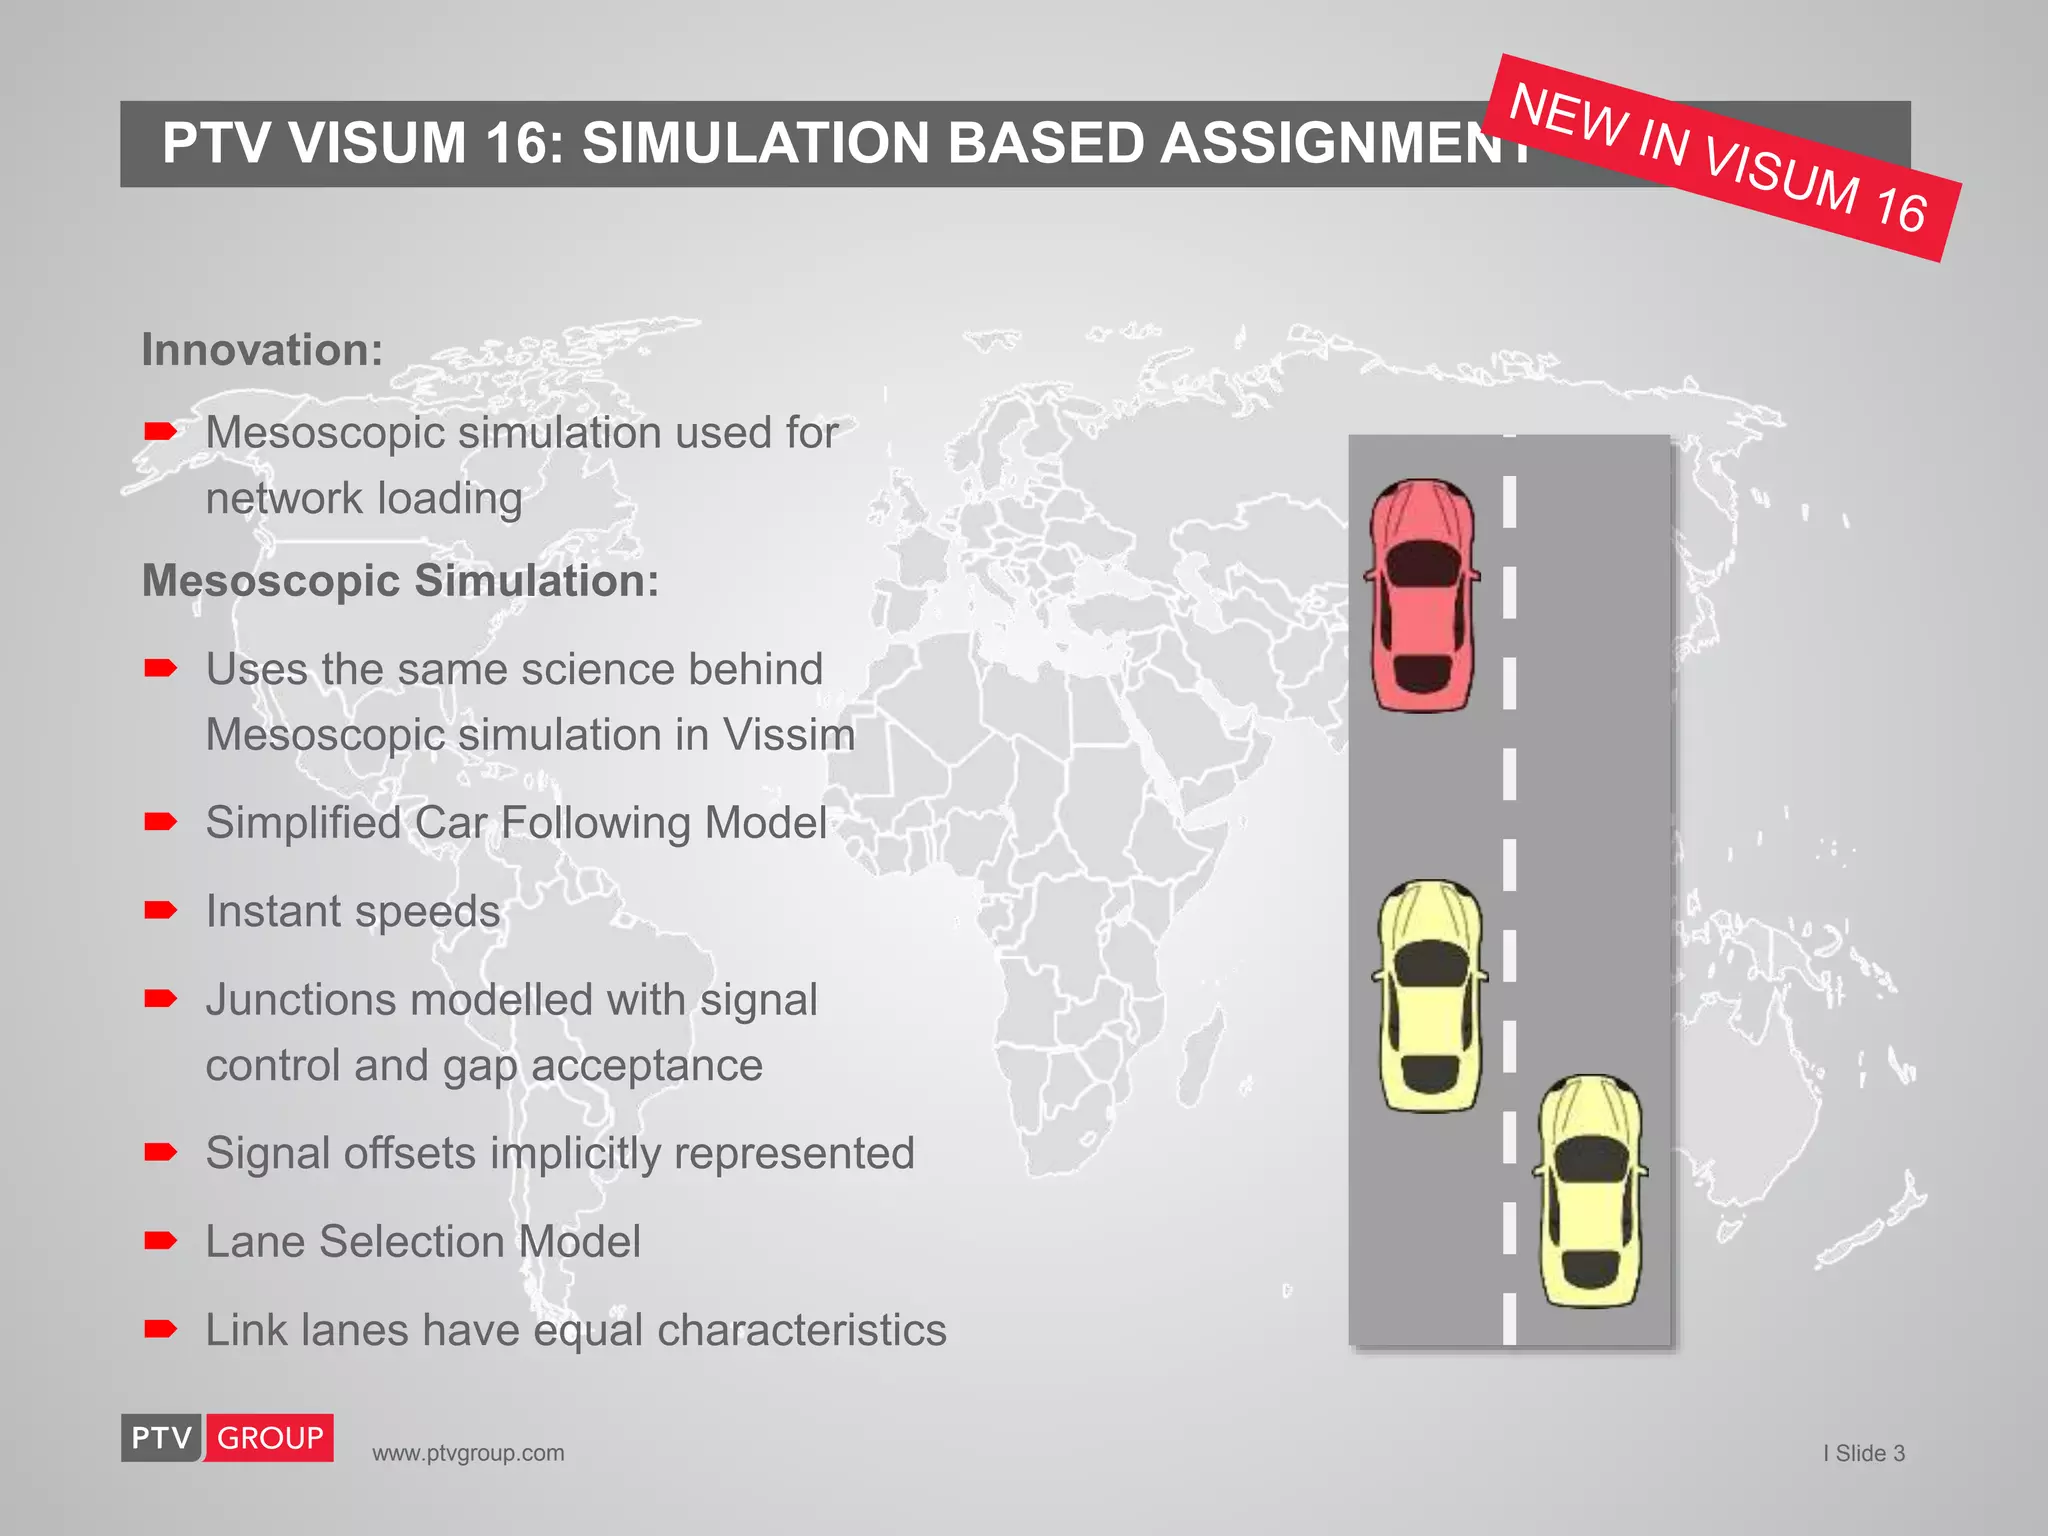
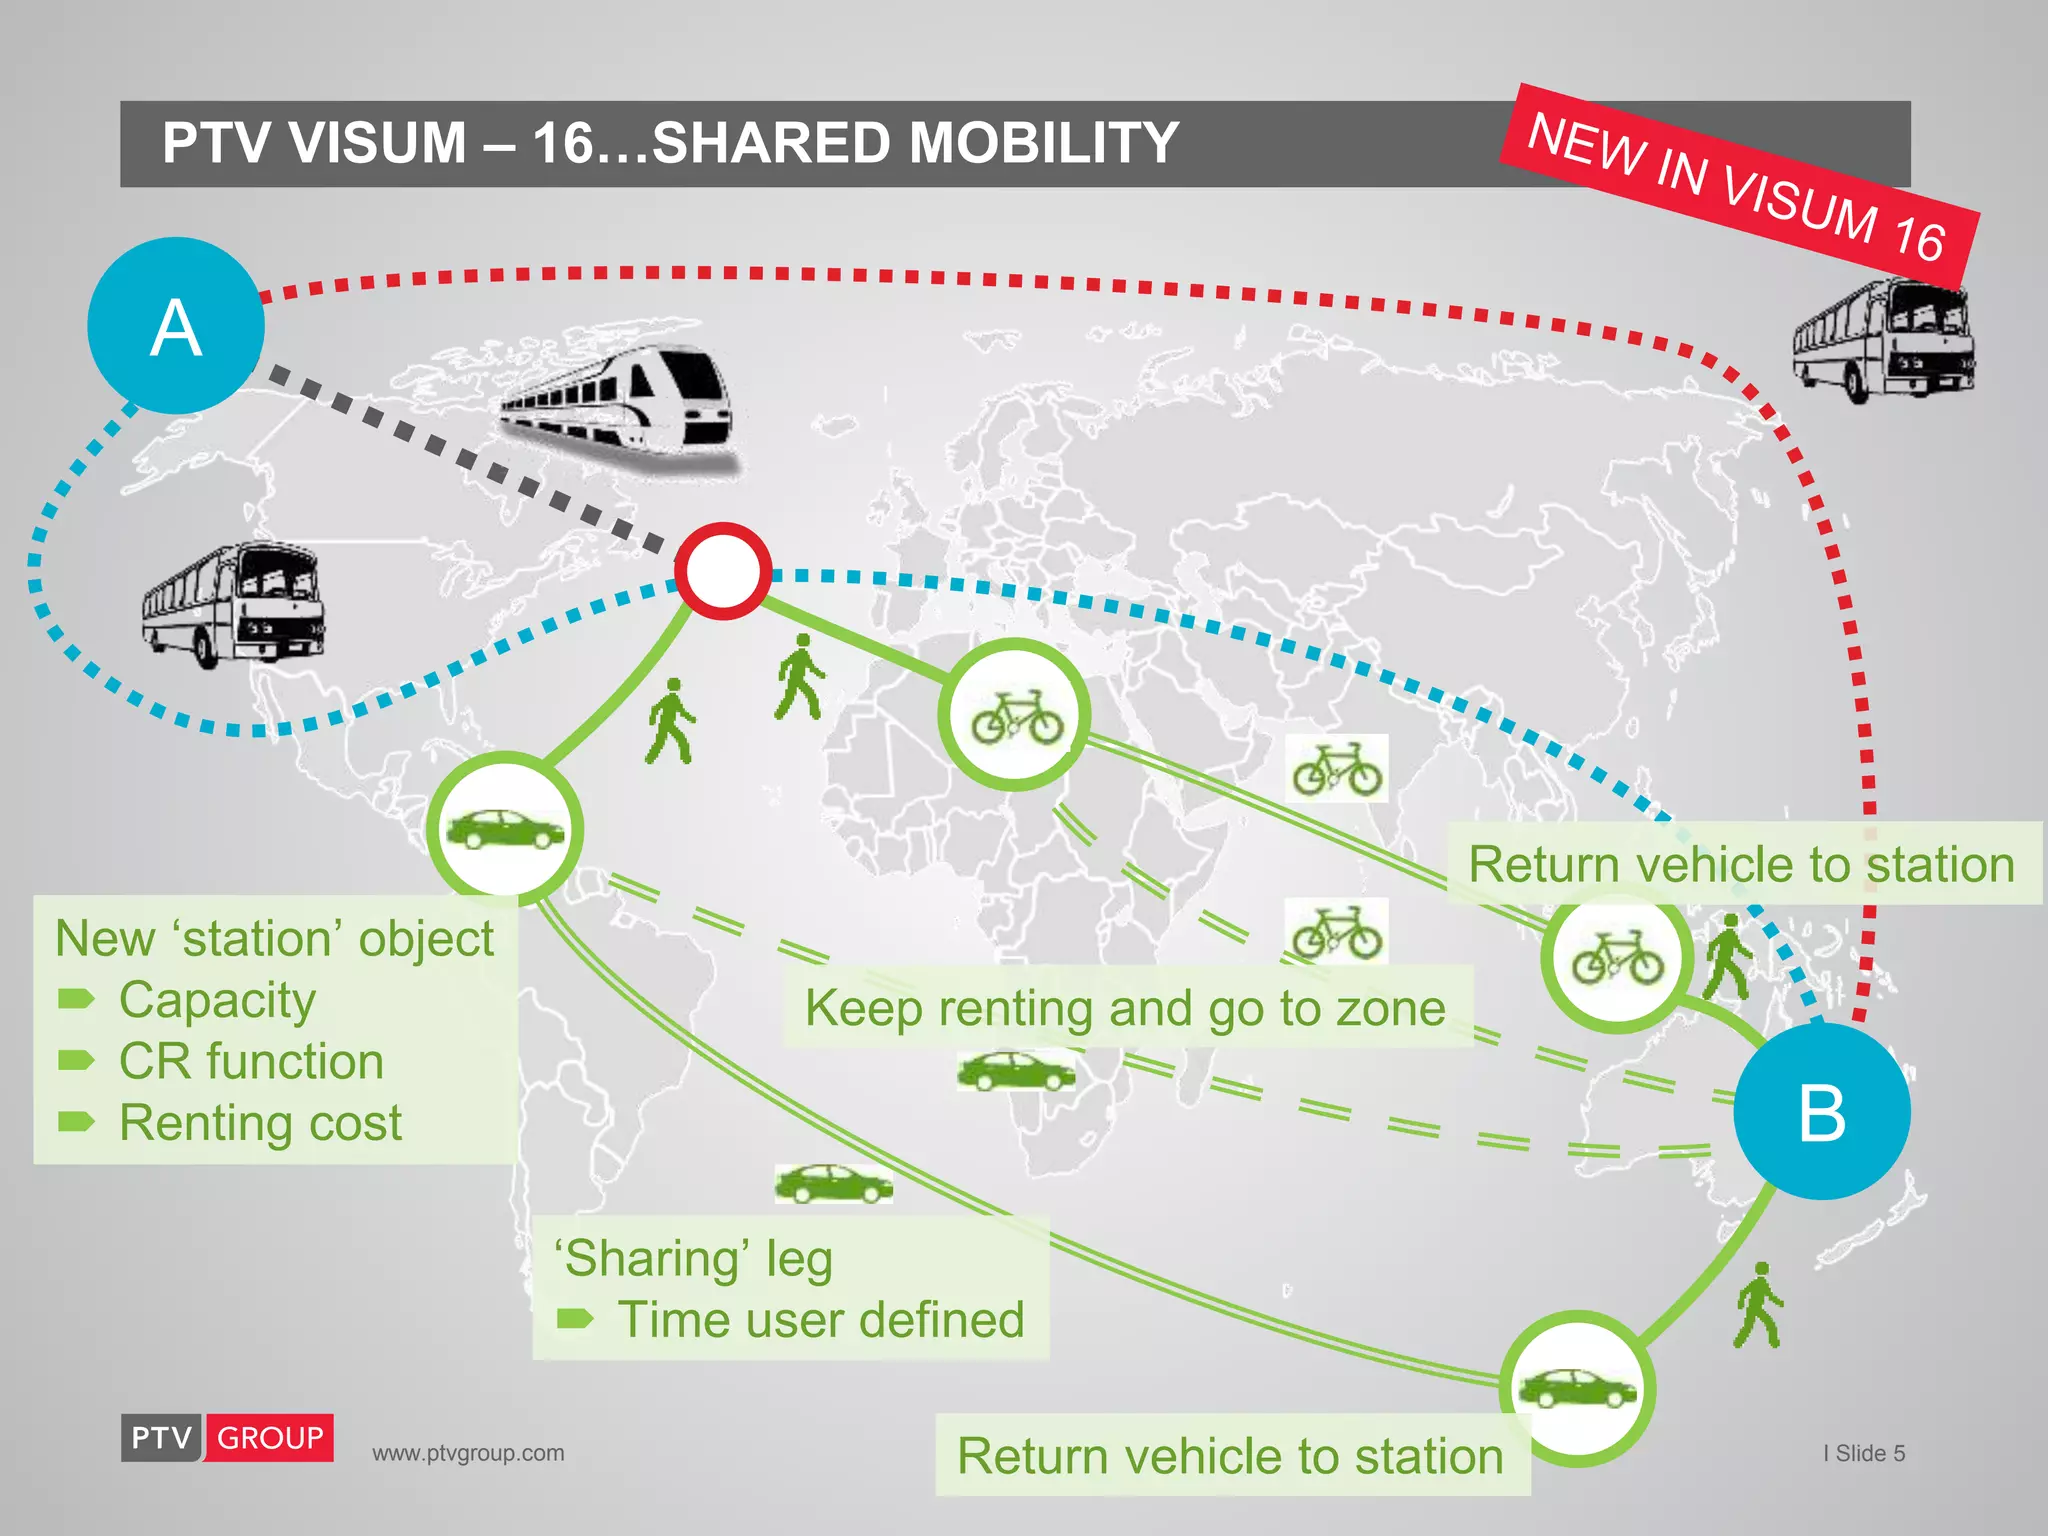
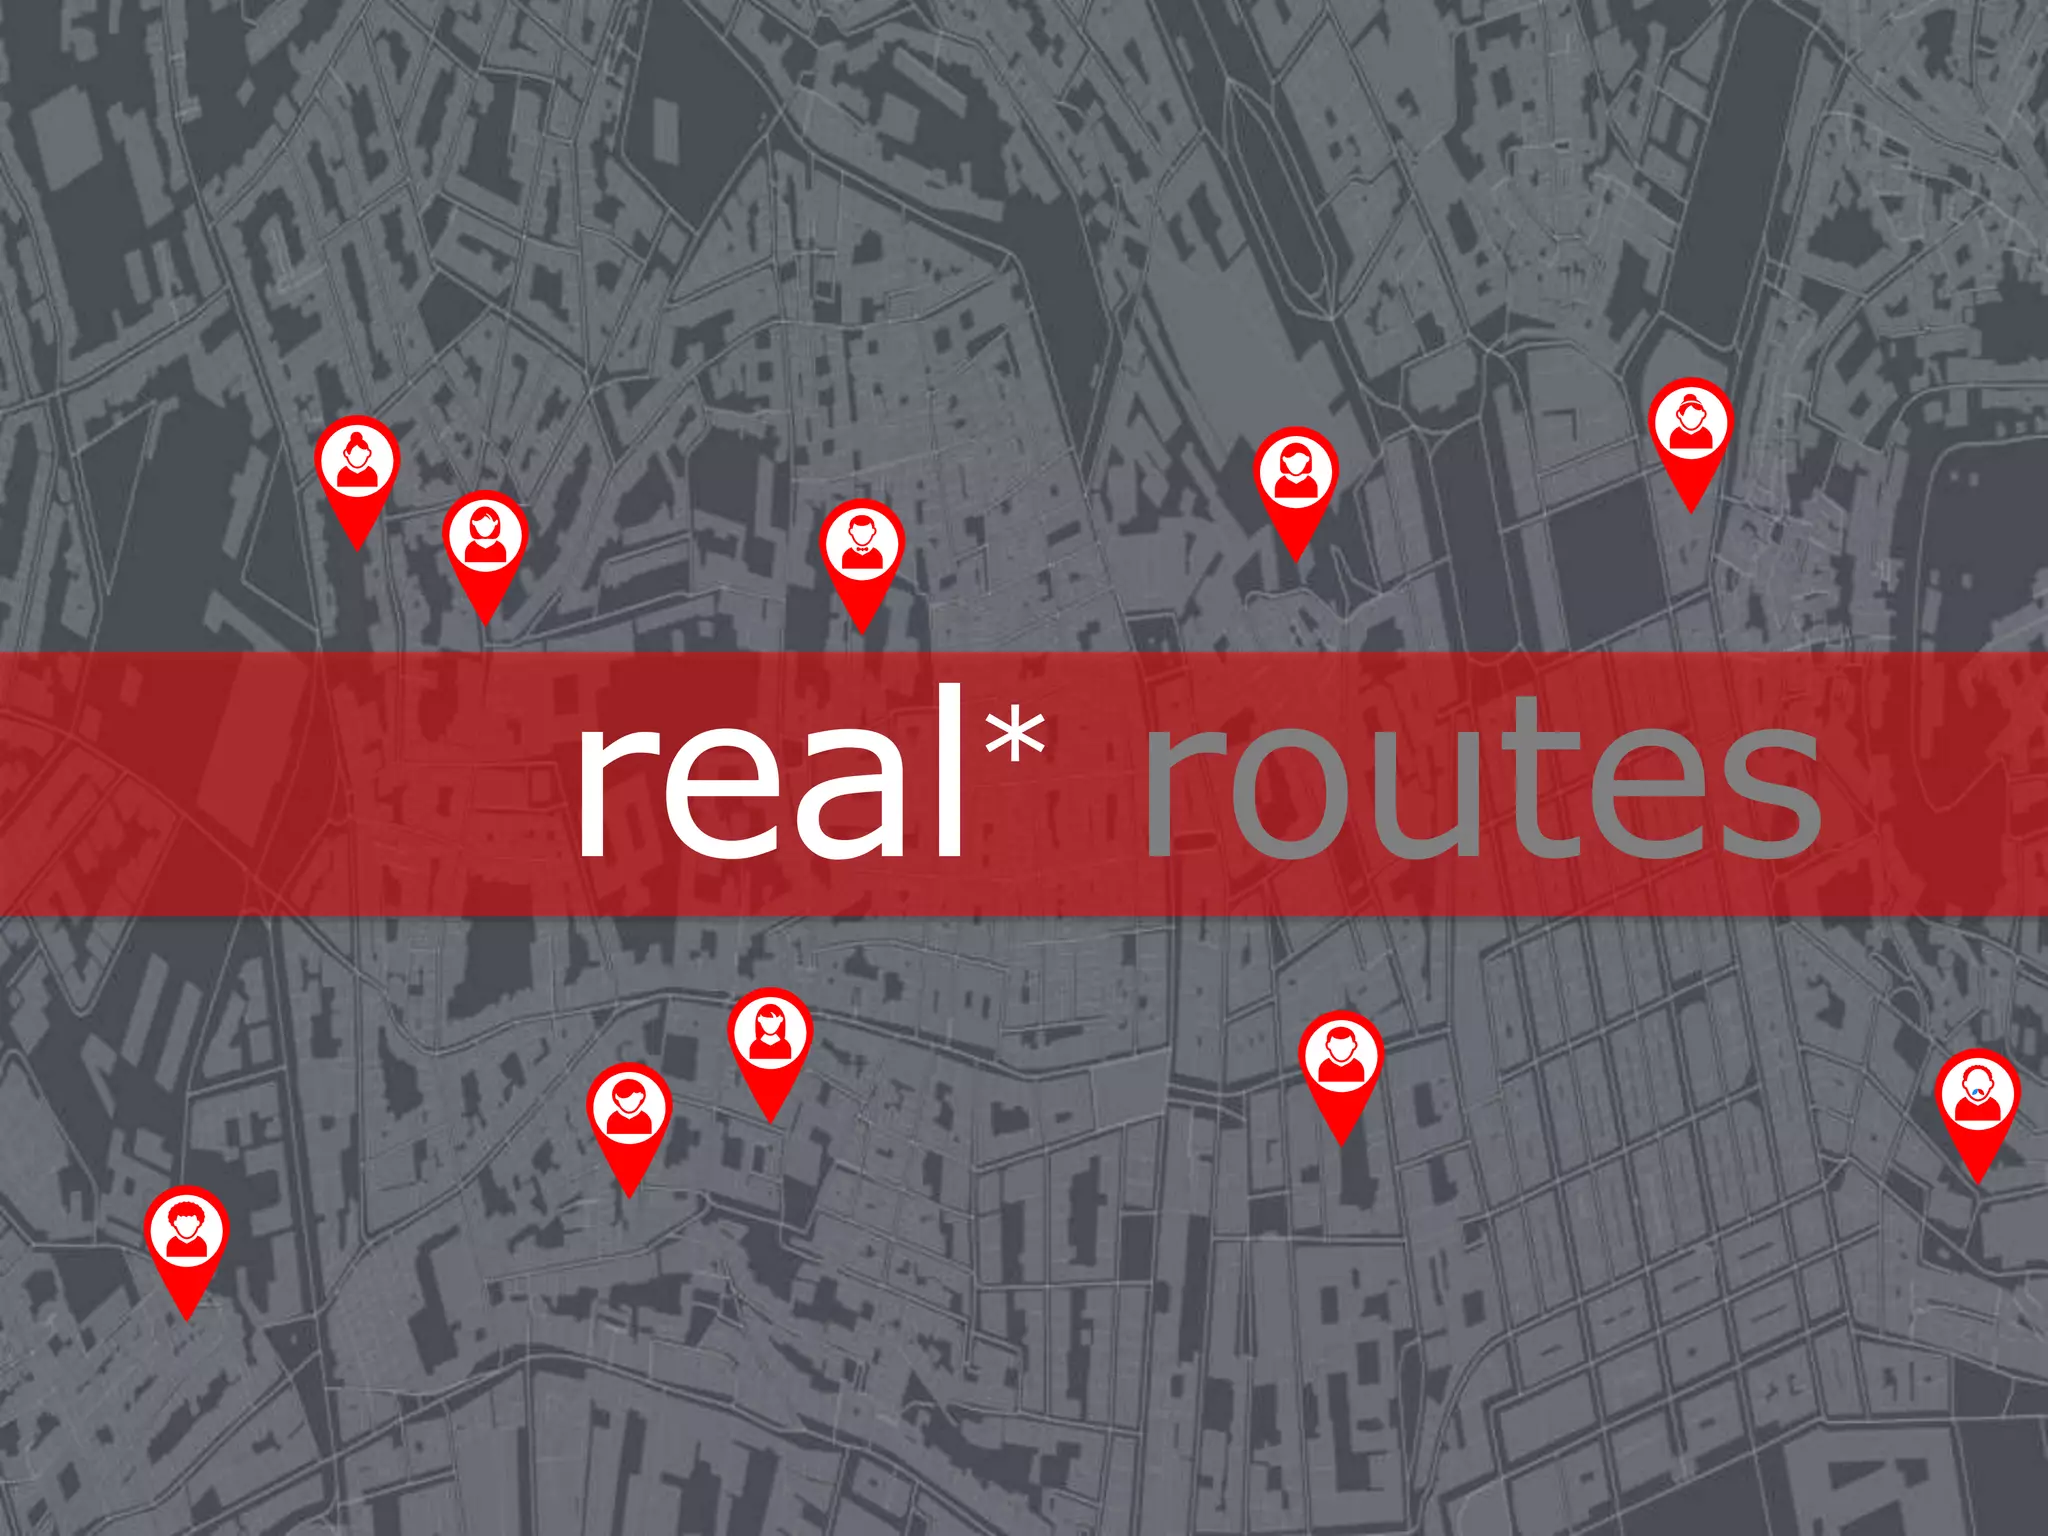
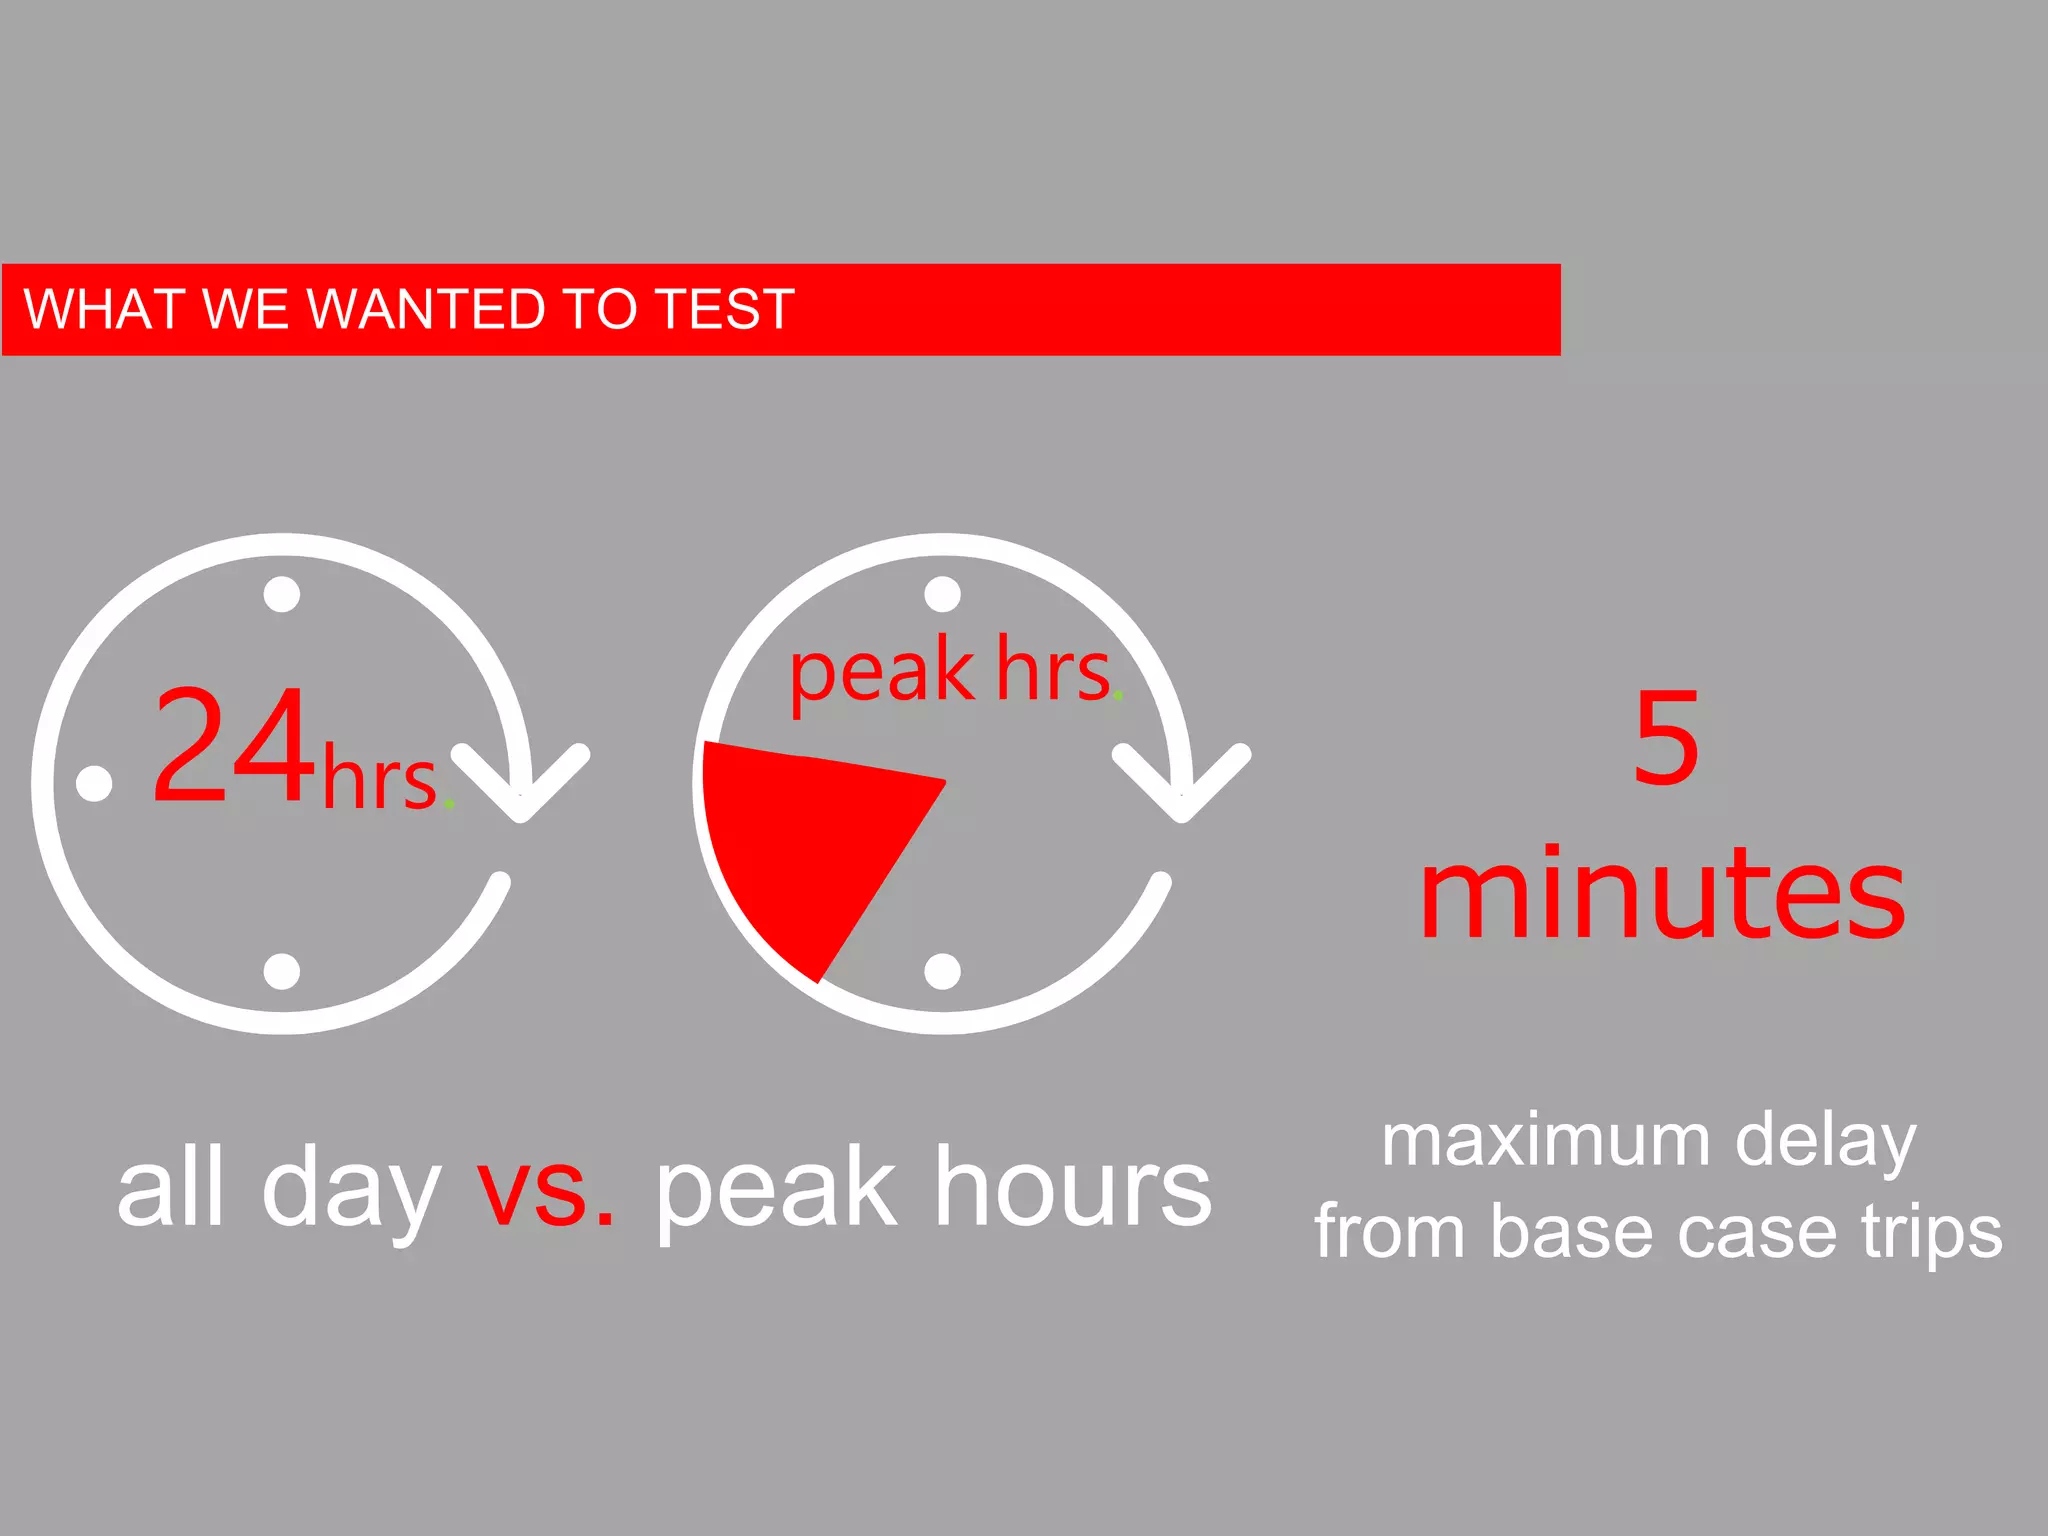
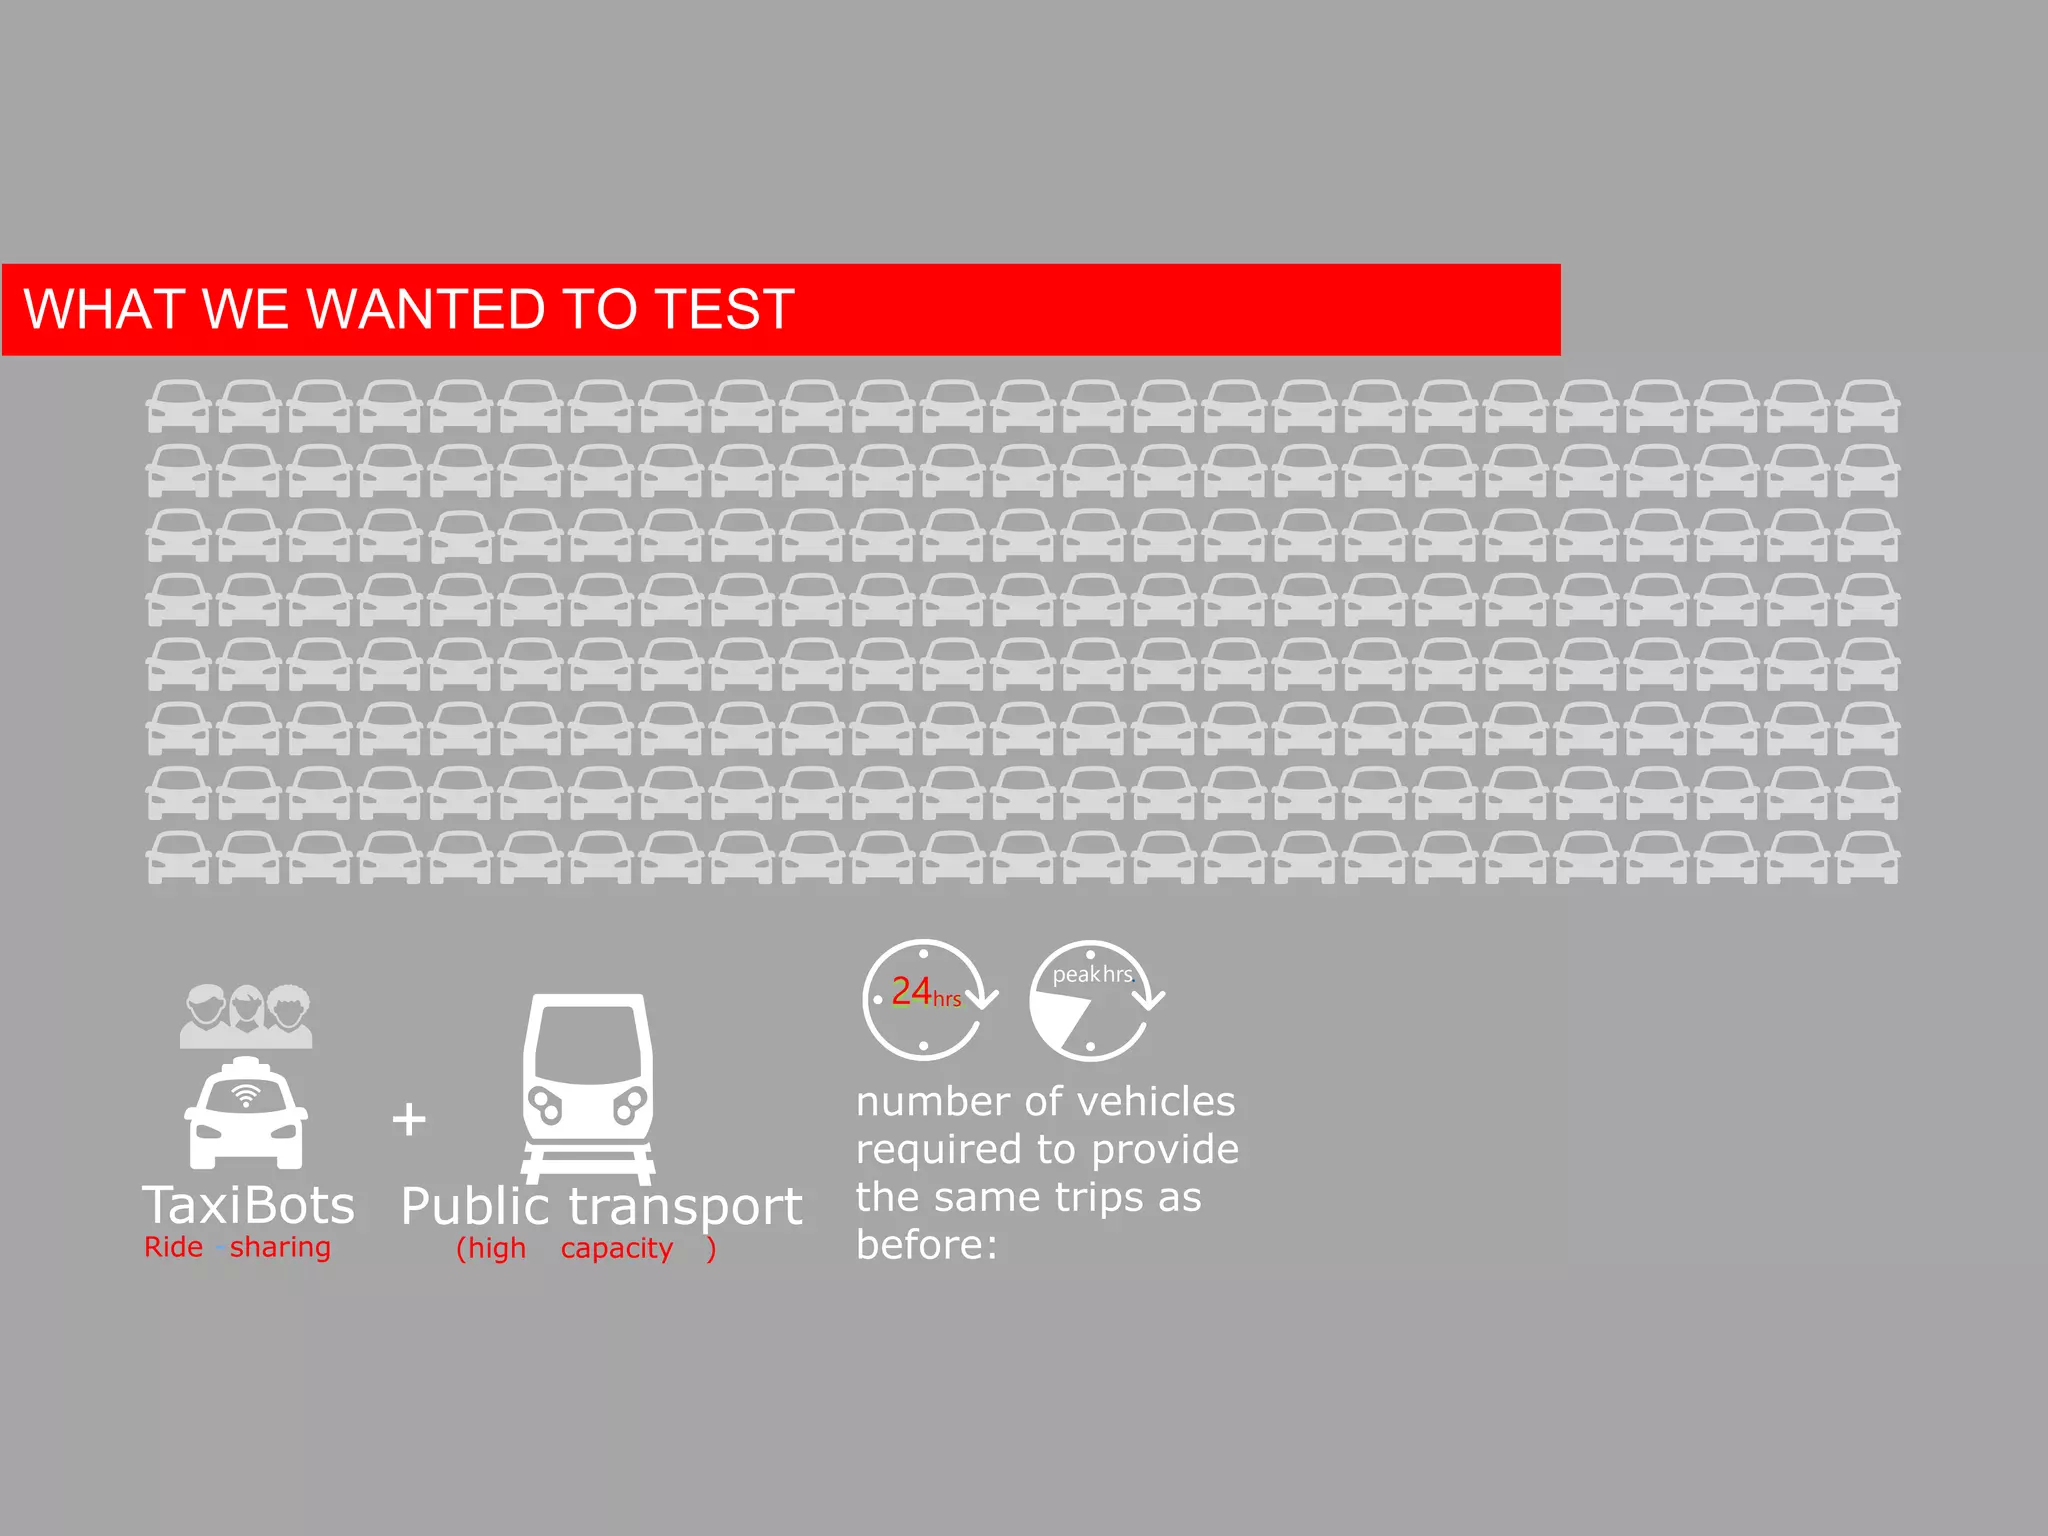
www.ptvgroup.com I Slide 1
www.ptvgroup.com
TRANSPORT MODELLING WORKSHOP
SOFTWARE INNOVATION
www.ptvgroup.com I Slide 2
TRAFFIC – VISION SUITE
Qualitative collection and validation
of accident data
OFFLINE REAL-TIME
ROAD SAFETY
Advanced microscopic pedestrian
simulation, both inside and outside
buildings
Network modelling – large scale,
national, regional and local transport
network developments and demand
modelling
Traffic impact analysis and signal
timing optimisation
Detailed microscopic modelling of
individual vehicles covering all modes
of transport – multi-modal micro-
simulation
Real-time traffic simulation model,
based on offline strategic model
(PTV Visum), fused with real-time data
Online traffic signal adaptive network
control – model-based
www.ptvgroup.com I Slide 3
PTV VISUM 16: SIMULATION BASED ASSIGNMENT
Innovation:
 Mesoscopic simulation used for
network loading
Mesoscopic Simulation:
 Uses the same science behind
Mesoscopic simulation in Vissim
 Simplified Car Following Model
 Instant speeds
 Junctions modelled with signal
control and gap acceptance
 Signal offsets implicitly represented
 Lane Selection Model
 Link lanes have equal characteristics
www.ptvgroup.com I Slide 4
Vissim Meso/Operations Model
PTV Visum Macroscopic Model
MULTI-RESOLUTION MODELLING
Visum Meso/Operations Model Hybrid/Microsimulation Model
Demand Granularity
Demand model type
Traveller types
Activities
Modes
Time Periods / 24h
Supply Granularity
Assignment method
Time Periods / 24h
Multi-modality
Zoning system
Link coverage
Junction representation
Assignment with ICA
Quasi-dynamic
Least model dev. effort
Hybrid Meso/Micro
Most expressive option
3D visualisation
Junction design
Adaptive signals
Adaptive traffic mgmt.
+++
Simulation-Based Asgmt.
Dynamic
Simulation
Moderate dev. effort
Hybrid Meso/Micro
Dynamic
Simulation
Greater dev. effort
www.ptvgroup.com I Slide 5
PTV VISUM – 16…SHARED MOBILITY
A
B
New ‘station’ object
 Capacity
 CR function
 Renting cost
‘Sharing’ leg
 Time user defined
Keep renting and go to zone
Return vehicle to station
www.ptvgroup.com I Slide 6
6
CURRENT CPB PARTNERS
OECD ITF – SHARE AUTONOMOUS VEHICLE PROJECT
real city
real* trips
real* routes
TaxiBot
ride-sharing
AutoVot
car-sharing
Public Transport
High-Capacity
SHARED AUTONOMOUS VEHICLES?
all day vs. peak hours
24hrs.
peak hrs.
maximum delay
from base case trips
5
minutes
WHAT WE WANTED TO TEST
number of vehicles
required to provide
the same trips as
before:
24hrs.
peakhrs.
WHAT WE WANTED TO TEST
+
24hrs.
TaxiBots
Ride -sharing
Public transport
(high capacity )
number of vehicles
required to provide
the same trips as
before: 10%
Scenario: 24 hours
+
24hrs.
THE IMPACT ON VEHICLE NUMBERS
TaxiBots
Ride -sharing
Public transport
(high capacity )
number of vehicles
required to provide
the same trips as
before: 35%+
peakhrs.
THE IMPACT ON VEHICLE NUMBERS
TaxiBots
Ride -sharing
Public transport
(high capacity )
www.ptvgroup.com I Slide 15
PTV VISUM – EUROPEAN TRANSPORT MODEL – OVERVIEW
 European Commission
 Strategic planning model
 All 28 EU member states and surrounding countries
 Inform investment decisions for European freight and
passenger corridors
 Better coordination and planning decisions
 E.g. how would a new rail link through Siberia affect the
cost of moving goods from China?
 E.g. fuel prices, emissions…
www.ptvgroup.com I Slide 16
PTV OPTIMA – PUBLIC TRANSPORT
 Current ETA generally based on
statistical approach.
 Lack of real time information on
impact of different modes on each
other.
 Optima PuT predicts future effects
for the next stops and evaluates
alternative strategies.
 Provide reliable, on-time, PuT
information to commuters and
visitors.
 ETA for all lines and alerts for
predefined missing interchanges.
 Real time passenger flow for
forecast about PuT occupancy.
www.ptvgroup.com I Slide 17
360° SMARTPHONE APPS
Your City App
Real-time, multimodal travel planning
Citizen/tourist advice and alerts
Influence mobility behaviour
Shared mobility
GPX Importer
Smartcard Importer
Mobility Surveys
Live data: mobile phone, GPS, detectors
City intervention: diversions, special events
Continuous & real-time
Offline planning
Continuous & real-time
www.ptvgroup.com I Slide 18
 Focused on usability and speeding
up the modelling process.
 Additions to Scenario Management
which allows comparison of results
graphically.
 Matrices are included within the
GUI rather than being read in
externally.
 Background maps available in 3d
mode.
 Network checking prior to
simulation run.
 HCM results for nodes.
PTV VISSIM 9 – NEW FEATURES
www.ptvgroup.com I Slide 19
PTV VISWALK 9 – ELEVATORS
www.ptvgroup.com I Slide 20
 UK Department for Transport commissioned study to
simulate the impacts Connected Autonomous
Vehicles (CAV’s) may have on traffic flow and
capacity.
 Atkins consultants created a number of Vissim
models to replicate conditions across the UK’s trunk
road network.
 COM Interface adopted to configure CAV’s to
change behavior according to the traffic situation.
 Considered whether CAV’s would be more cautious
in their behavior and the impact this has on road
capacity.
PTV VISSIM – AUTONOMOUS VEHICLE MODELLING
www.ptvgroup.com I Slide 21
PTV VISSIM – URBAN CYCLING SCHEMES
 FCL ETH in partnership with PTV developing a cycling simulator;
 Explore VR as a new tool for transport and urban planning;
 Develop street designs that are responsive to future forms of mobility;
 PTV Vissim as the traffic simulator;
 ESRI City Engine as design configurator;
 Unity as gaming engine.
www.ptvgroup.com I Slide 22
PTV VISSIM: MESOSCOPIC SIMULATION
Bridge Closure
Bridge Closure
Route of diverted traffic determined in meso
through dynamic assignment
Network Performance
Do alternative routes maintain sufficient
Level of Service?
Mitigation Measures
Are temporary mitigation measures required
to accommodate additional traffic flow?
Scenario Management
Performance across multiple scenarios (AM,
PM) and modifications (mitigations etc)
Solution
Optimal solution identified based on
achieving balanced network
www.ptvgroup.com I Slide 23
PTV GROUP - BETA TESTING
Early access to pre-release versions of the
software.
Members will get:
 Hands on experience of new features before
anyone else
 Chance to influence development
 Chance to work more closely with PTV
development team
Download from:
http://your.visum.ptvgroup.com/Betatest2016
www.ptvgroup.com I Slide 24www.ptvgroup.comwww.ptvgroup.com

Transport Modelling Workshop Software Innovation

  • 1.
    www.ptvgroup.com I Slide1 www.ptvgroup.com TRANSPORT MODELLING WORKSHOP SOFTWARE INNOVATION
  • 2.
    www.ptvgroup.com I Slide2 TRAFFIC – VISION SUITE Qualitative collection and validation of accident data OFFLINE REAL-TIME ROAD SAFETY Advanced microscopic pedestrian simulation, both inside and outside buildings Network modelling – large scale, national, regional and local transport network developments and demand modelling Traffic impact analysis and signal timing optimisation Detailed microscopic modelling of individual vehicles covering all modes of transport – multi-modal micro- simulation Real-time traffic simulation model, based on offline strategic model (PTV Visum), fused with real-time data Online traffic signal adaptive network control – model-based
  • 3.
    www.ptvgroup.com I Slide3 PTV VISUM 16: SIMULATION BASED ASSIGNMENT Innovation:  Mesoscopic simulation used for network loading Mesoscopic Simulation:  Uses the same science behind Mesoscopic simulation in Vissim  Simplified Car Following Model  Instant speeds  Junctions modelled with signal control and gap acceptance  Signal offsets implicitly represented  Lane Selection Model  Link lanes have equal characteristics
  • 4.
    www.ptvgroup.com I Slide4 Vissim Meso/Operations Model PTV Visum Macroscopic Model MULTI-RESOLUTION MODELLING Visum Meso/Operations Model Hybrid/Microsimulation Model Demand Granularity Demand model type Traveller types Activities Modes Time Periods / 24h Supply Granularity Assignment method Time Periods / 24h Multi-modality Zoning system Link coverage Junction representation Assignment with ICA Quasi-dynamic Least model dev. effort Hybrid Meso/Micro Most expressive option 3D visualisation Junction design Adaptive signals Adaptive traffic mgmt. +++ Simulation-Based Asgmt. Dynamic Simulation Moderate dev. effort Hybrid Meso/Micro Dynamic Simulation Greater dev. effort
  • 5.
    www.ptvgroup.com I Slide5 PTV VISUM – 16…SHARED MOBILITY A B New ‘station’ object  Capacity  CR function  Renting cost ‘Sharing’ leg  Time user defined Keep renting and go to zone Return vehicle to station Return vehicle to station
  • 6.
    www.ptvgroup.com I Slide6 6 CURRENT CPB PARTNERS OECD ITF – SHARE AUTONOMOUS VEHICLE PROJECT
  • 7.
  • 8.
  • 9.
  • 10.
  • 11.
    all day vs.peak hours 24hrs. peak hrs. maximum delay from base case trips 5 minutes WHAT WE WANTED TO TEST
  • 12.
    number of vehicles requiredto provide the same trips as before: 24hrs. peakhrs. WHAT WE WANTED TO TEST + 24hrs. TaxiBots Ride -sharing Public transport (high capacity )
  • 13.
    number of vehicles requiredto provide the same trips as before: 10% Scenario: 24 hours + 24hrs. THE IMPACT ON VEHICLE NUMBERS TaxiBots Ride -sharing Public transport (high capacity )
  • 14.
    number of vehicles requiredto provide the same trips as before: 35%+ peakhrs. THE IMPACT ON VEHICLE NUMBERS TaxiBots Ride -sharing Public transport (high capacity )
  • 15.
    www.ptvgroup.com I Slide15 PTV VISUM – EUROPEAN TRANSPORT MODEL – OVERVIEW  European Commission  Strategic planning model  All 28 EU member states and surrounding countries  Inform investment decisions for European freight and passenger corridors  Better coordination and planning decisions  E.g. how would a new rail link through Siberia affect the cost of moving goods from China?  E.g. fuel prices, emissions…
  • 16.
    www.ptvgroup.com I Slide16 PTV OPTIMA – PUBLIC TRANSPORT  Current ETA generally based on statistical approach.  Lack of real time information on impact of different modes on each other.  Optima PuT predicts future effects for the next stops and evaluates alternative strategies.  Provide reliable, on-time, PuT information to commuters and visitors.  ETA for all lines and alerts for predefined missing interchanges.  Real time passenger flow for forecast about PuT occupancy.
  • 17.
    www.ptvgroup.com I Slide17 360° SMARTPHONE APPS Your City App Real-time, multimodal travel planning Citizen/tourist advice and alerts Influence mobility behaviour Shared mobility GPX Importer Smartcard Importer Mobility Surveys Live data: mobile phone, GPS, detectors City intervention: diversions, special events Continuous & real-time Offline planning Continuous & real-time
  • 18.
    www.ptvgroup.com I Slide18  Focused on usability and speeding up the modelling process.  Additions to Scenario Management which allows comparison of results graphically.  Matrices are included within the GUI rather than being read in externally.  Background maps available in 3d mode.  Network checking prior to simulation run.  HCM results for nodes. PTV VISSIM 9 – NEW FEATURES
  • 19.
    www.ptvgroup.com I Slide19 PTV VISWALK 9 – ELEVATORS
  • 20.
    www.ptvgroup.com I Slide20  UK Department for Transport commissioned study to simulate the impacts Connected Autonomous Vehicles (CAV’s) may have on traffic flow and capacity.  Atkins consultants created a number of Vissim models to replicate conditions across the UK’s trunk road network.  COM Interface adopted to configure CAV’s to change behavior according to the traffic situation.  Considered whether CAV’s would be more cautious in their behavior and the impact this has on road capacity. PTV VISSIM – AUTONOMOUS VEHICLE MODELLING
  • 21.
    www.ptvgroup.com I Slide21 PTV VISSIM – URBAN CYCLING SCHEMES  FCL ETH in partnership with PTV developing a cycling simulator;  Explore VR as a new tool for transport and urban planning;  Develop street designs that are responsive to future forms of mobility;  PTV Vissim as the traffic simulator;  ESRI City Engine as design configurator;  Unity as gaming engine.
  • 22.
    www.ptvgroup.com I Slide22 PTV VISSIM: MESOSCOPIC SIMULATION Bridge Closure Bridge Closure Route of diverted traffic determined in meso through dynamic assignment Network Performance Do alternative routes maintain sufficient Level of Service? Mitigation Measures Are temporary mitigation measures required to accommodate additional traffic flow? Scenario Management Performance across multiple scenarios (AM, PM) and modifications (mitigations etc) Solution Optimal solution identified based on achieving balanced network
  • 23.
    www.ptvgroup.com I Slide23 PTV GROUP - BETA TESTING Early access to pre-release versions of the software. Members will get:  Hands on experience of new features before anyone else  Chance to influence development  Chance to work more closely with PTV development team Download from: http://your.visum.ptvgroup.com/Betatest2016
  • 24.
    www.ptvgroup.com I Slide24www.ptvgroup.comwww.ptvgroup.com

Editor's Notes

  • #4 A key feature of Visum 16, released this year, is the new simulation-based dynamic assignment: A key aspect of this assignment is that the network loading stage is made using the same mesoscopic simulation behind Vissim Meso This means that SBA is closer to microsimulation than other mesoscopic methods Just like in Vissim, the simulation is based on the a simplified car following model: Furthermore: Vehicles travel at their desired speeds unless impeded by the vehicle in front Junctions are represented explicitly with individual vehicle movements, using the same junction editor as for ICA Signal timings and offsets are therefore explicitly represented, and gap acceptance rules are applied whenever there are conflicts Lane selection is made on entry to a link only, and not within a link The choice of lane is based on lane density, taking into account that the lane must enable the vehicle to remain on its route at the end of link IMPORTANT: This means that we can produce a result inside Visum that is almost identical to Vissim, ready for further analysis such as hybrid or microsimulation The benefit of this approach rather than a single product is that we can benefit from world-leading macroscopic and microscopic simulation without needing to sacrifice quality at either end
  • #5 The development of SBA gives our users more options for multi-resolution modelling, allowing them to choose the approach that is right for their needs At the macroscopic level, PTV Visum is most advanced and most used solution in the world At the microscopic level the same holds true for PTV Vissim – it’s connector structure allows for the most expressive and realistic representation of real traffic in the market. And we now offer multiple options for mesoscopic modelling: The option with least development effort, but also precision due to being a static approach, is Assignment with ICA. This method uses the HCM to calculate junction performance based on turning movements, conflicts and signal timings, and also represents blocking back and flow metering. It can therefore produce a capacity-constrained assignment that greatly improves the inputs to microsimulation The next option is the new SBA method which produces almost identical results to Vissim Meso, but requires additional data collection and calibration effort than Assignment with ICA. The third option is to drop directly in to Vissim Meso where users can make use of hybrid simulation and therefore benefit from the precision of microsimulation. This approach requires greater modelling effort than SBA, SBA can be used to develop bigger models, and with SBA users have the benefit of making use of the Visum data model for analysing matrices and routes etc.
  • #6 Visum already has the most advanced public transport functionality of any macro tools due to collaboration with DB over the last few decades This is being extended further to allow for sharing systems such as bike or car sharing Cities, transit and sharing system operators can now test the most effective strategies and forecast the usage for such systems Part of pt assignment and model and that model can have route with any public transport models, sharing car systems. Car sharing not ride sharing. Shared use of a pool of cars or bikes, can also be only that sharing system, cities can plan the best locations for the facilities. In addition to standard modes can also use shared system.
  • #7 PTV Group sit on the corporate partnership board of the International Transport Forum where PTV Visum was used to undertake a shared autonomous vehicle project at a macro scale
  • #11 Taxi-bots are where travelers share time and space by travelling in the same car simultaneously. AutoVots are where travelers use the same car sequentially, usually controlled by the owner or car fleet manager so it is a more private mode.
  • #14 Nearly the same mobility can be delivered with 10% of the cars
  • #16 This model is paid for by the European Commission and is to be used for strategic planning It will cover all 28 member states and surrounding countries. This will be a complex model, linking transport with the economy and energy There will be a feedback loop between these models and will include a detailed international freight module One particular challenge which will be solved and made available in a future release to all, is the complexity of certain routes. For example, it is quite feasbile for a traveller to use a complex mixture of modes such as rail, air, taxi and private car. These complex chains will be handled in a new assignment method.
  • #17 Optima is our real time traffic forecast solution Implementing Public Transport functionality Currently (ETA) is based on too simple algorithms, usually only with a statistic approach” “There is a lack of intermodal information on the impact of a transport system on another one (what happens if the bus is in delay and I miss the connection with the train?)” Optima allows for the propagation of traffic conditions from real time data, allowing different management strategies to be tested. This data can then be provided to commuters and visitors to provide a more realistic ETA forecast. Can be adopted across all PT lines and interchanges where people may miss connections. In the future we are looking to further develop into real time passenger flow data to provide commuters with info about current occupancy as well as for network planning.
  • #18 An area PTV is also active in is Apps, and it is through Apps that we seek to complete the circle between people and planning. PTV City App can be based on Optima therefore providing info on operational conditions and model based forecasting. The highlights are real-time traffic information and multimodal navigation for cars, public transport, bikes and pedestrians.  Adopted in Karlsruhe Germany users benefit from other information related to roadworks, parking spaces, park and ride options which are all combined with corresponding public transport timetables.