Download as PDF, PPTX


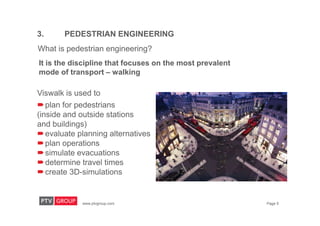
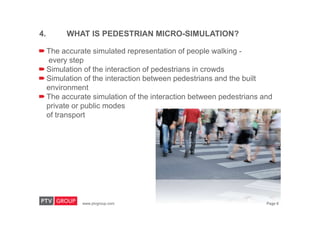


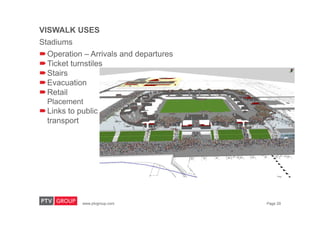

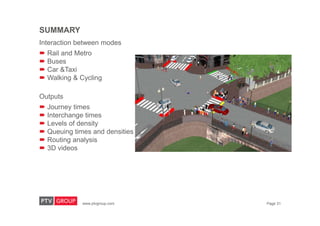


The document outlines the importance of pedestrian planning and engineering, emphasizing the role of walking as a crucial mode of transport, especially for accessing public transport. It details the uses of pedestrian micro-simulation software, such as PTV Viswalk, in planning, evaluating, and managing pedestrian environments, including interactions with vehicles and public transport. The document also highlights the benefits of pedestrian modeling in various disciplines, providing insights into journey times, pedestrian density, and overall pedestrian experience.