Downloaded 112 times


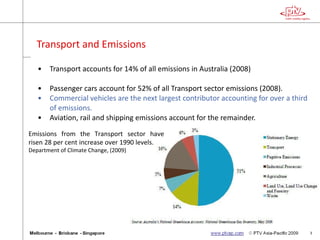

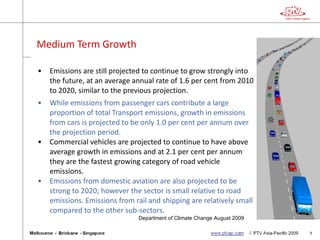


The document analyzes transport emissions in Australia, highlighting that transport accounts for 14% of total emissions, with passenger cars contributing 52% of that share. Emissions are projected to grow at an annual rate of 1.6% from 2010 to 2020, with commercial vehicles being the fastest-growing category. It discusses various pollutants generated by vehicular emissions and emphasizes the importance of software tools like VISSIM and ENVIVER for emissions modeling and transportation planning.