Downloaded 29 times


This document discusses capacity and level of service analysis for freeways. It covers topics such as capacity under ideal conditions, measures of effectiveness, levels of service criteria, operational analysis including calculating speed and level of service, and planning and design analysis including calculating service flow rates, service volumes, and number of lanes needed. Examples are provided for calculating free-flow speed, passenger car equivalents, operational analysis, service flow rates and volumes, and design analysis. Homework problems are also assigned from Chapter 14.
Introduction to CE 436 Traffic Engineering, focusing on capacity and Level of Service (LOS) analysis for freeways.
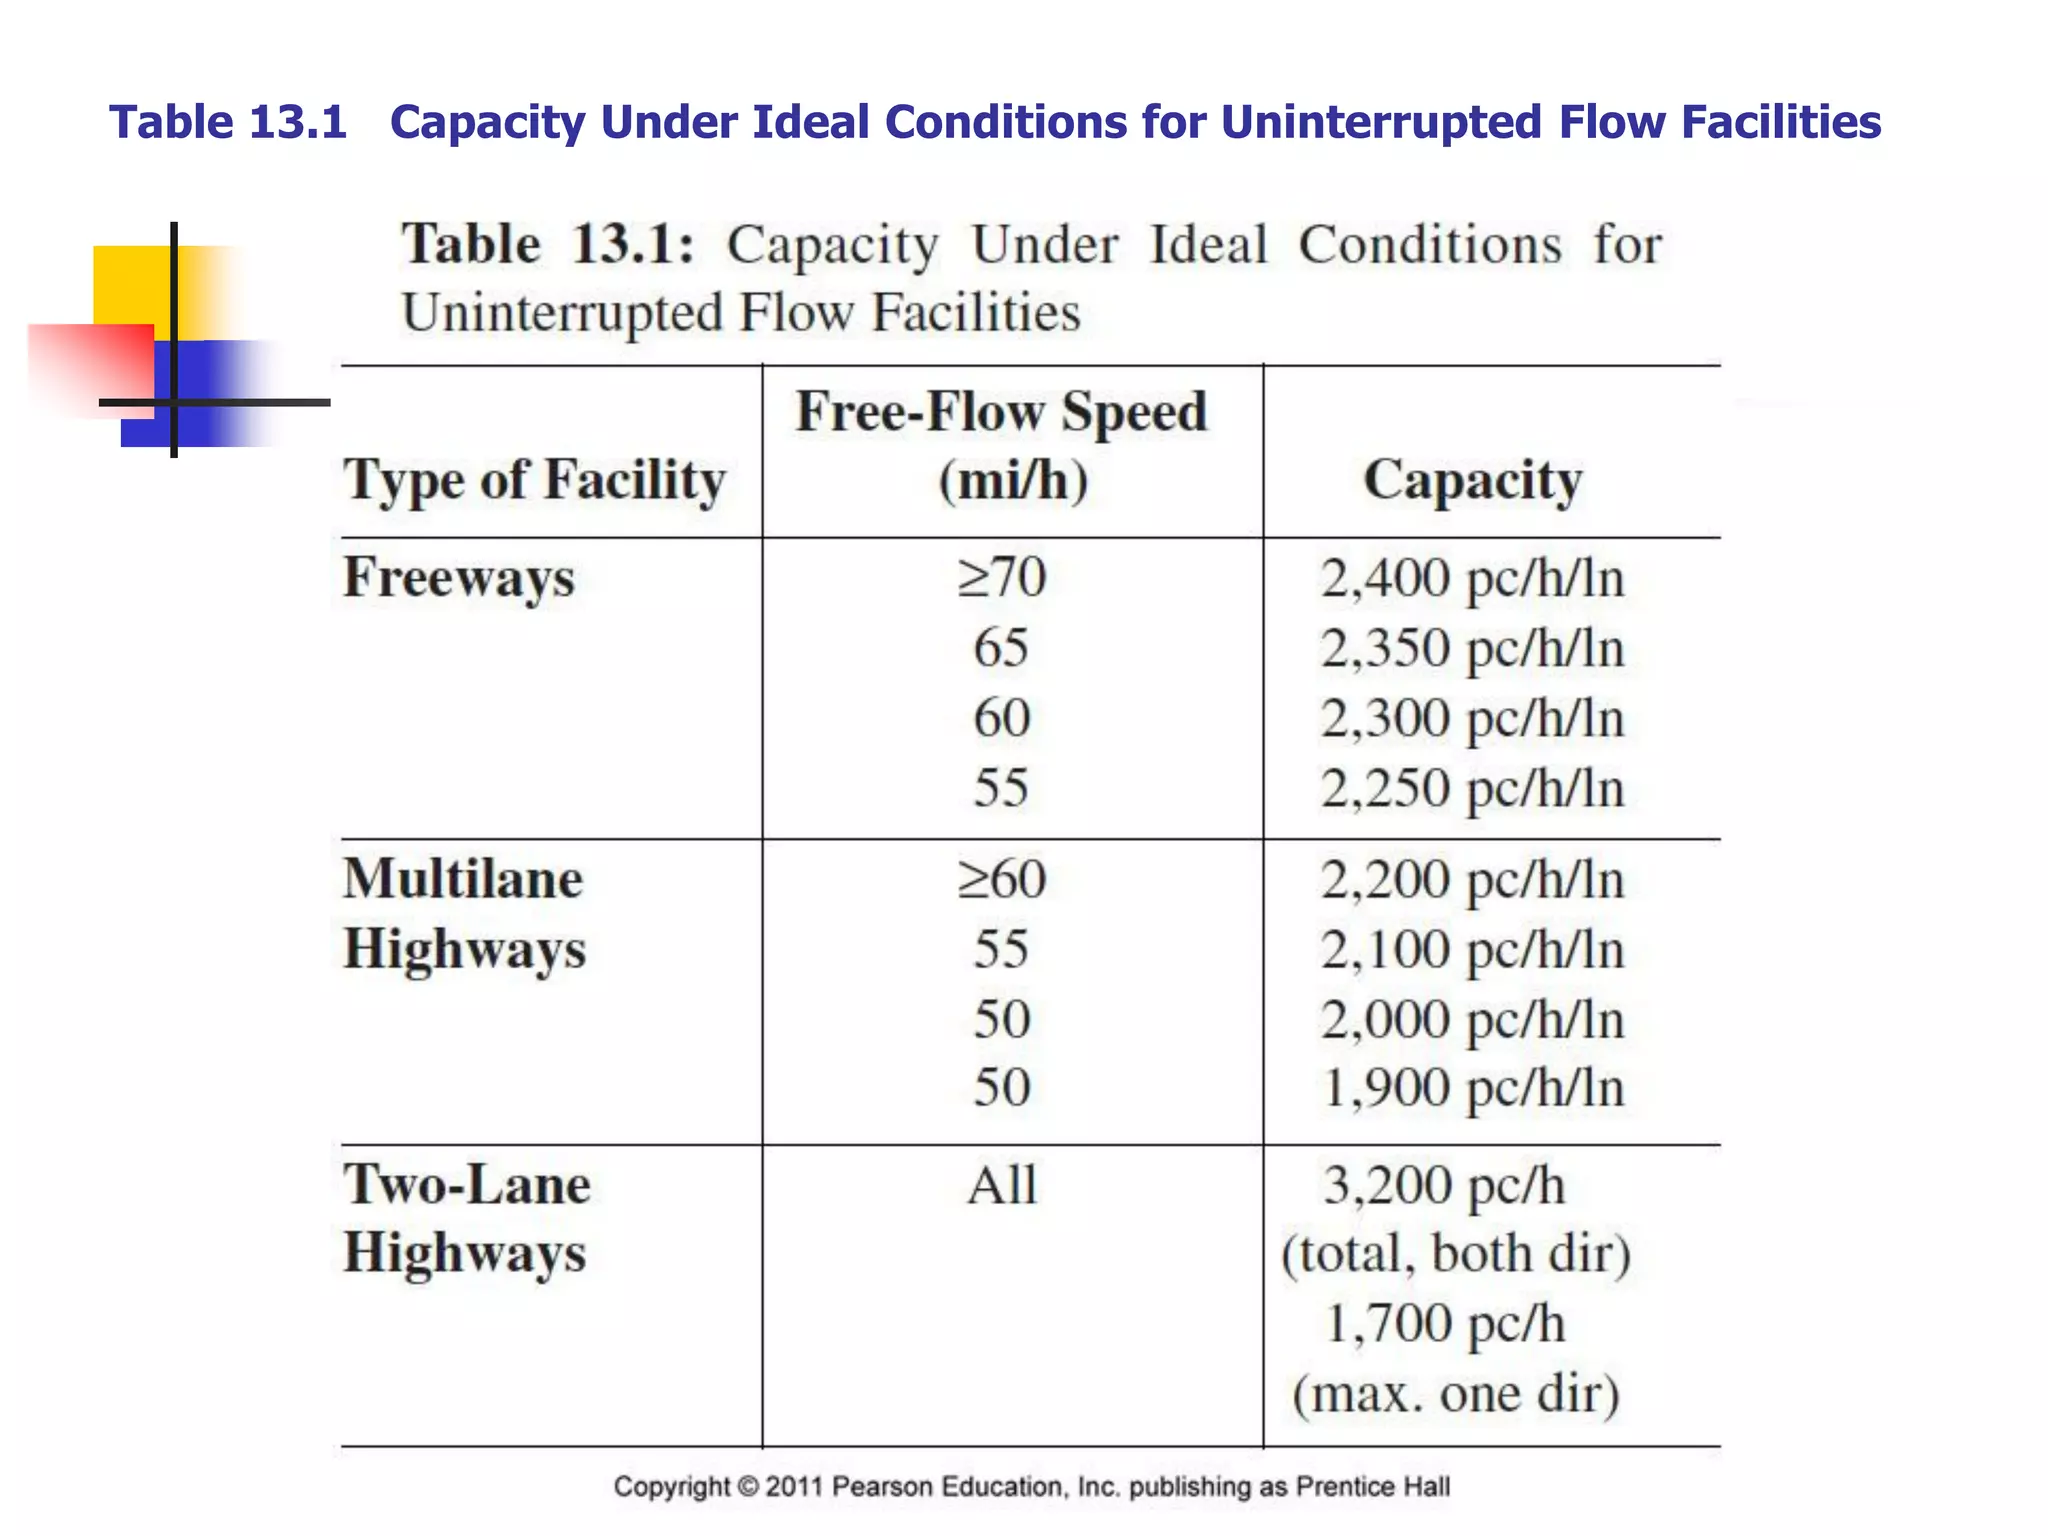
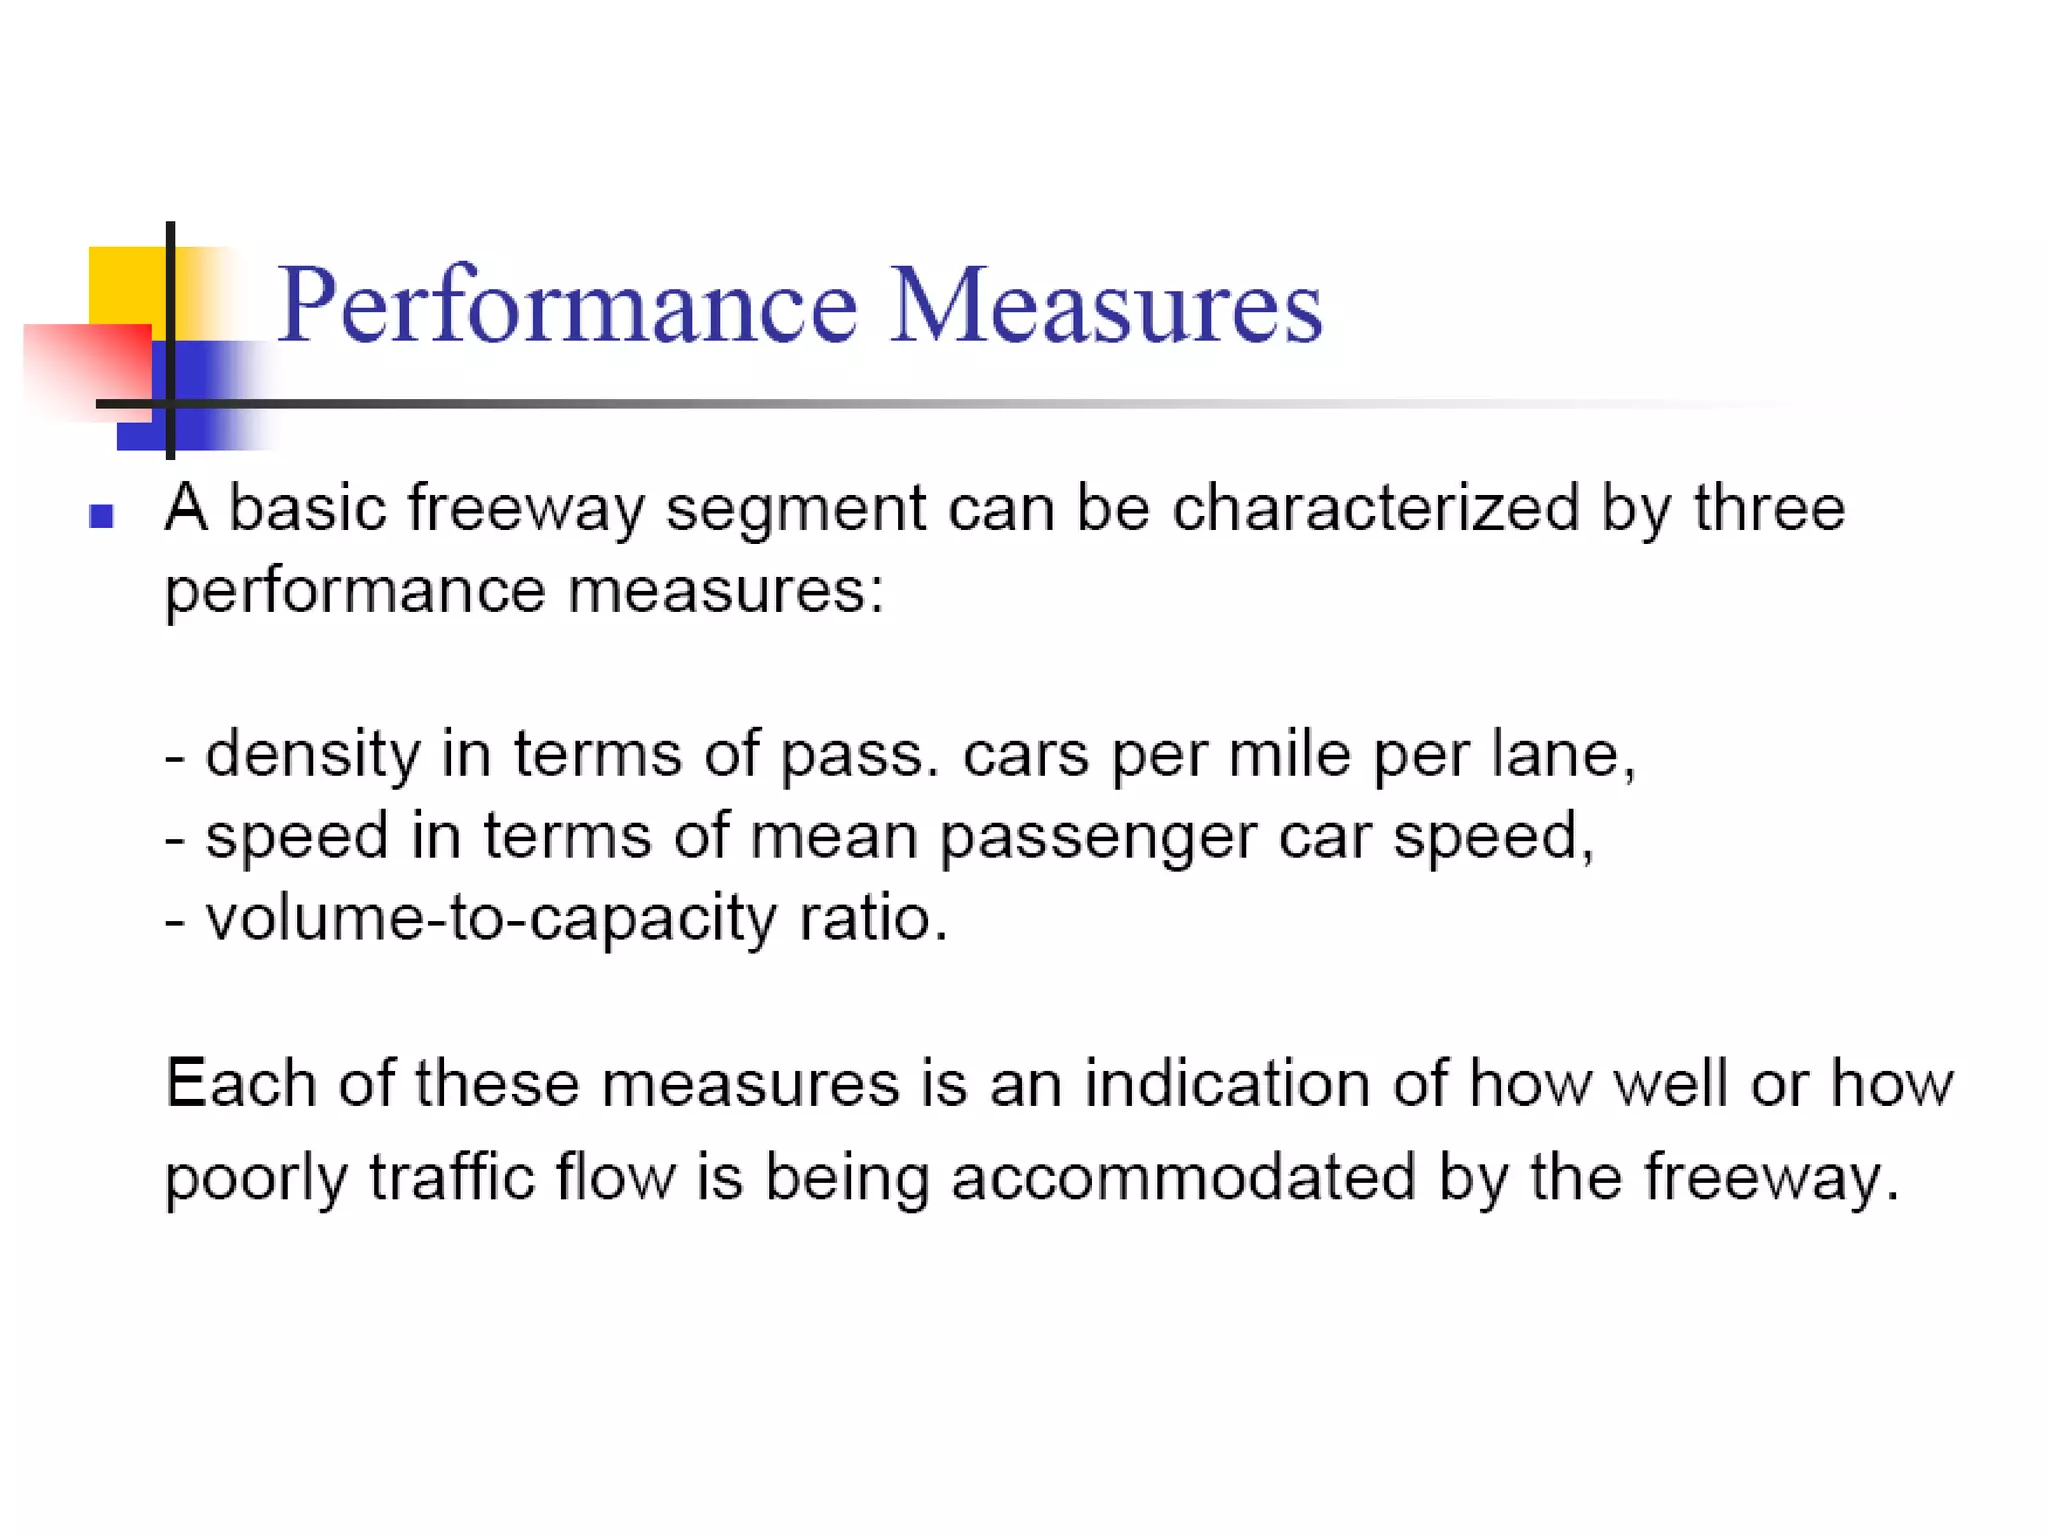
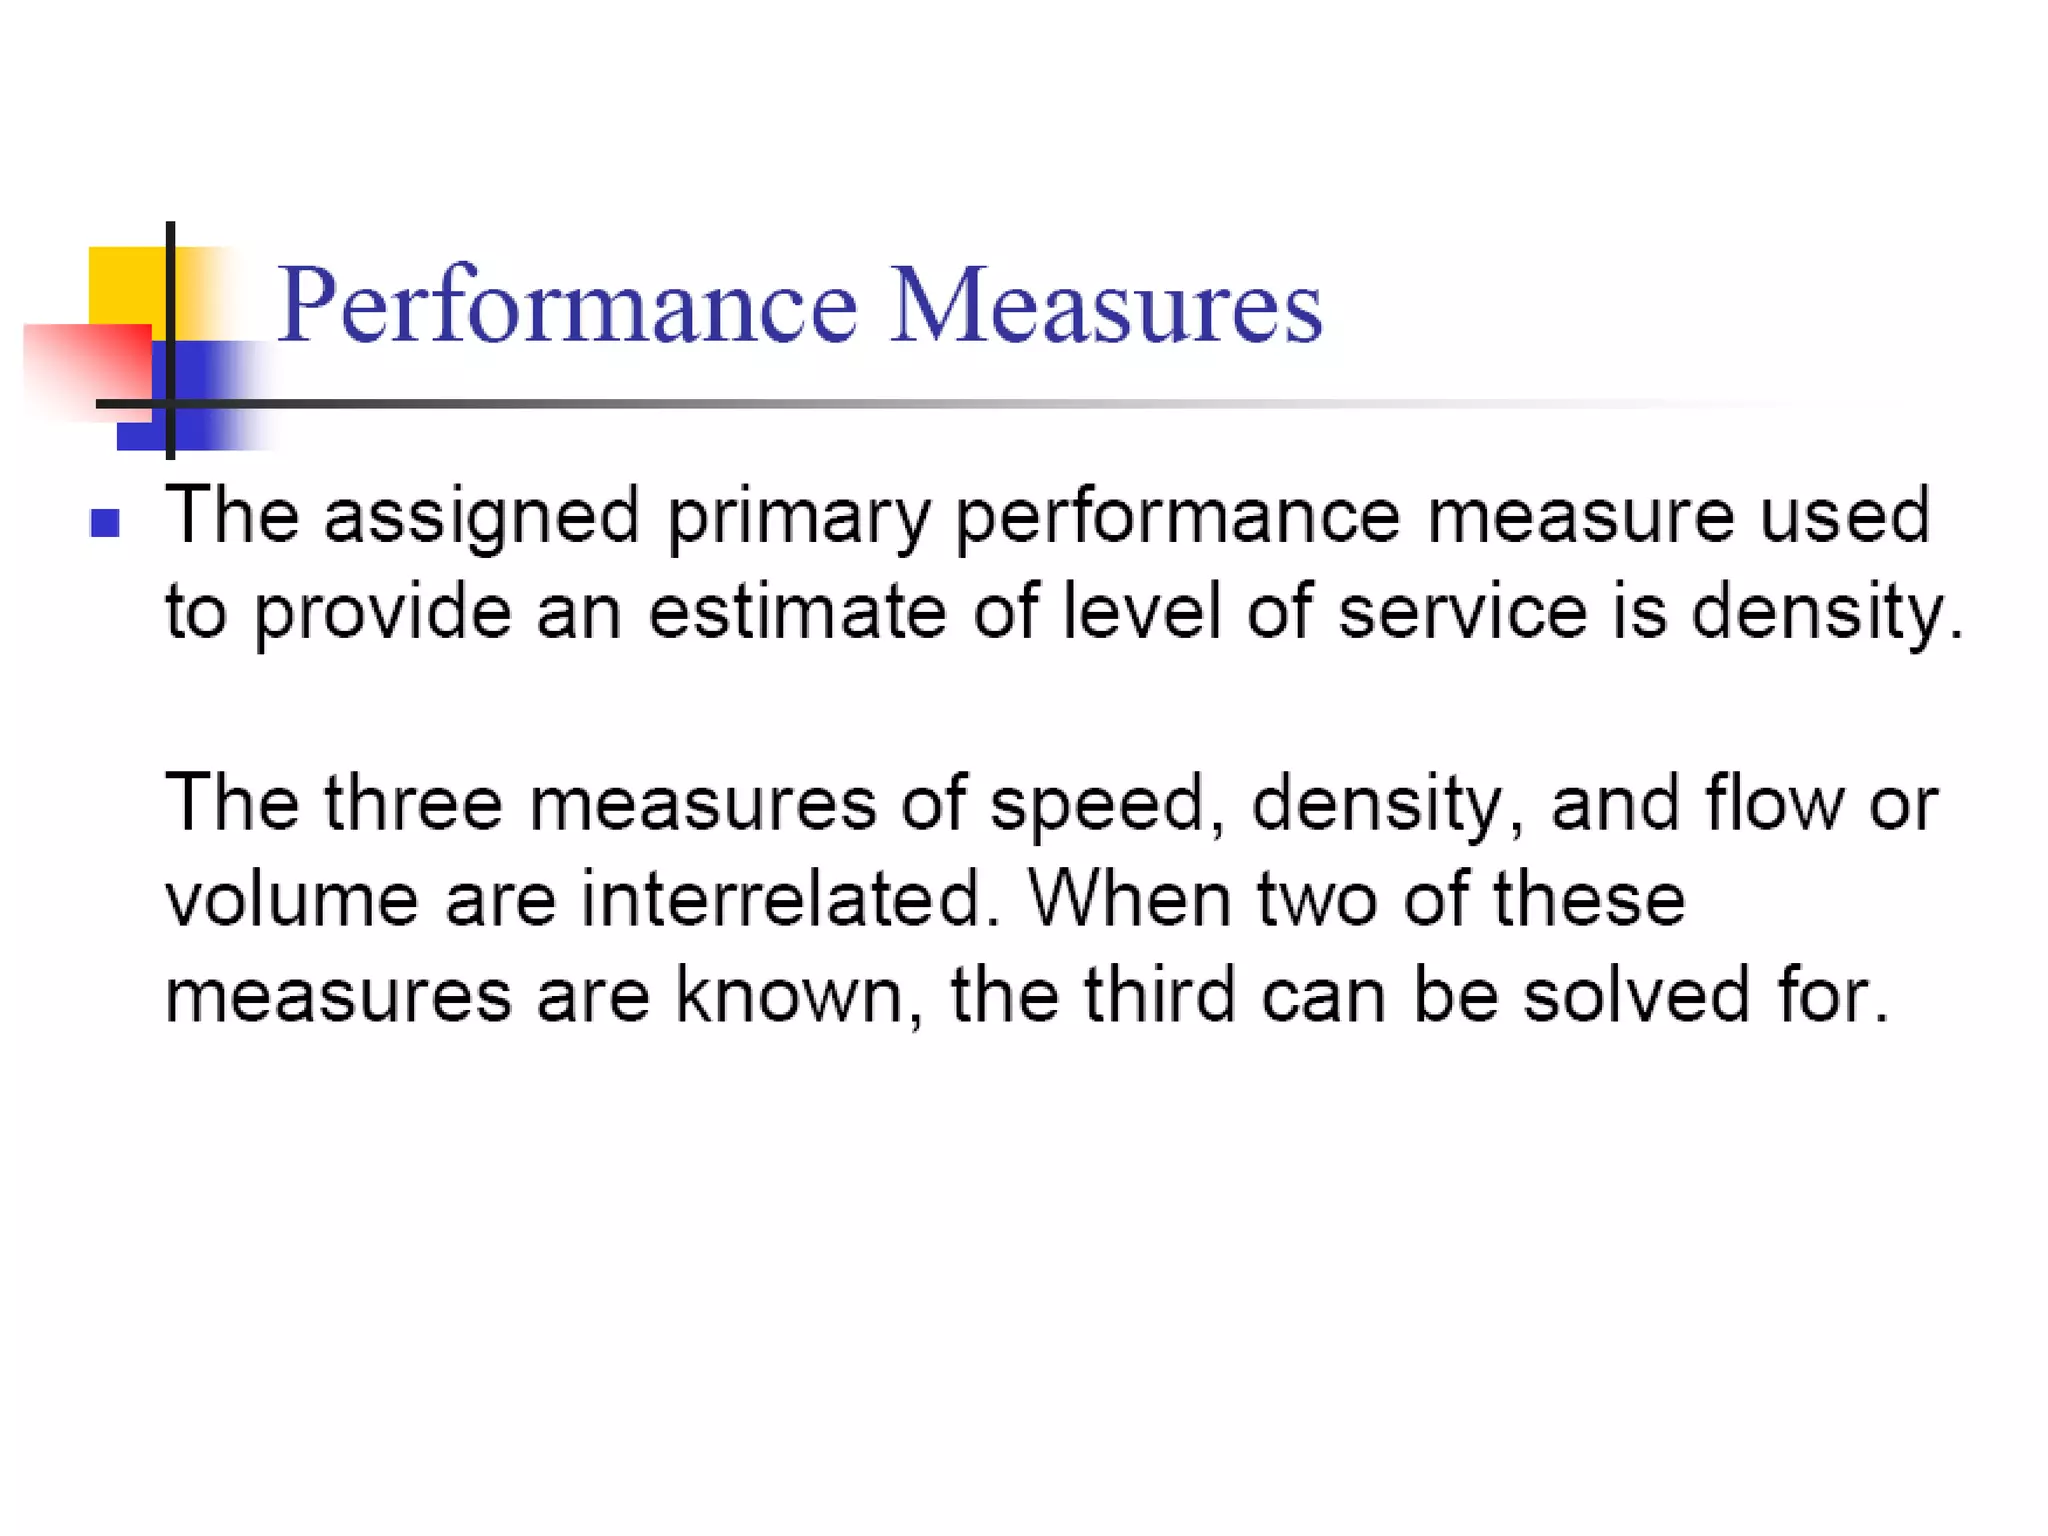
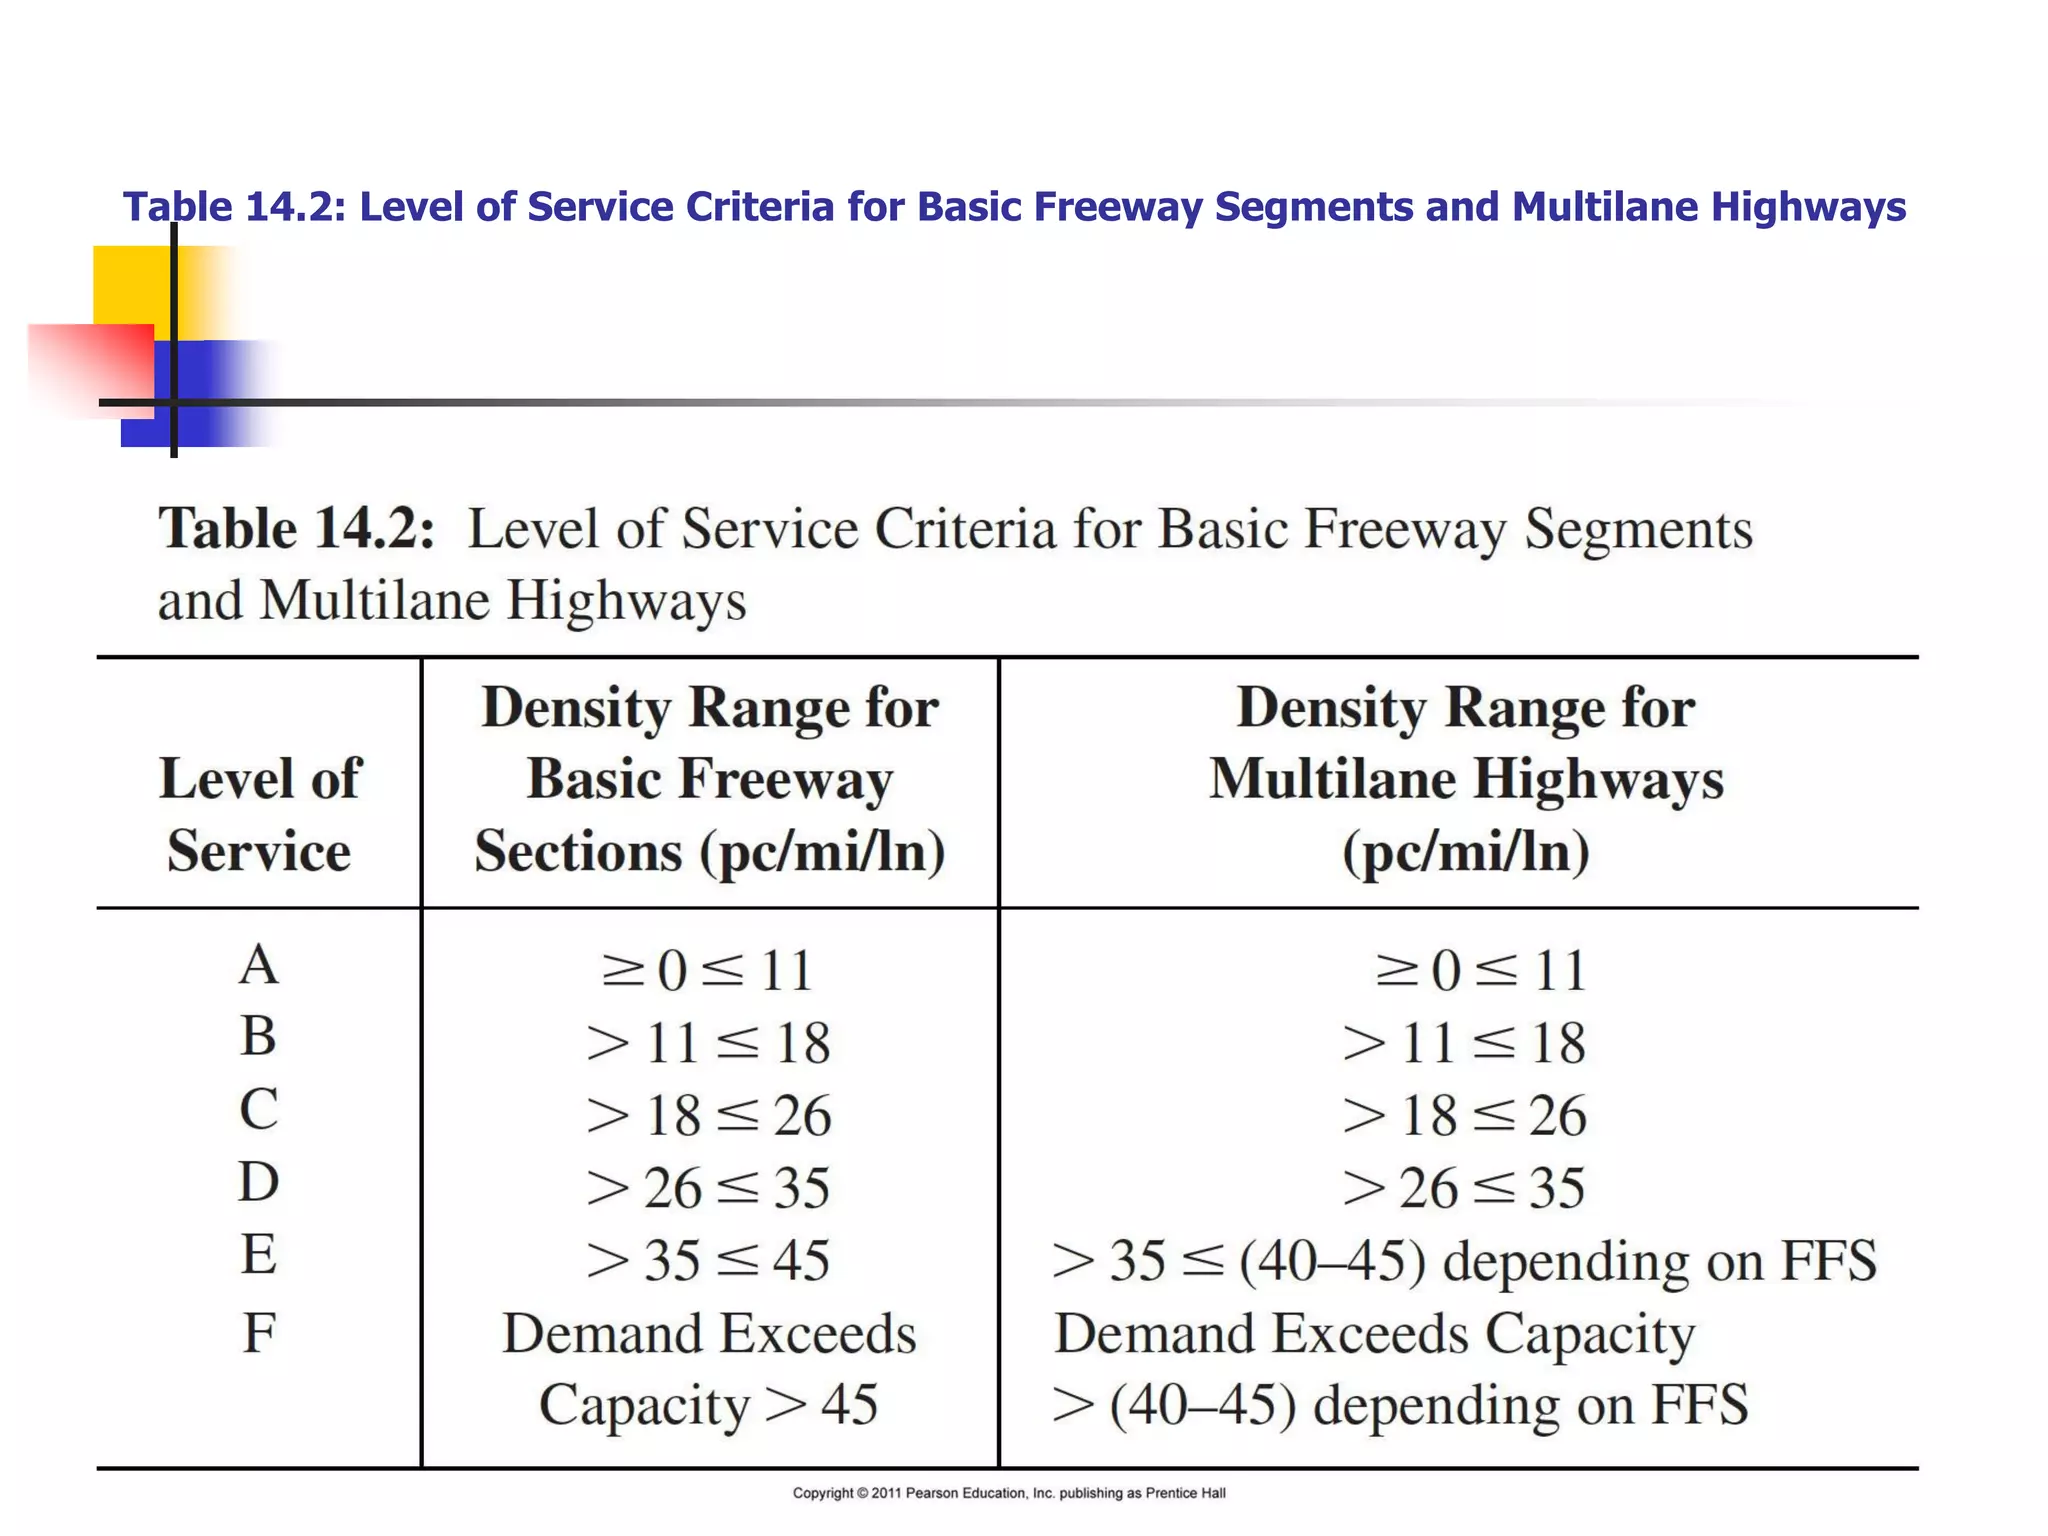
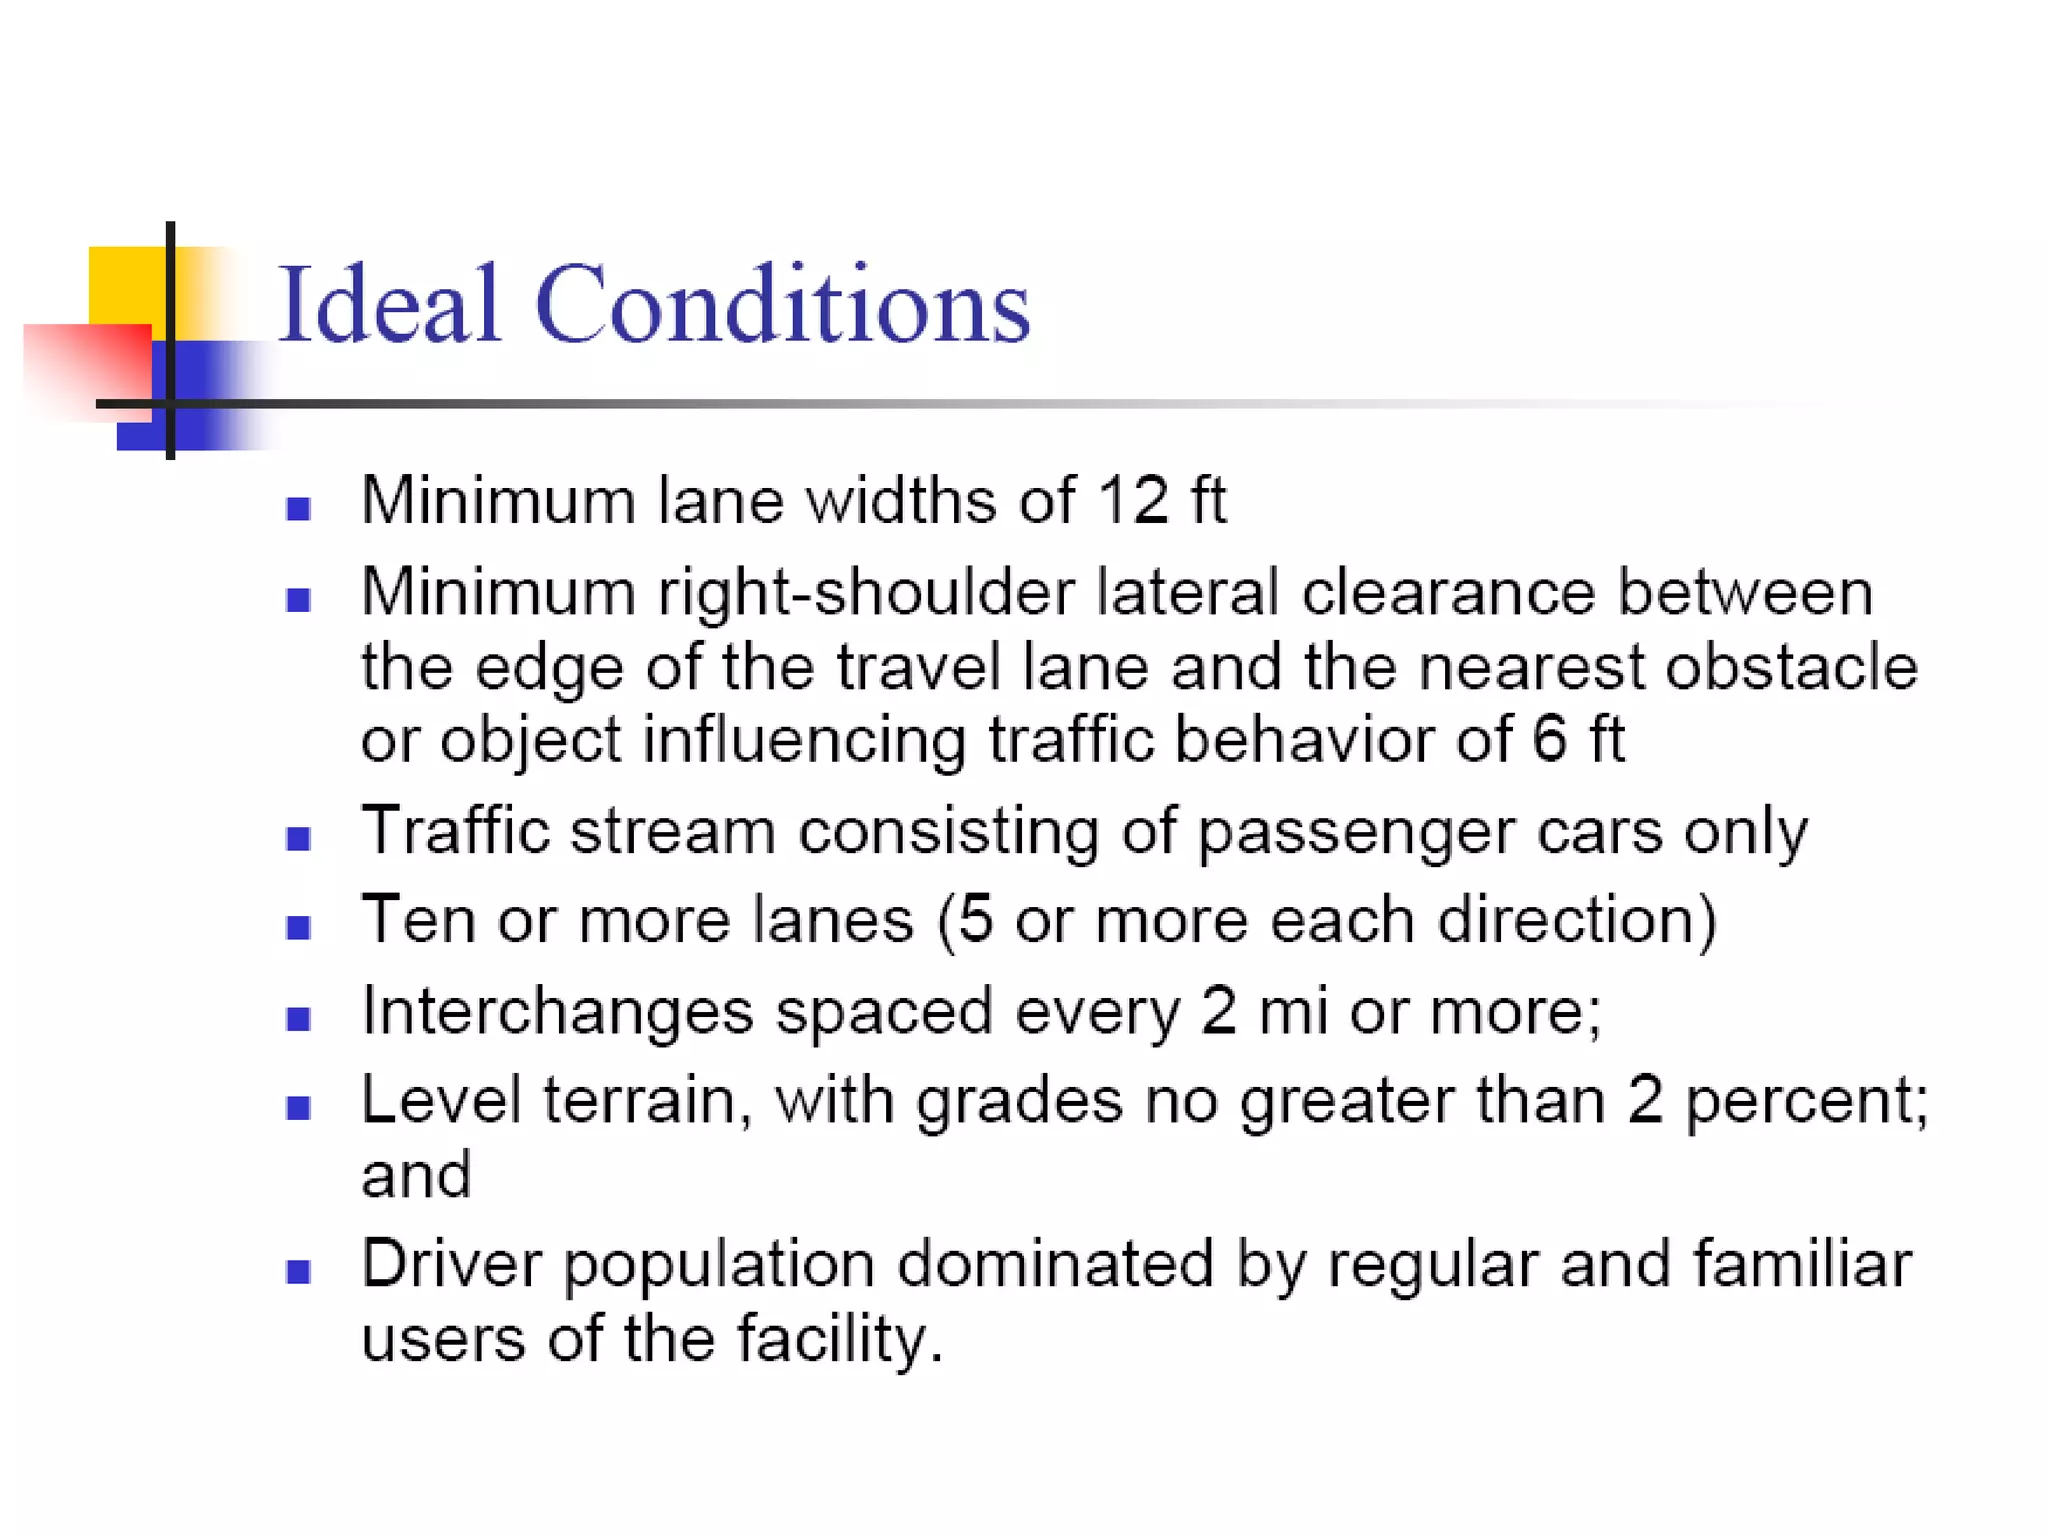
Presentation of capacity tables and measures of effectiveness in ideal conditions for uninterrupted flow.
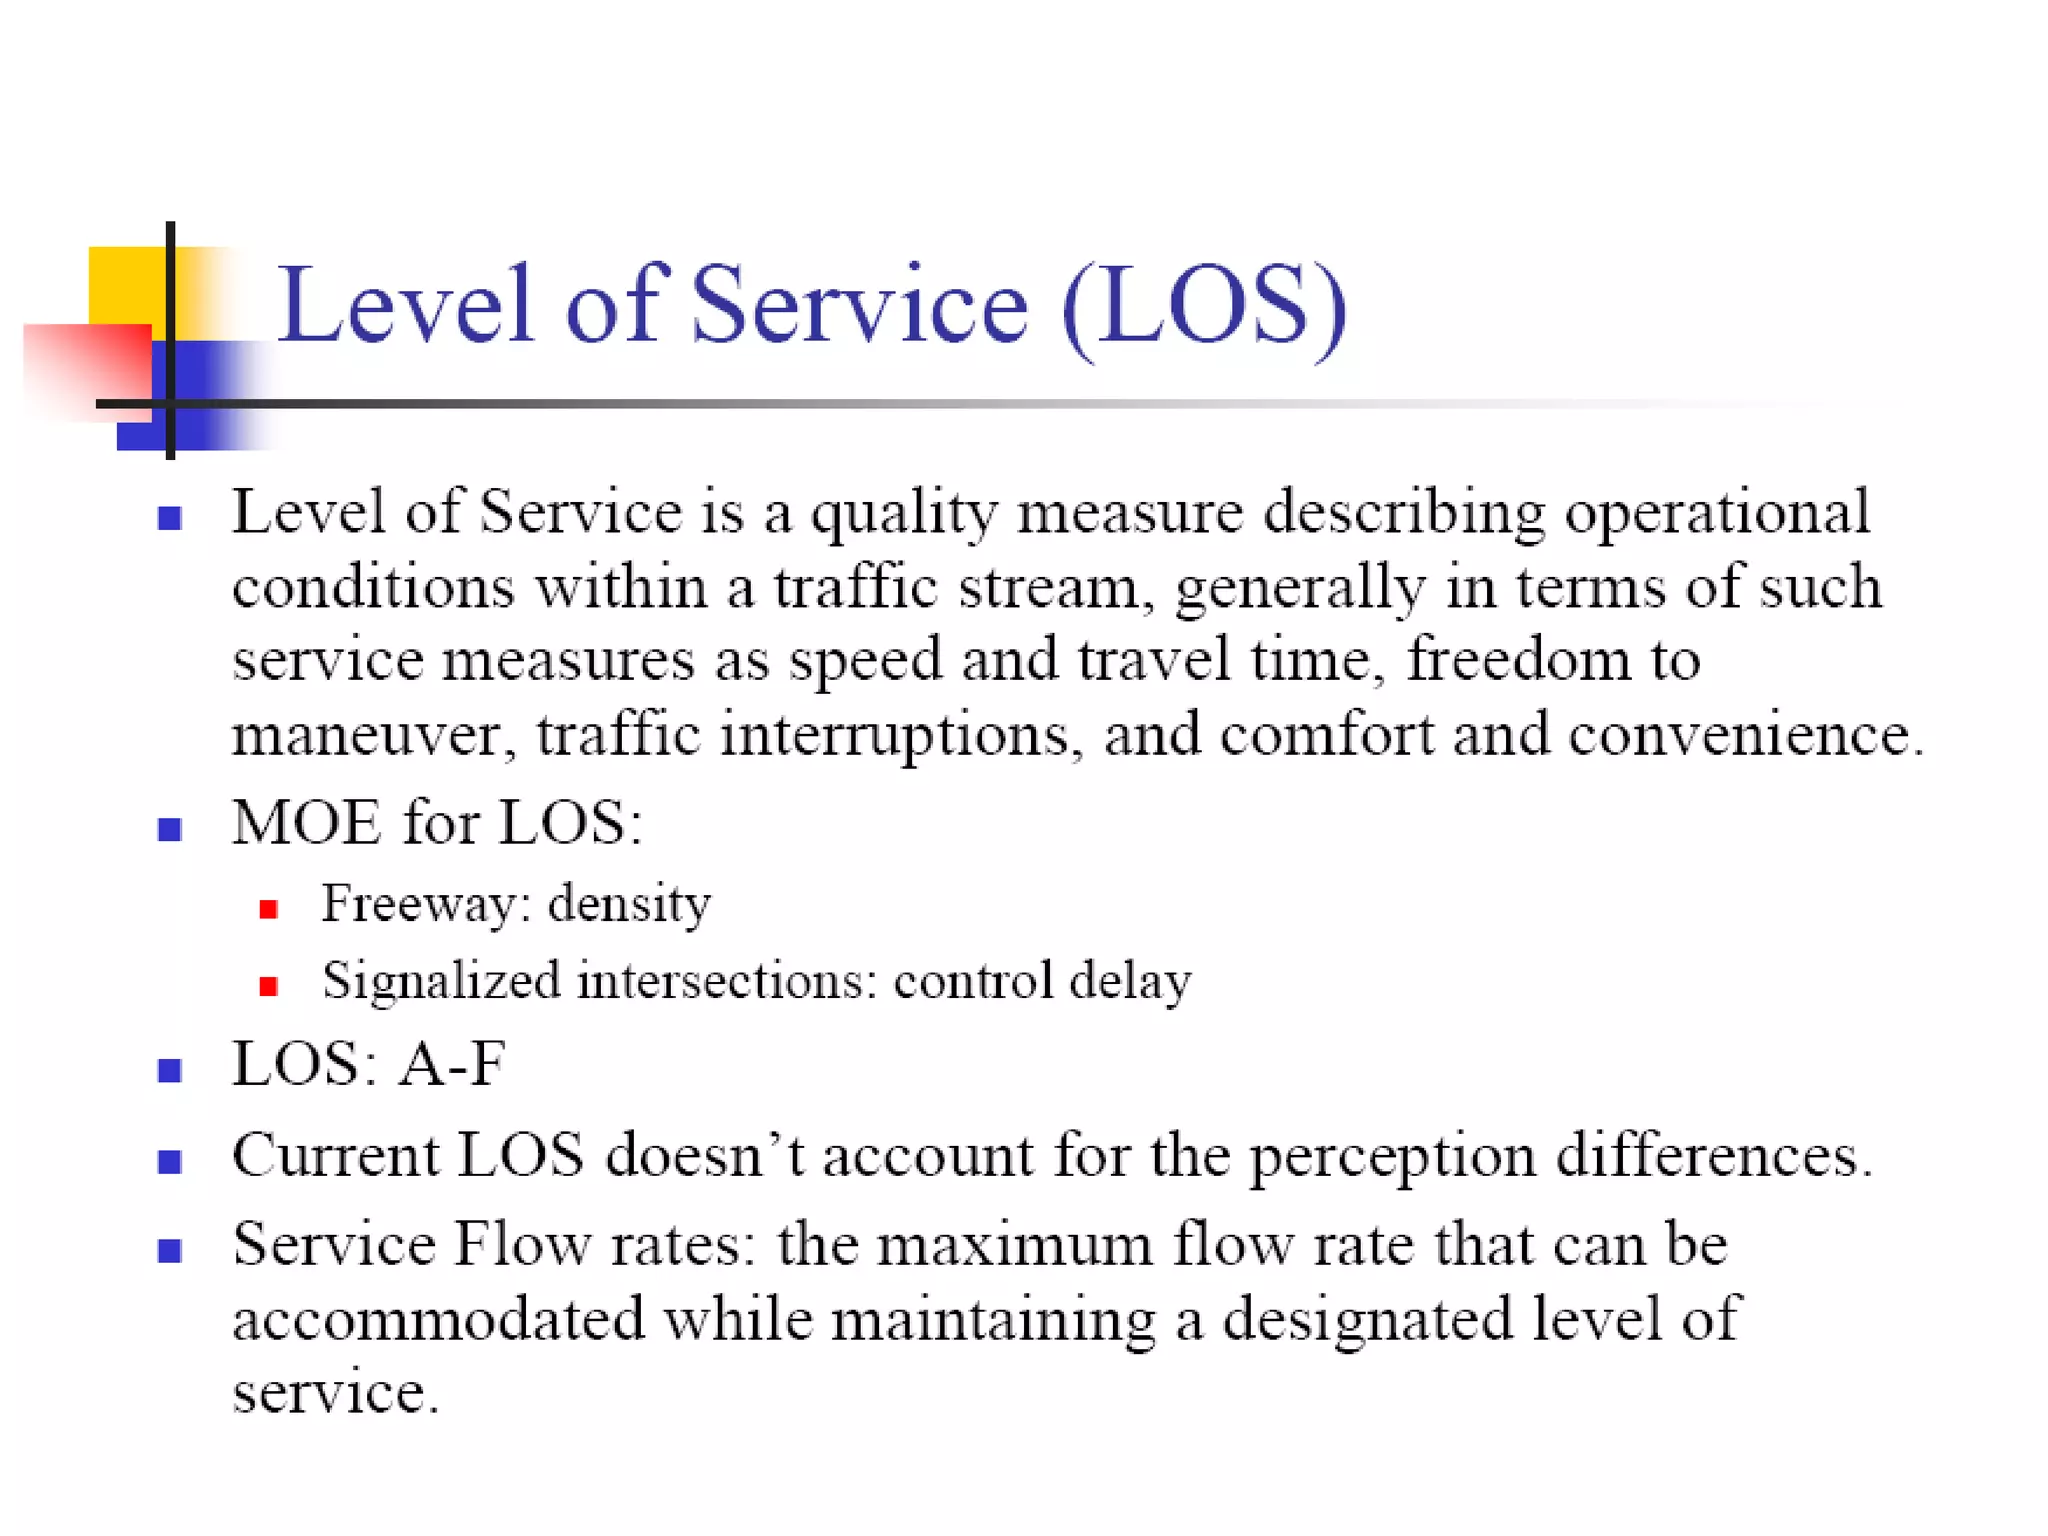
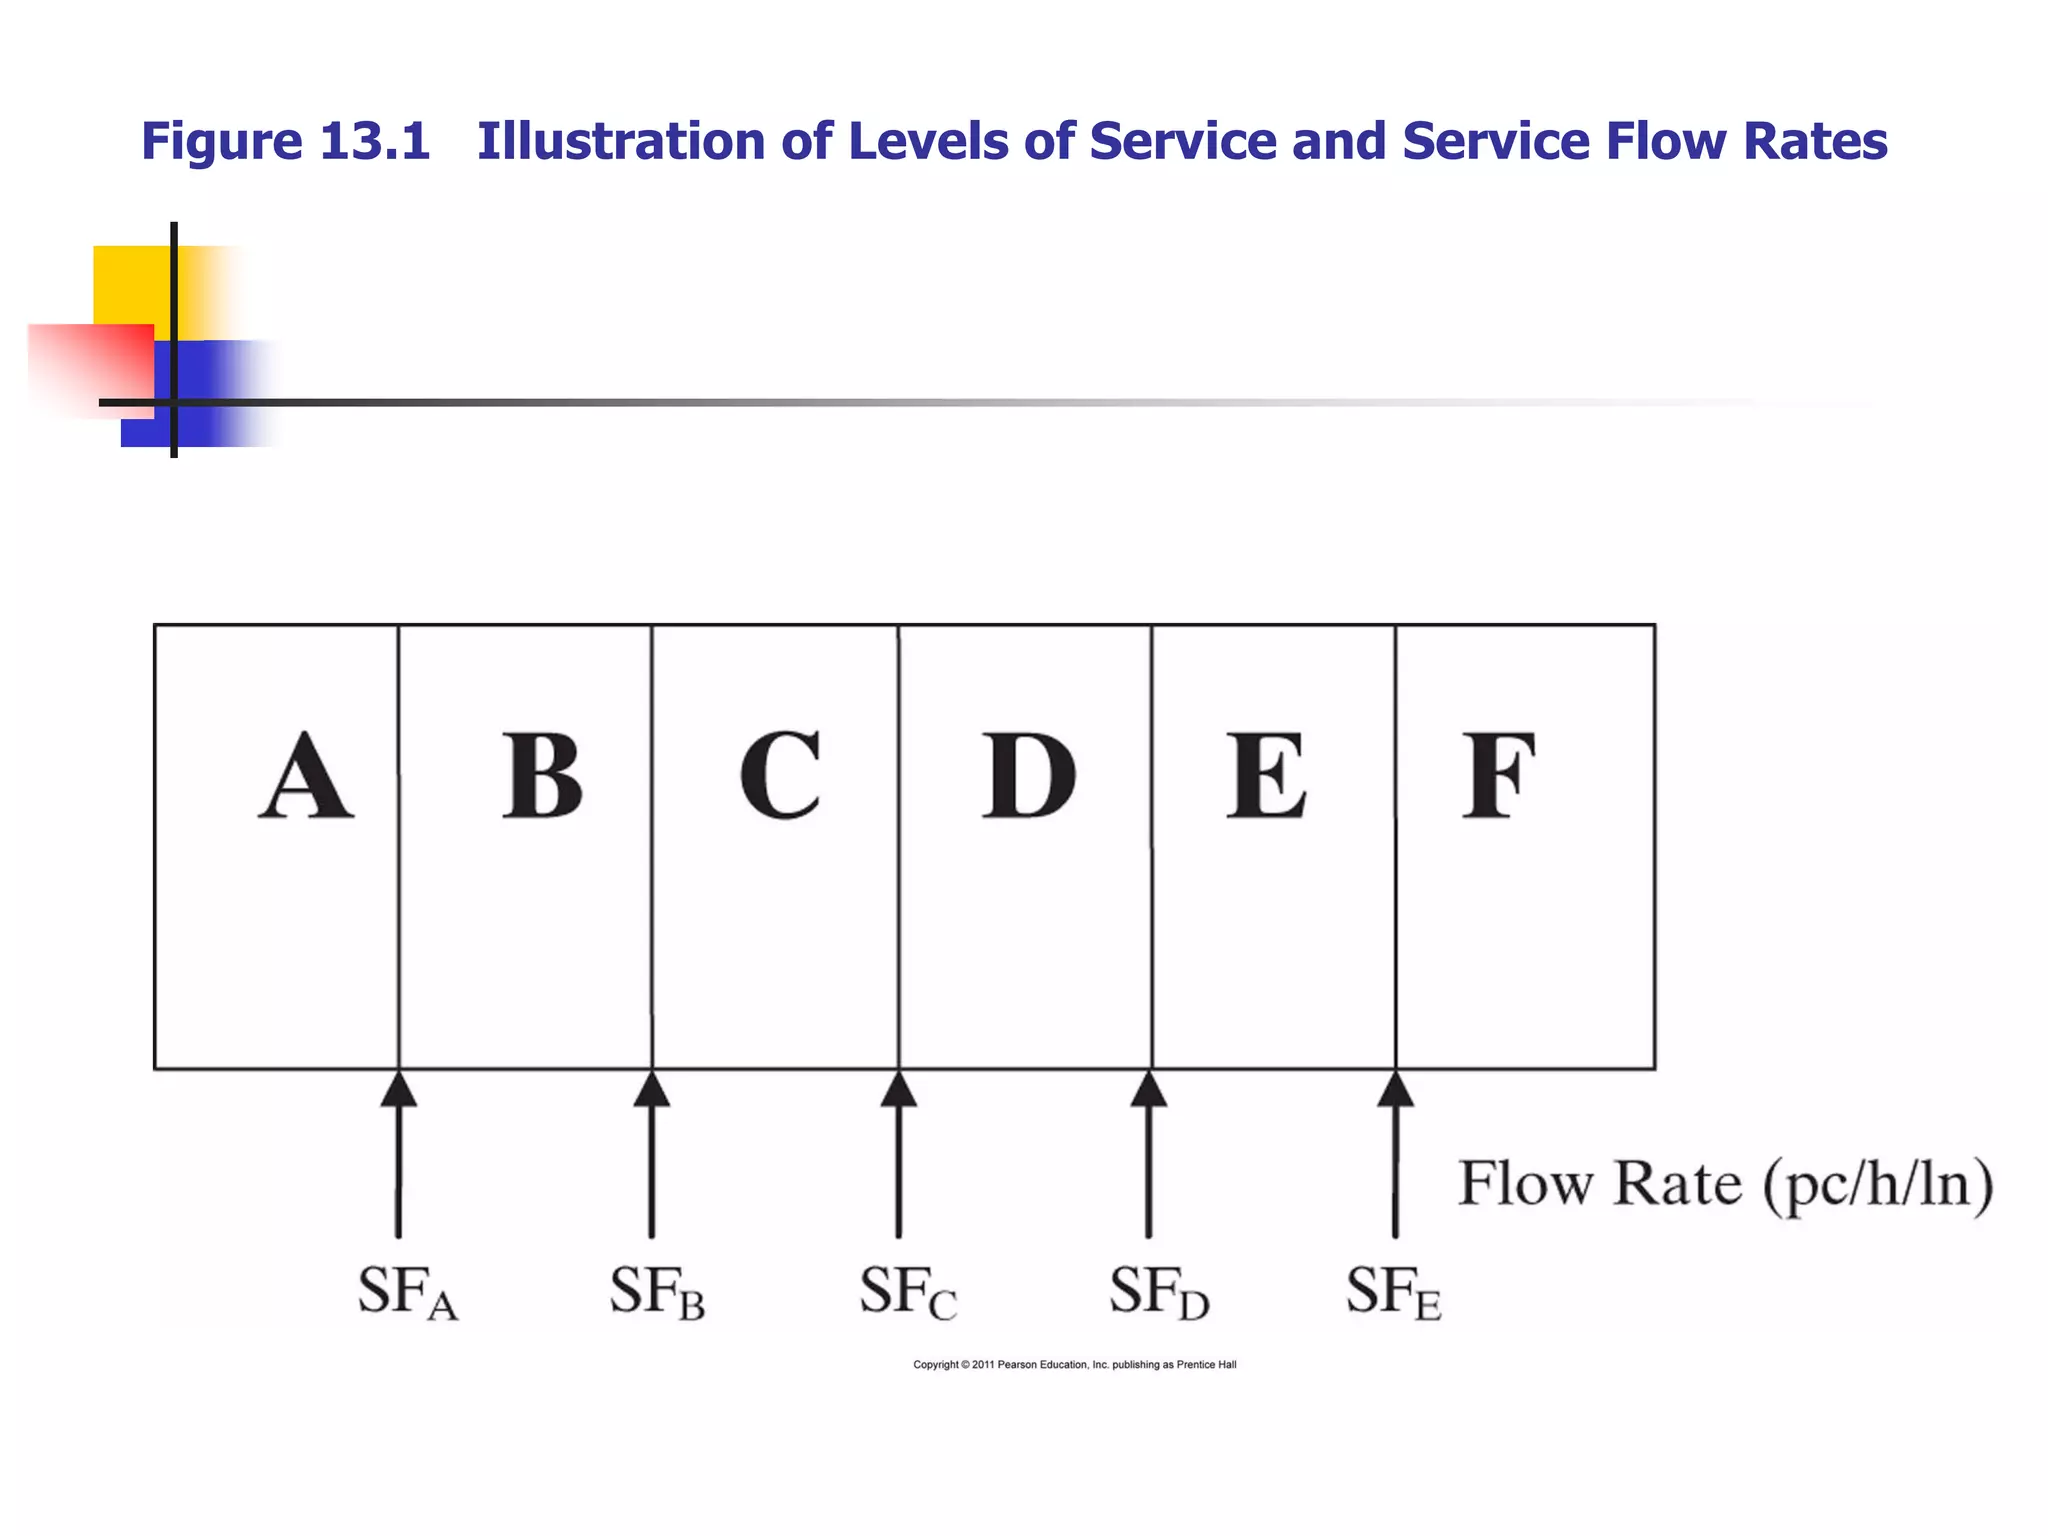
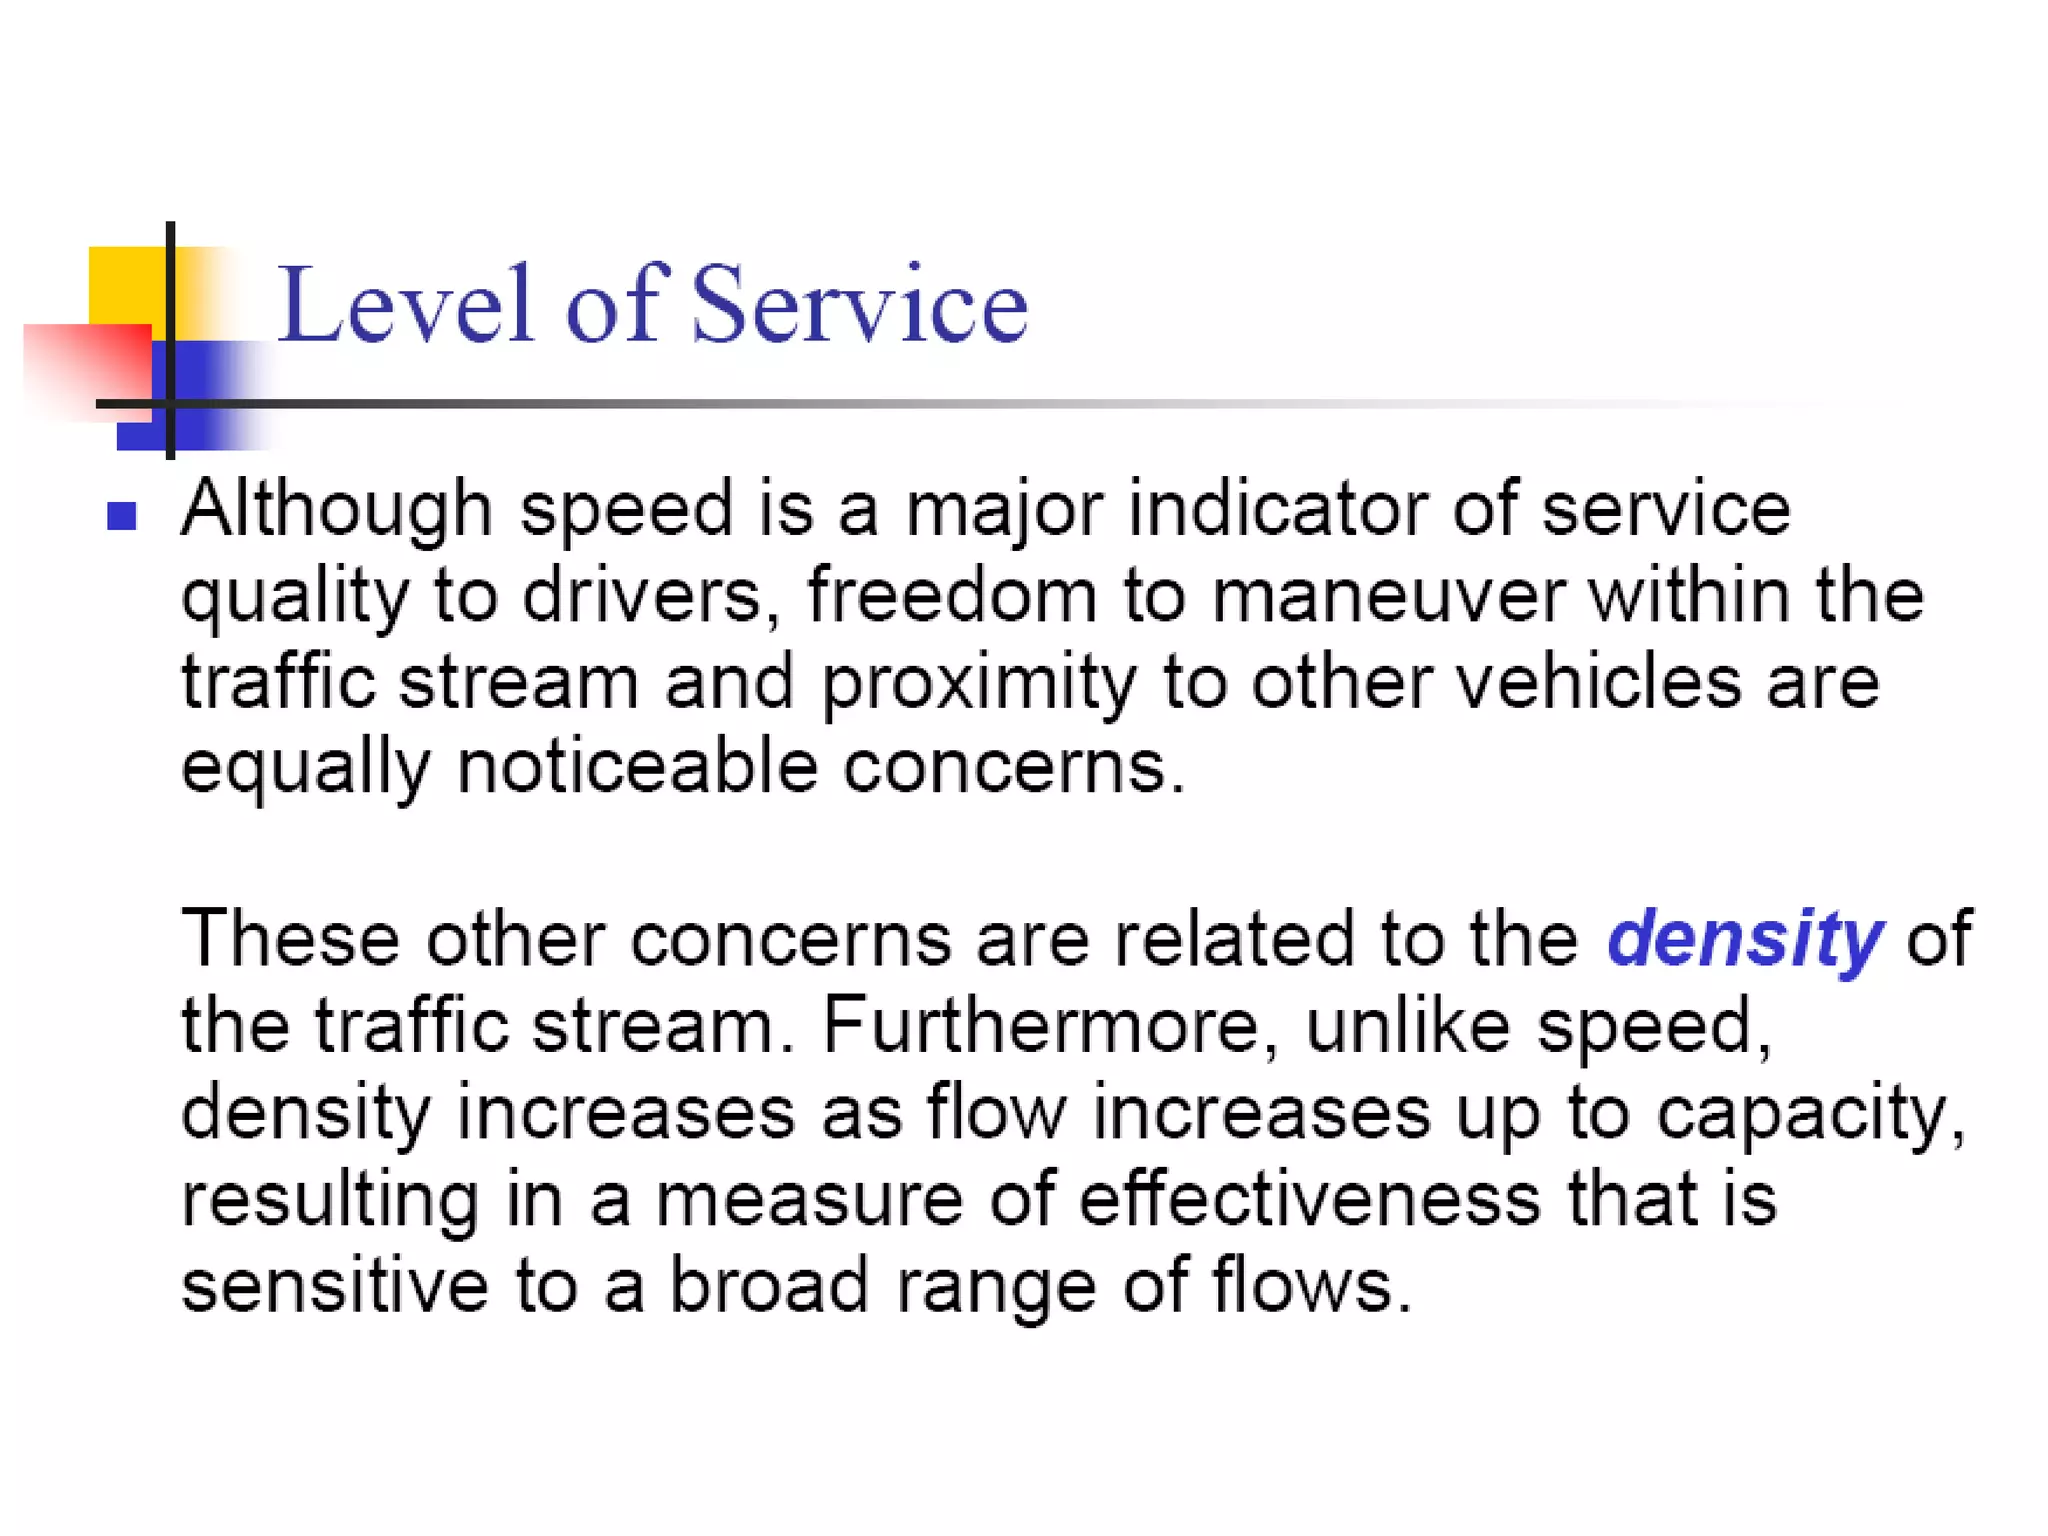
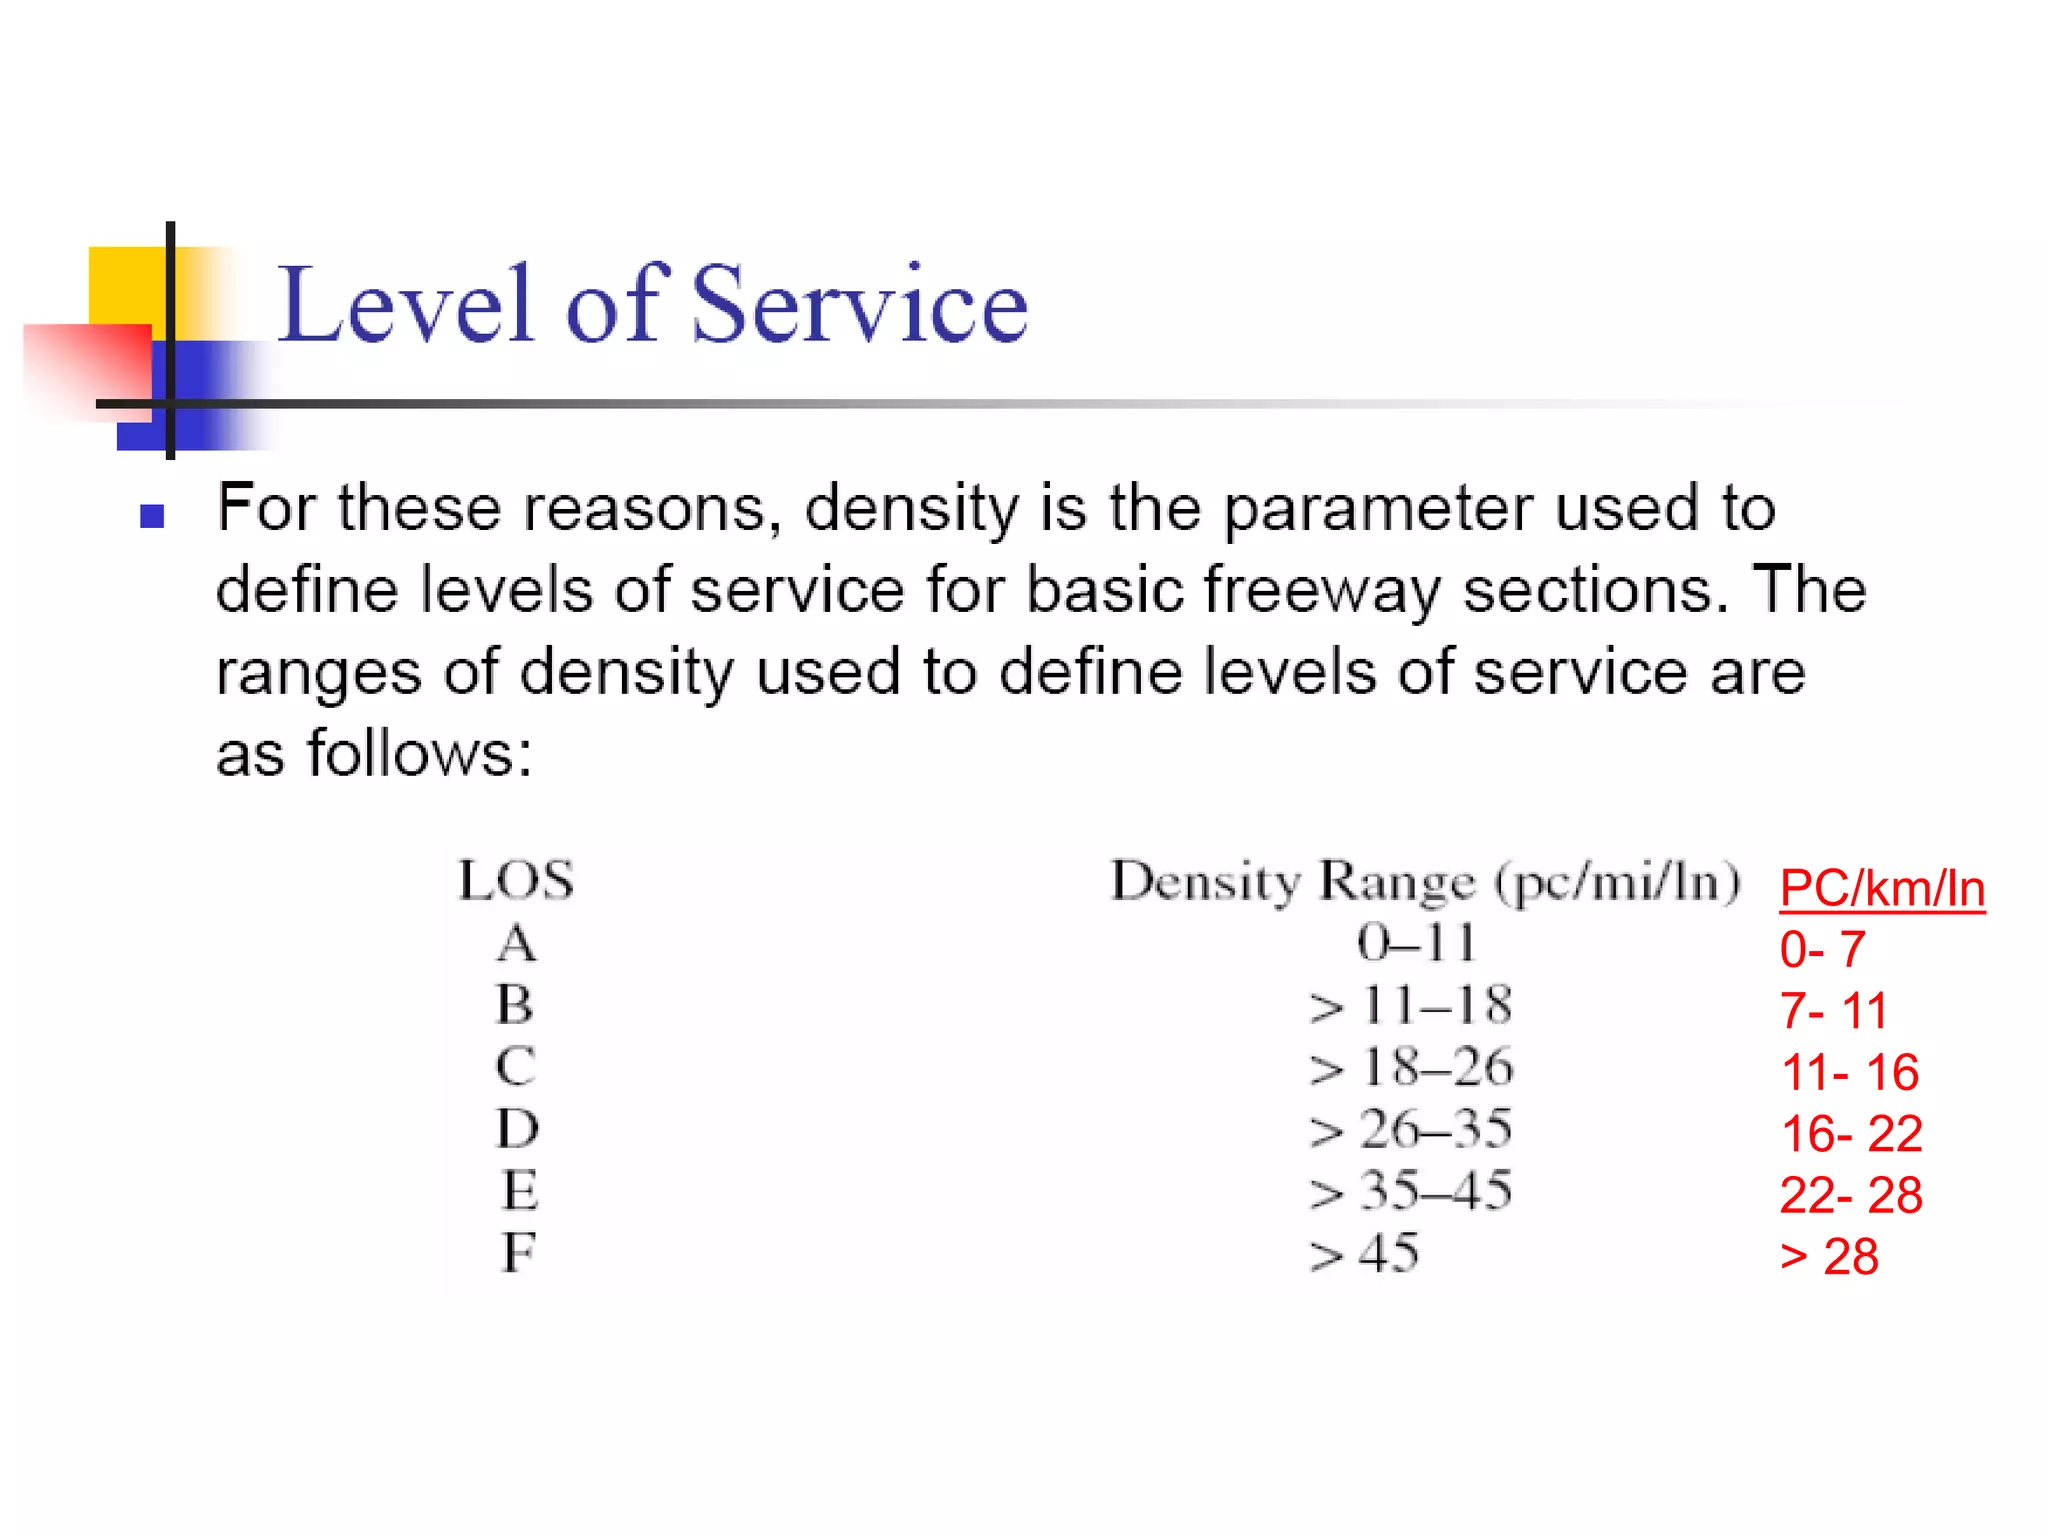
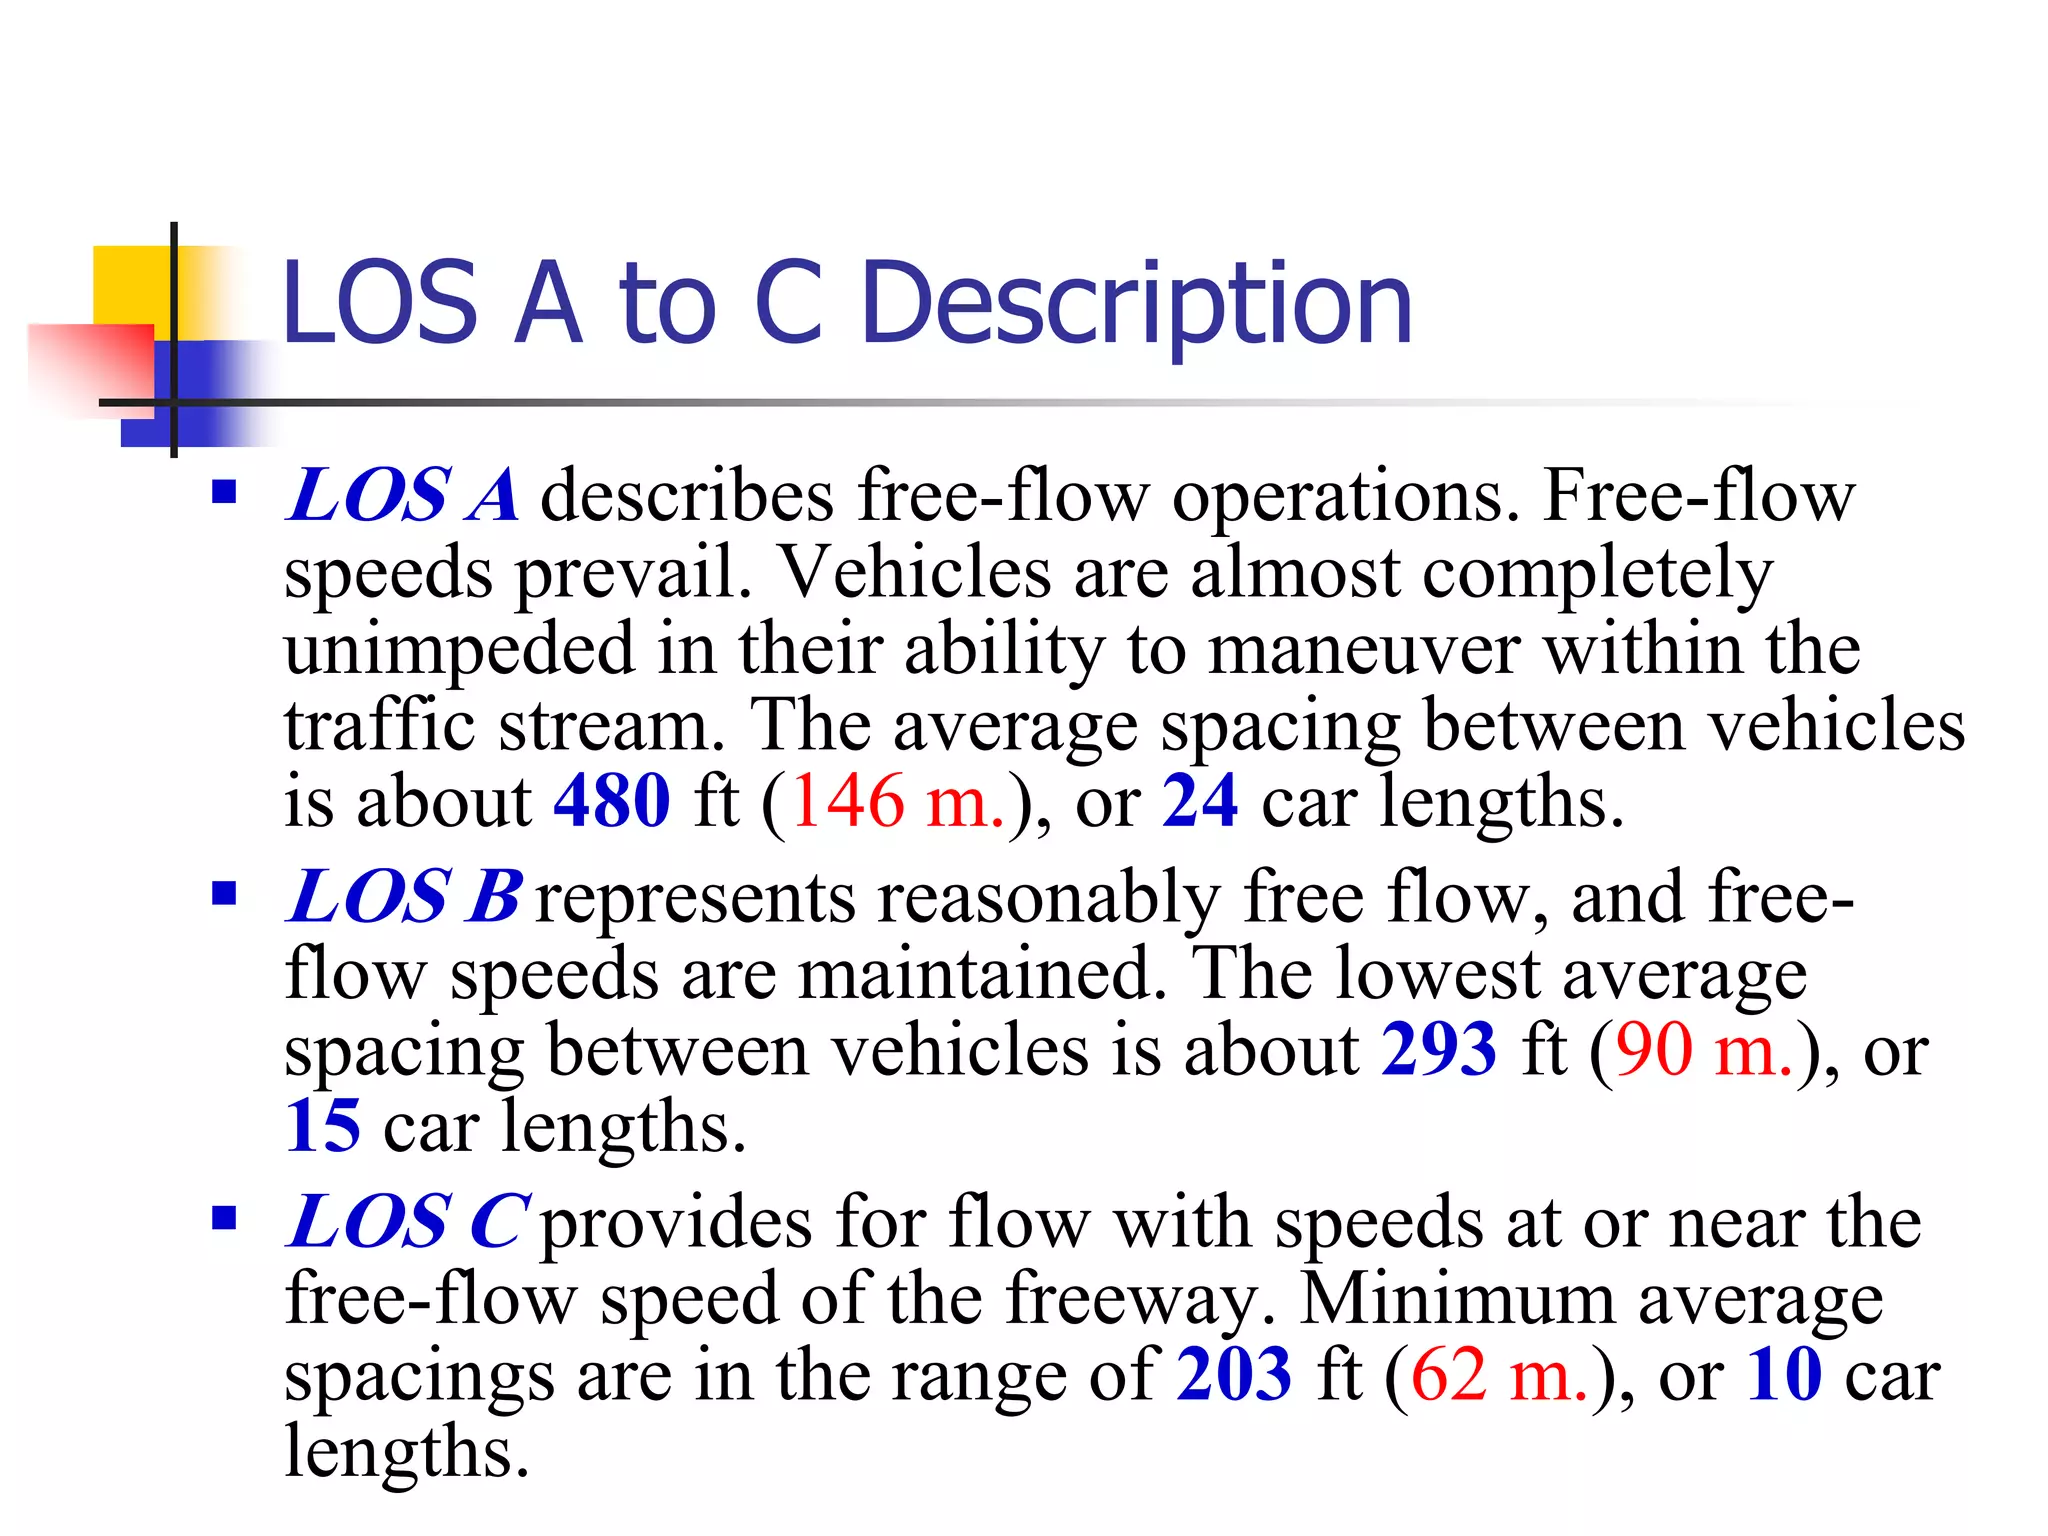
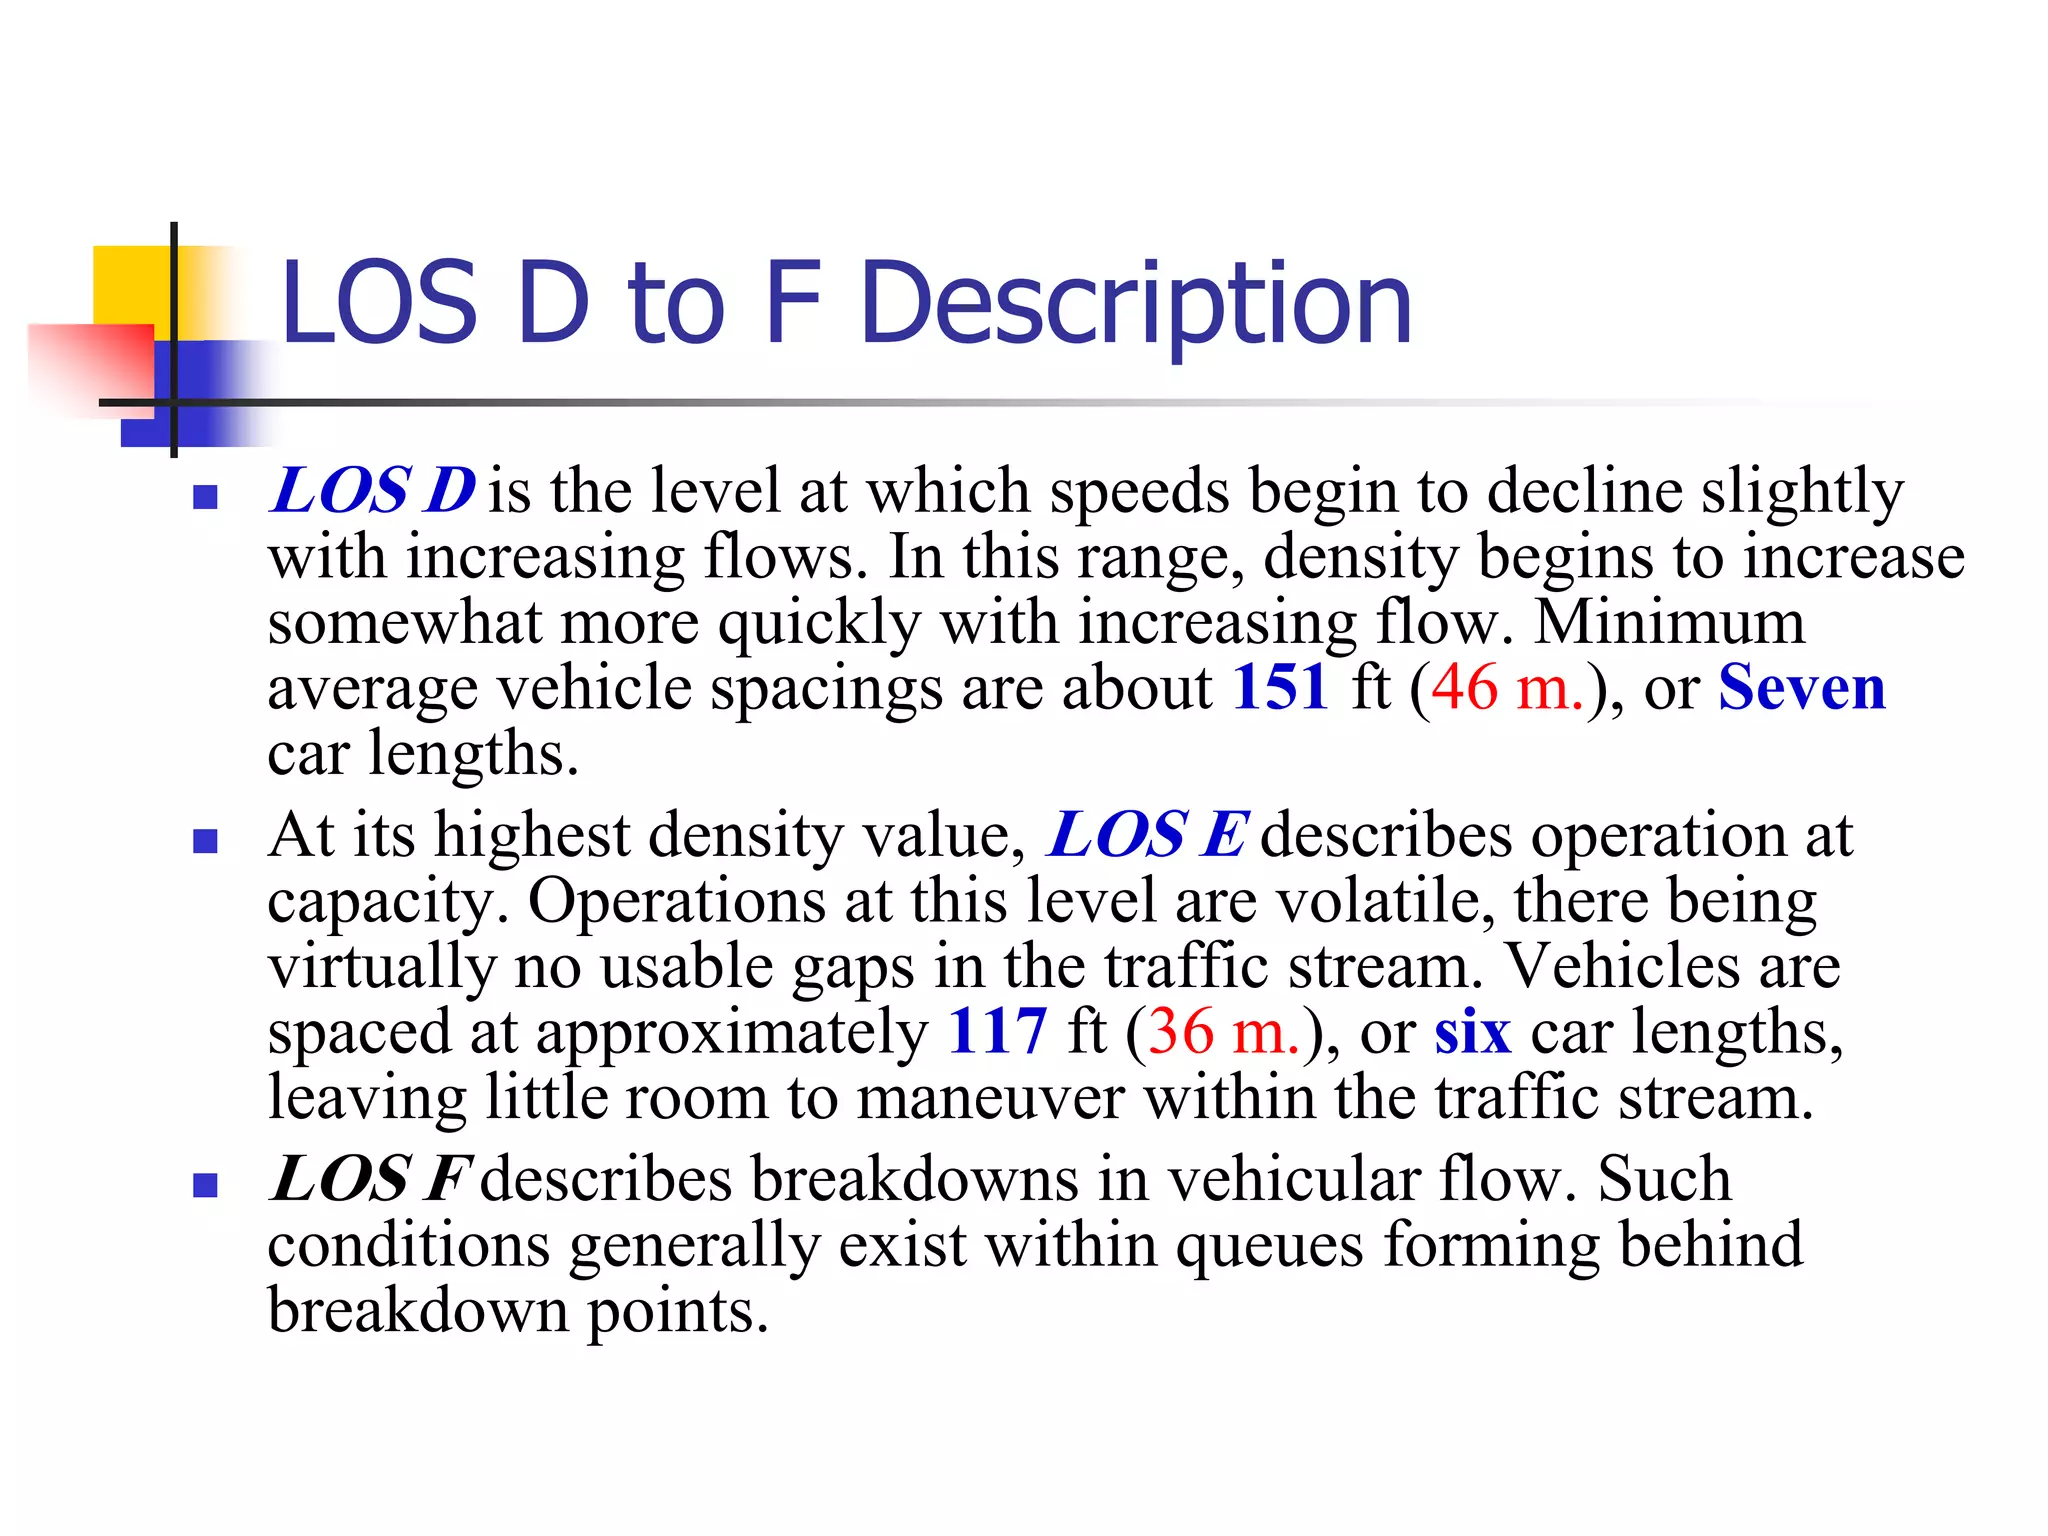
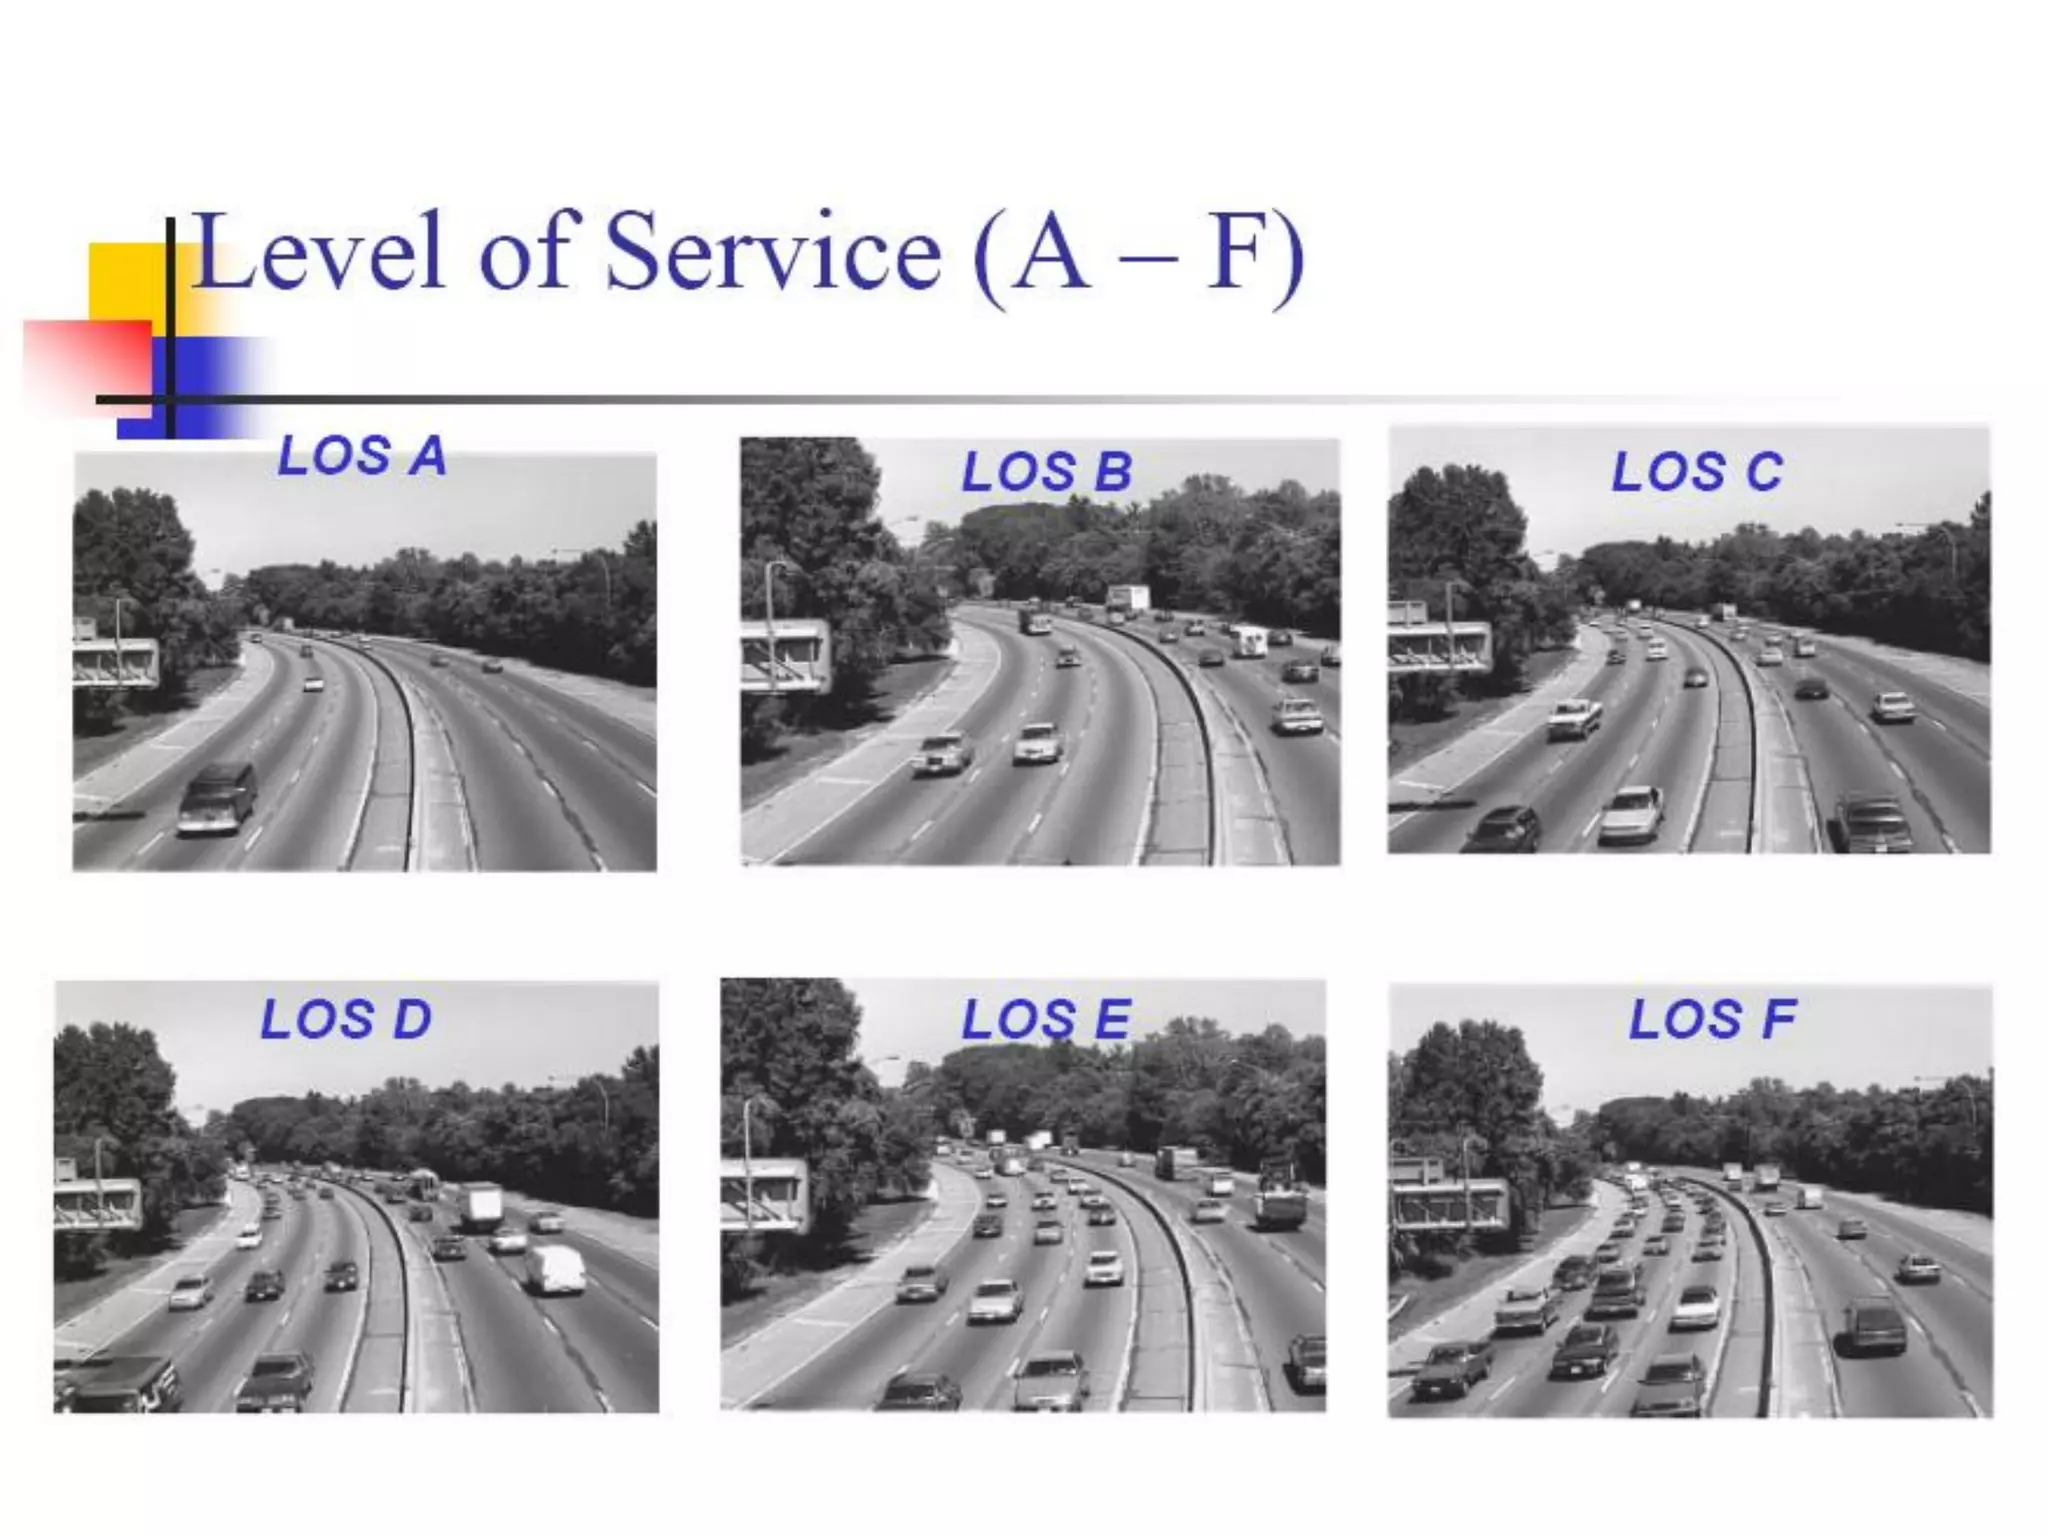
Detailed descriptions of LOS A to F, including flow operations and vehicle spacings.
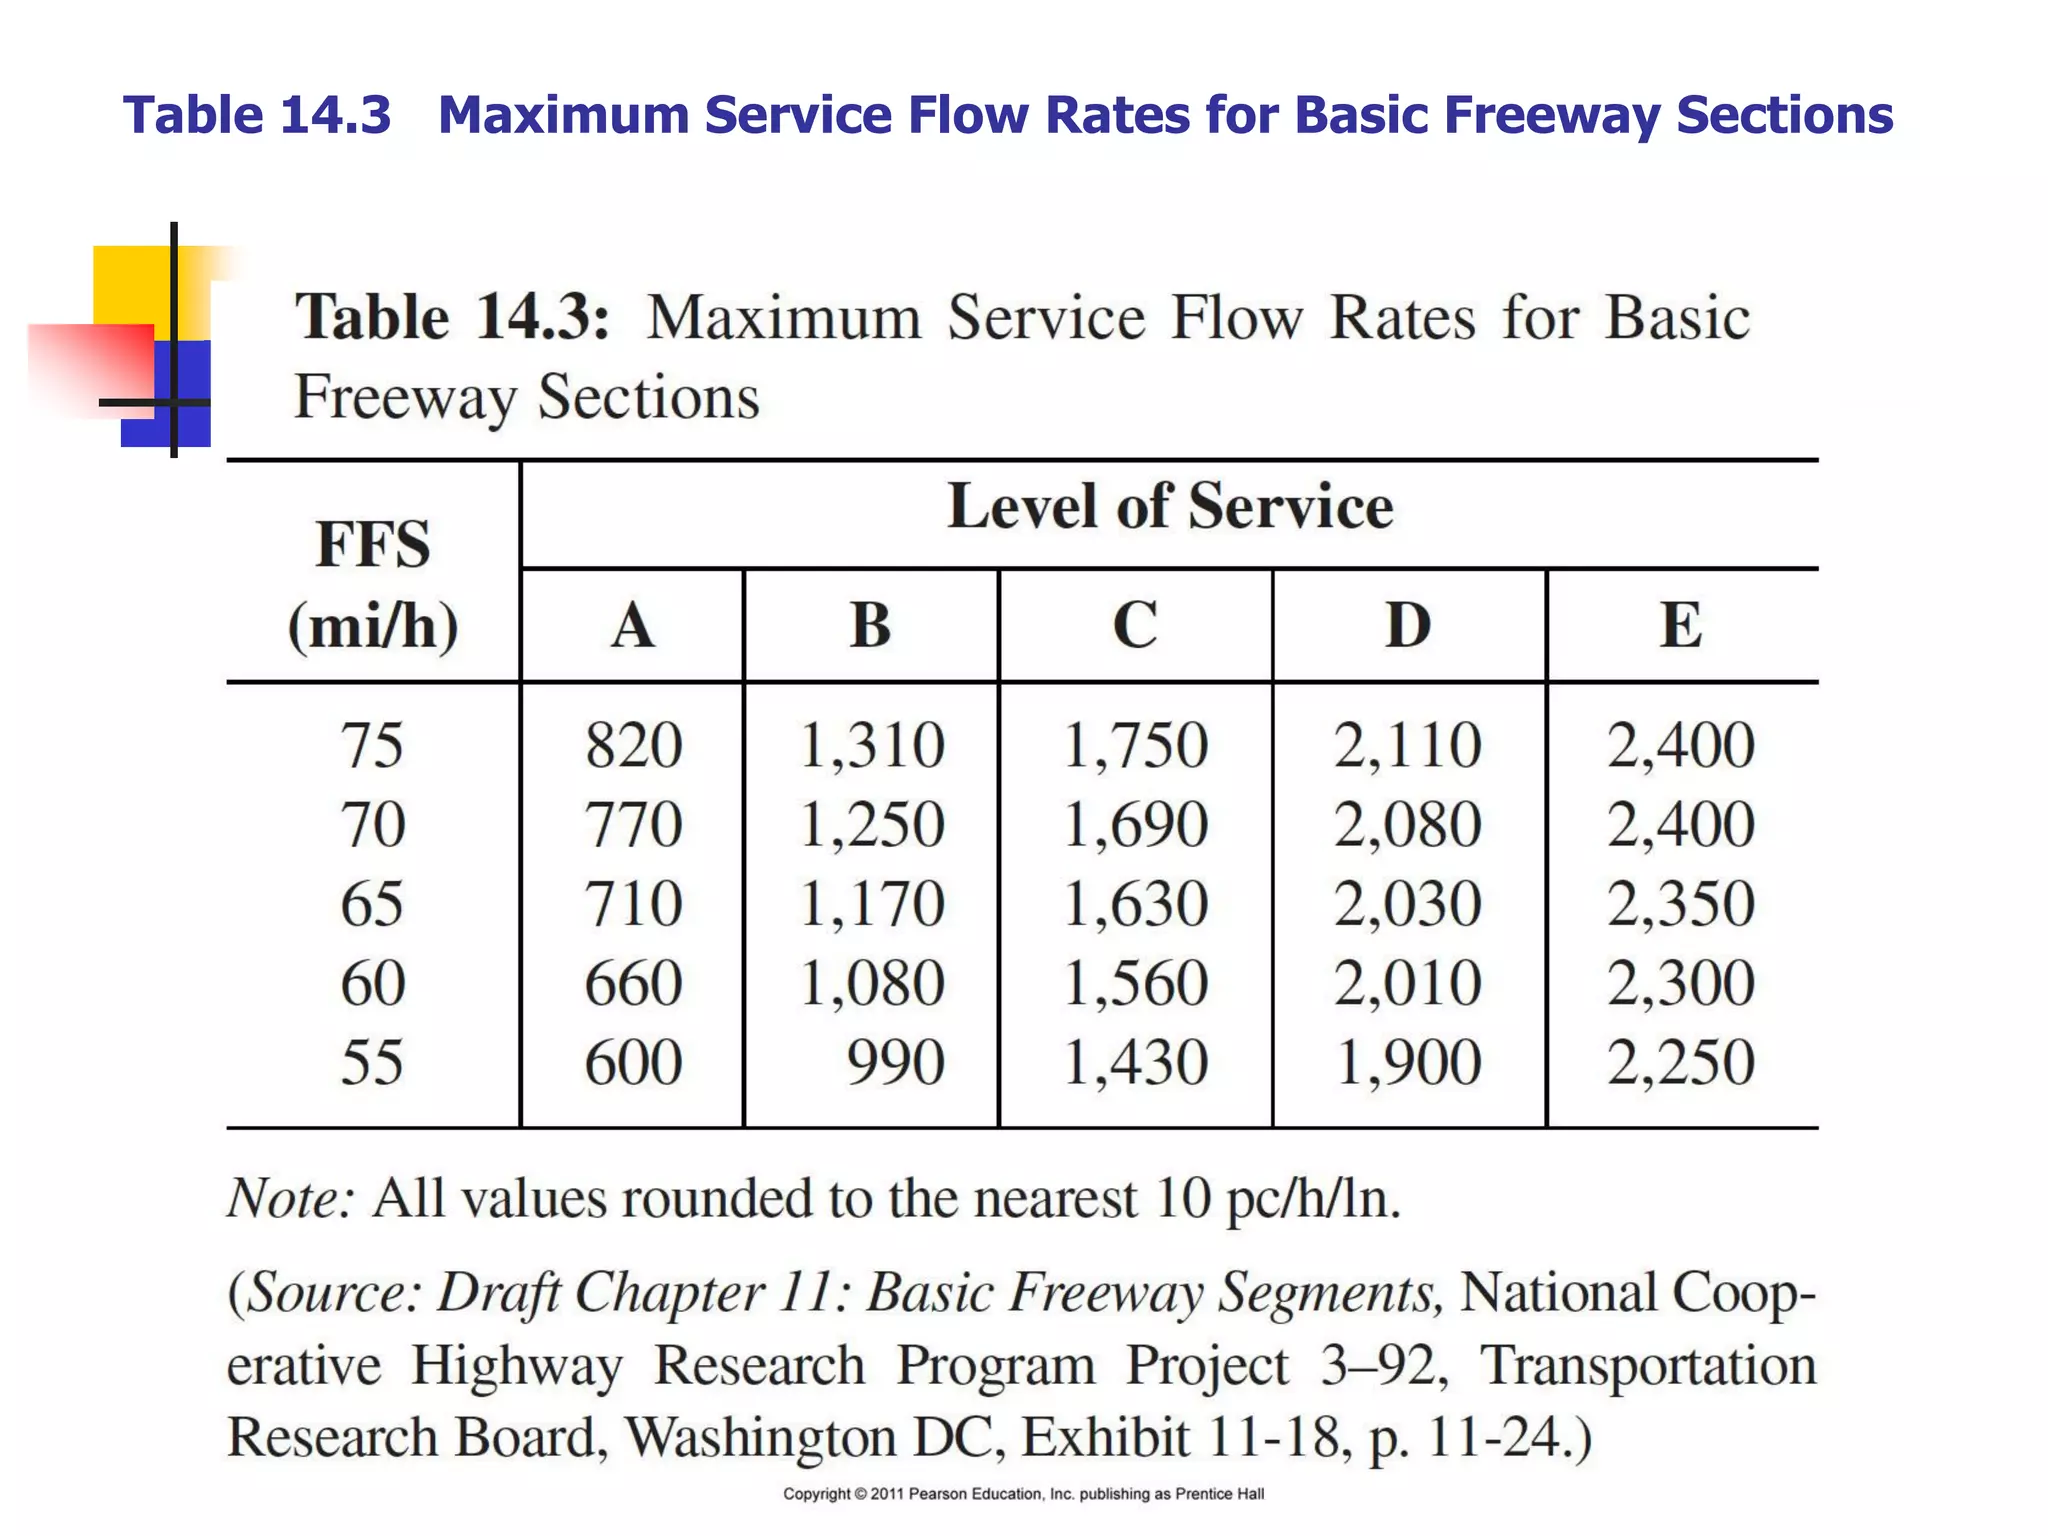
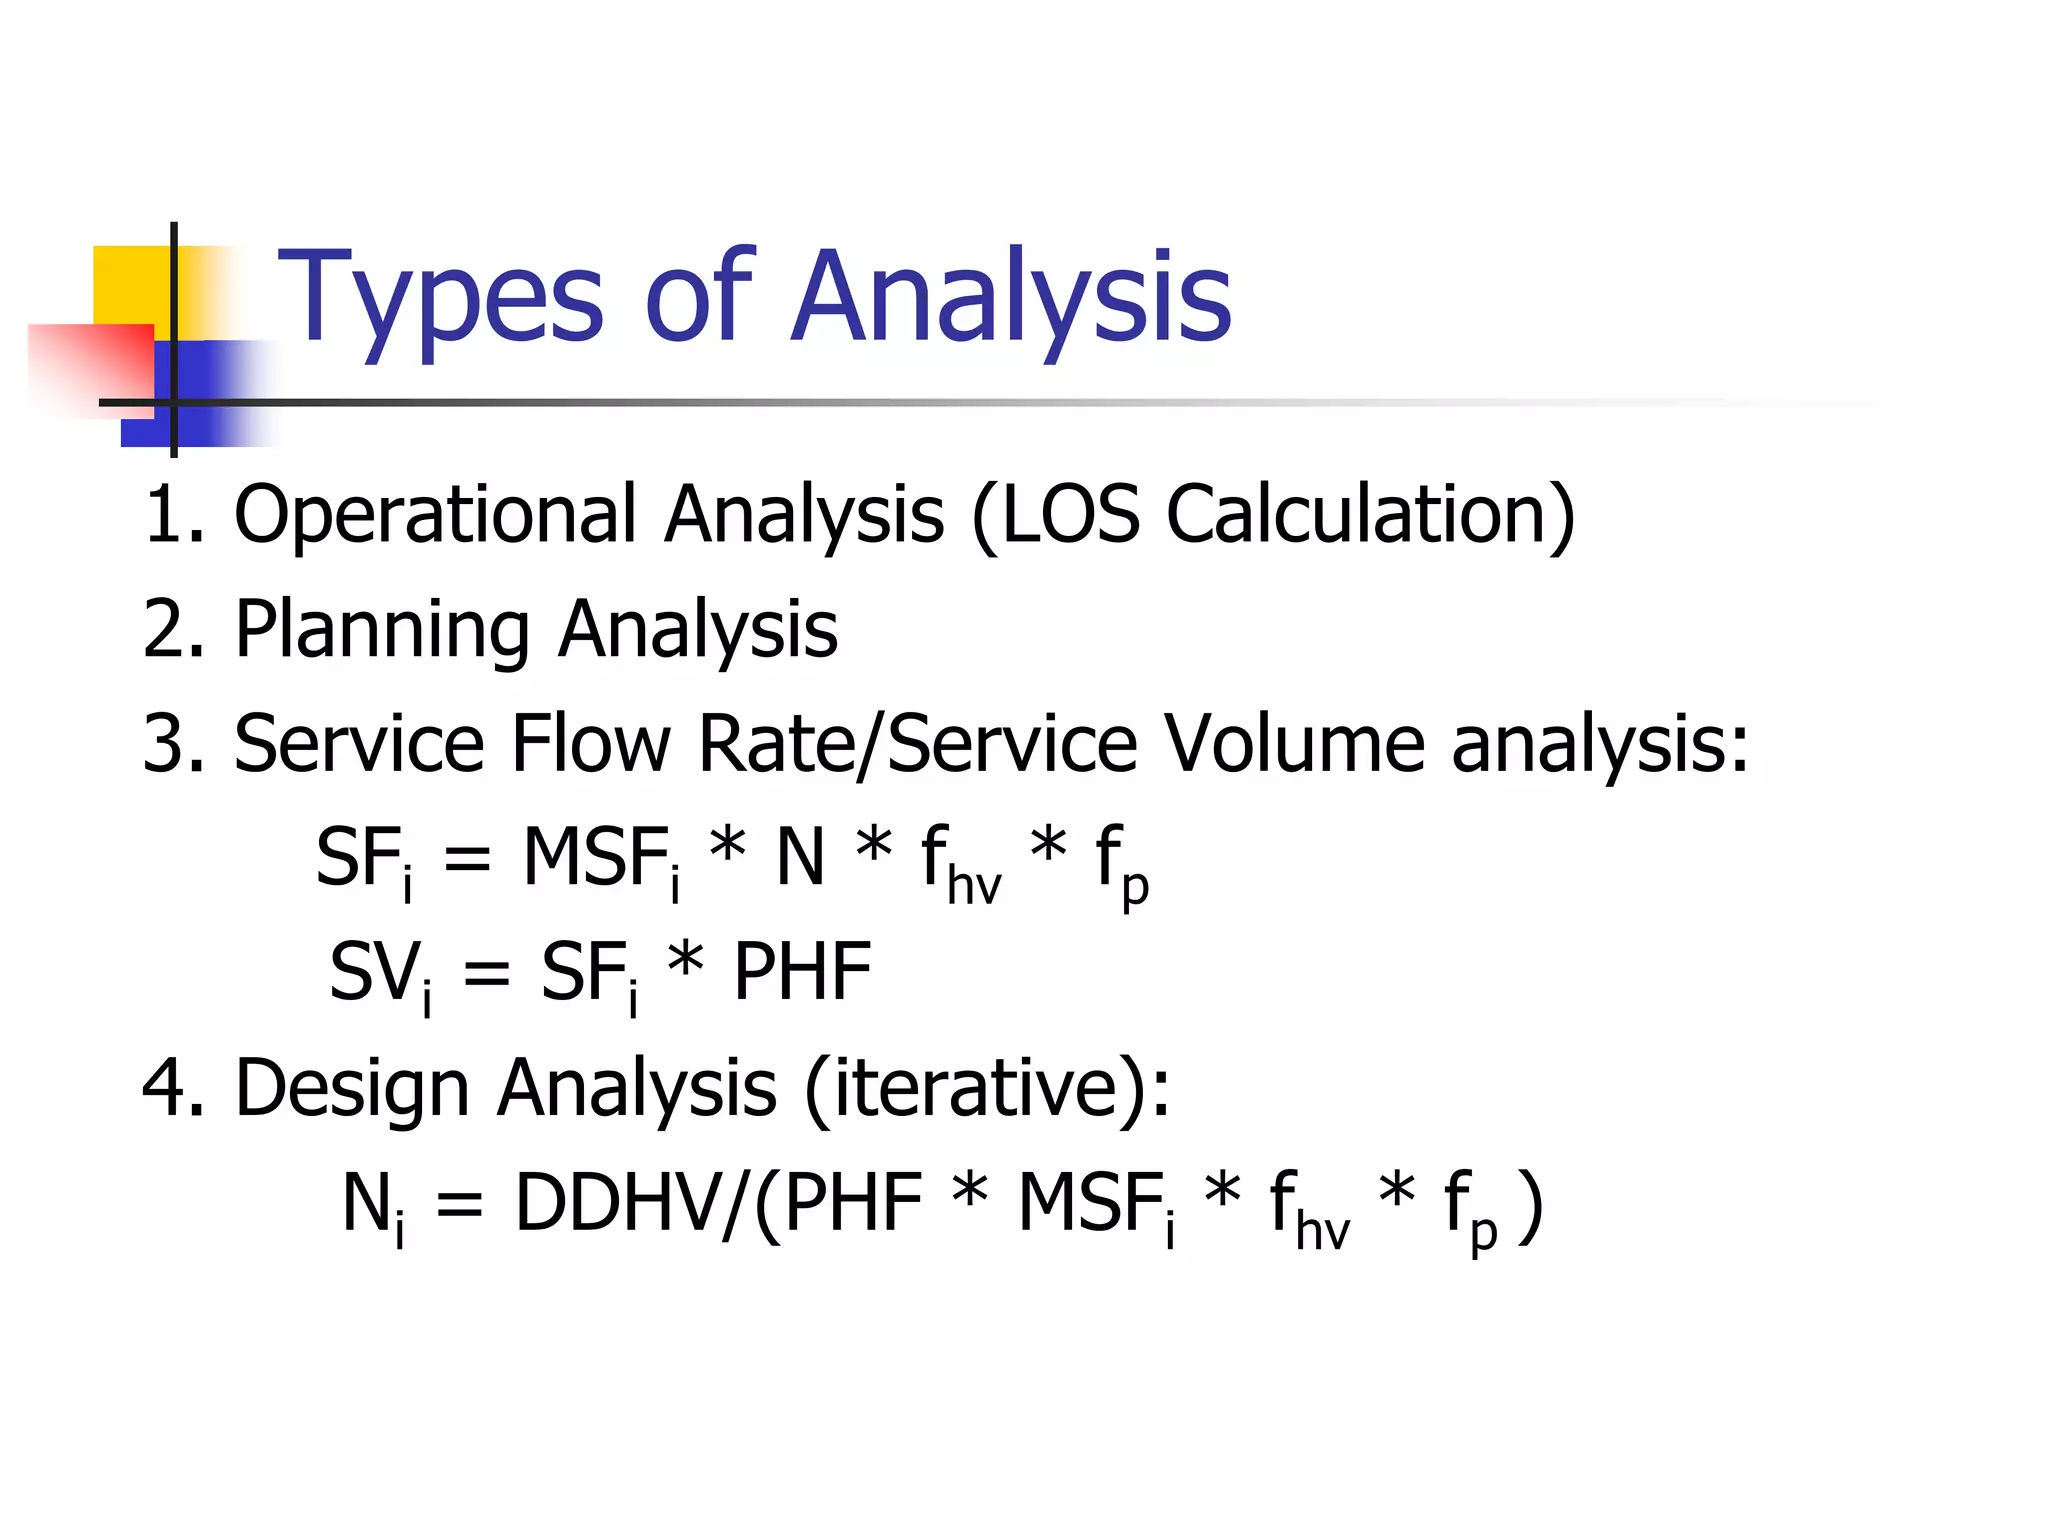
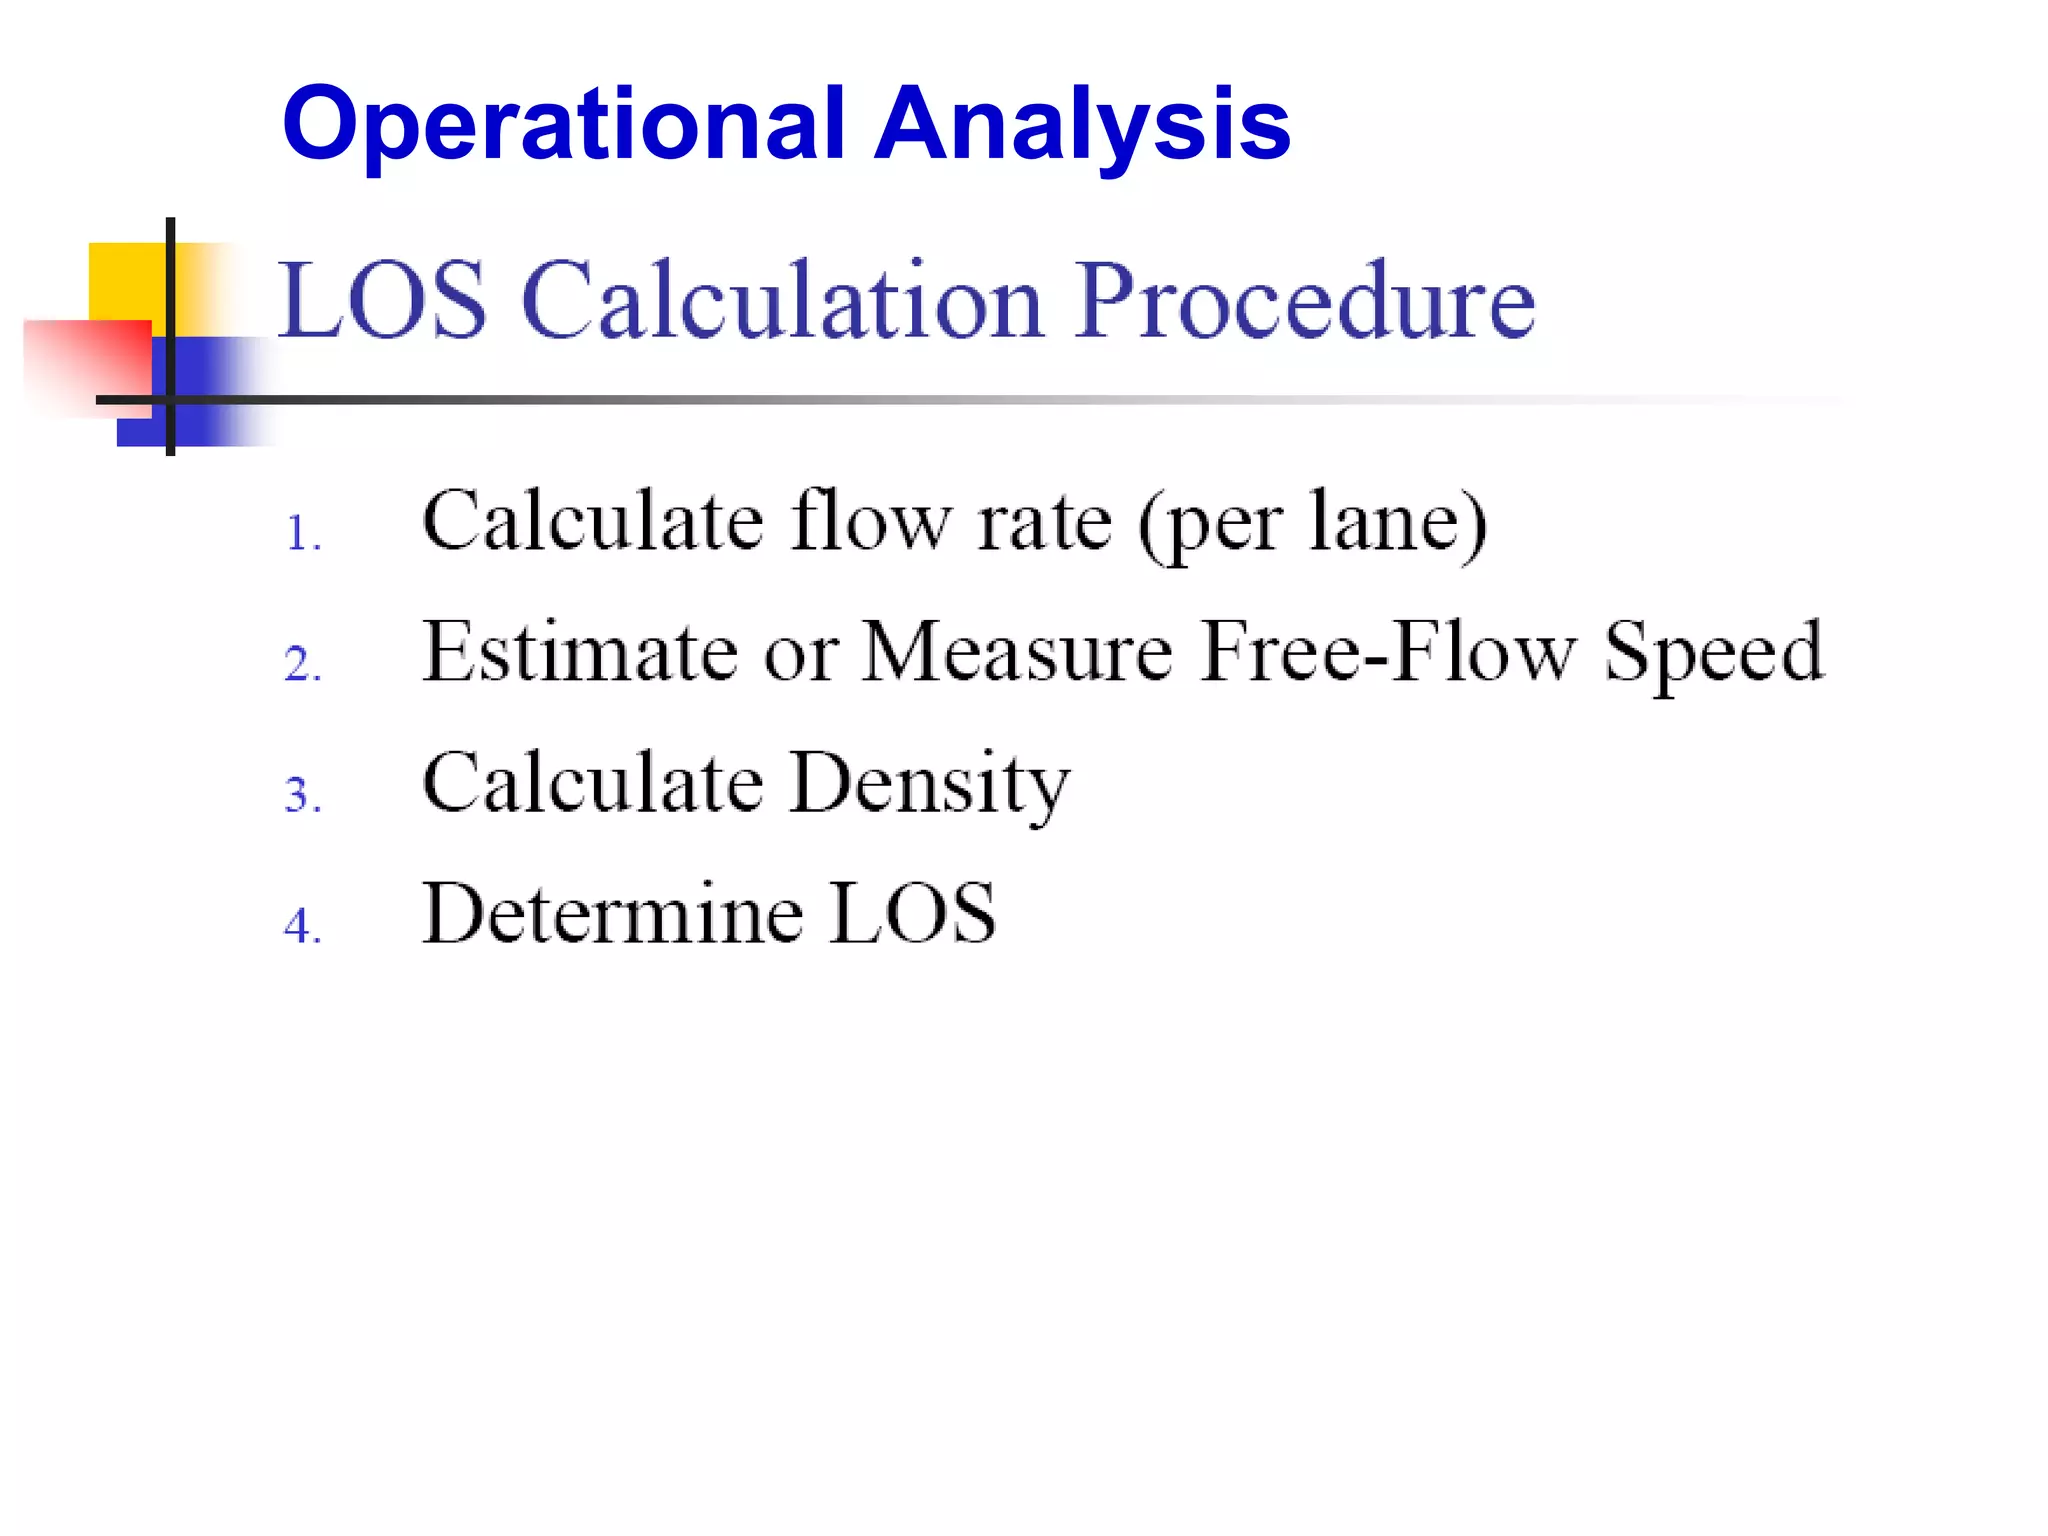
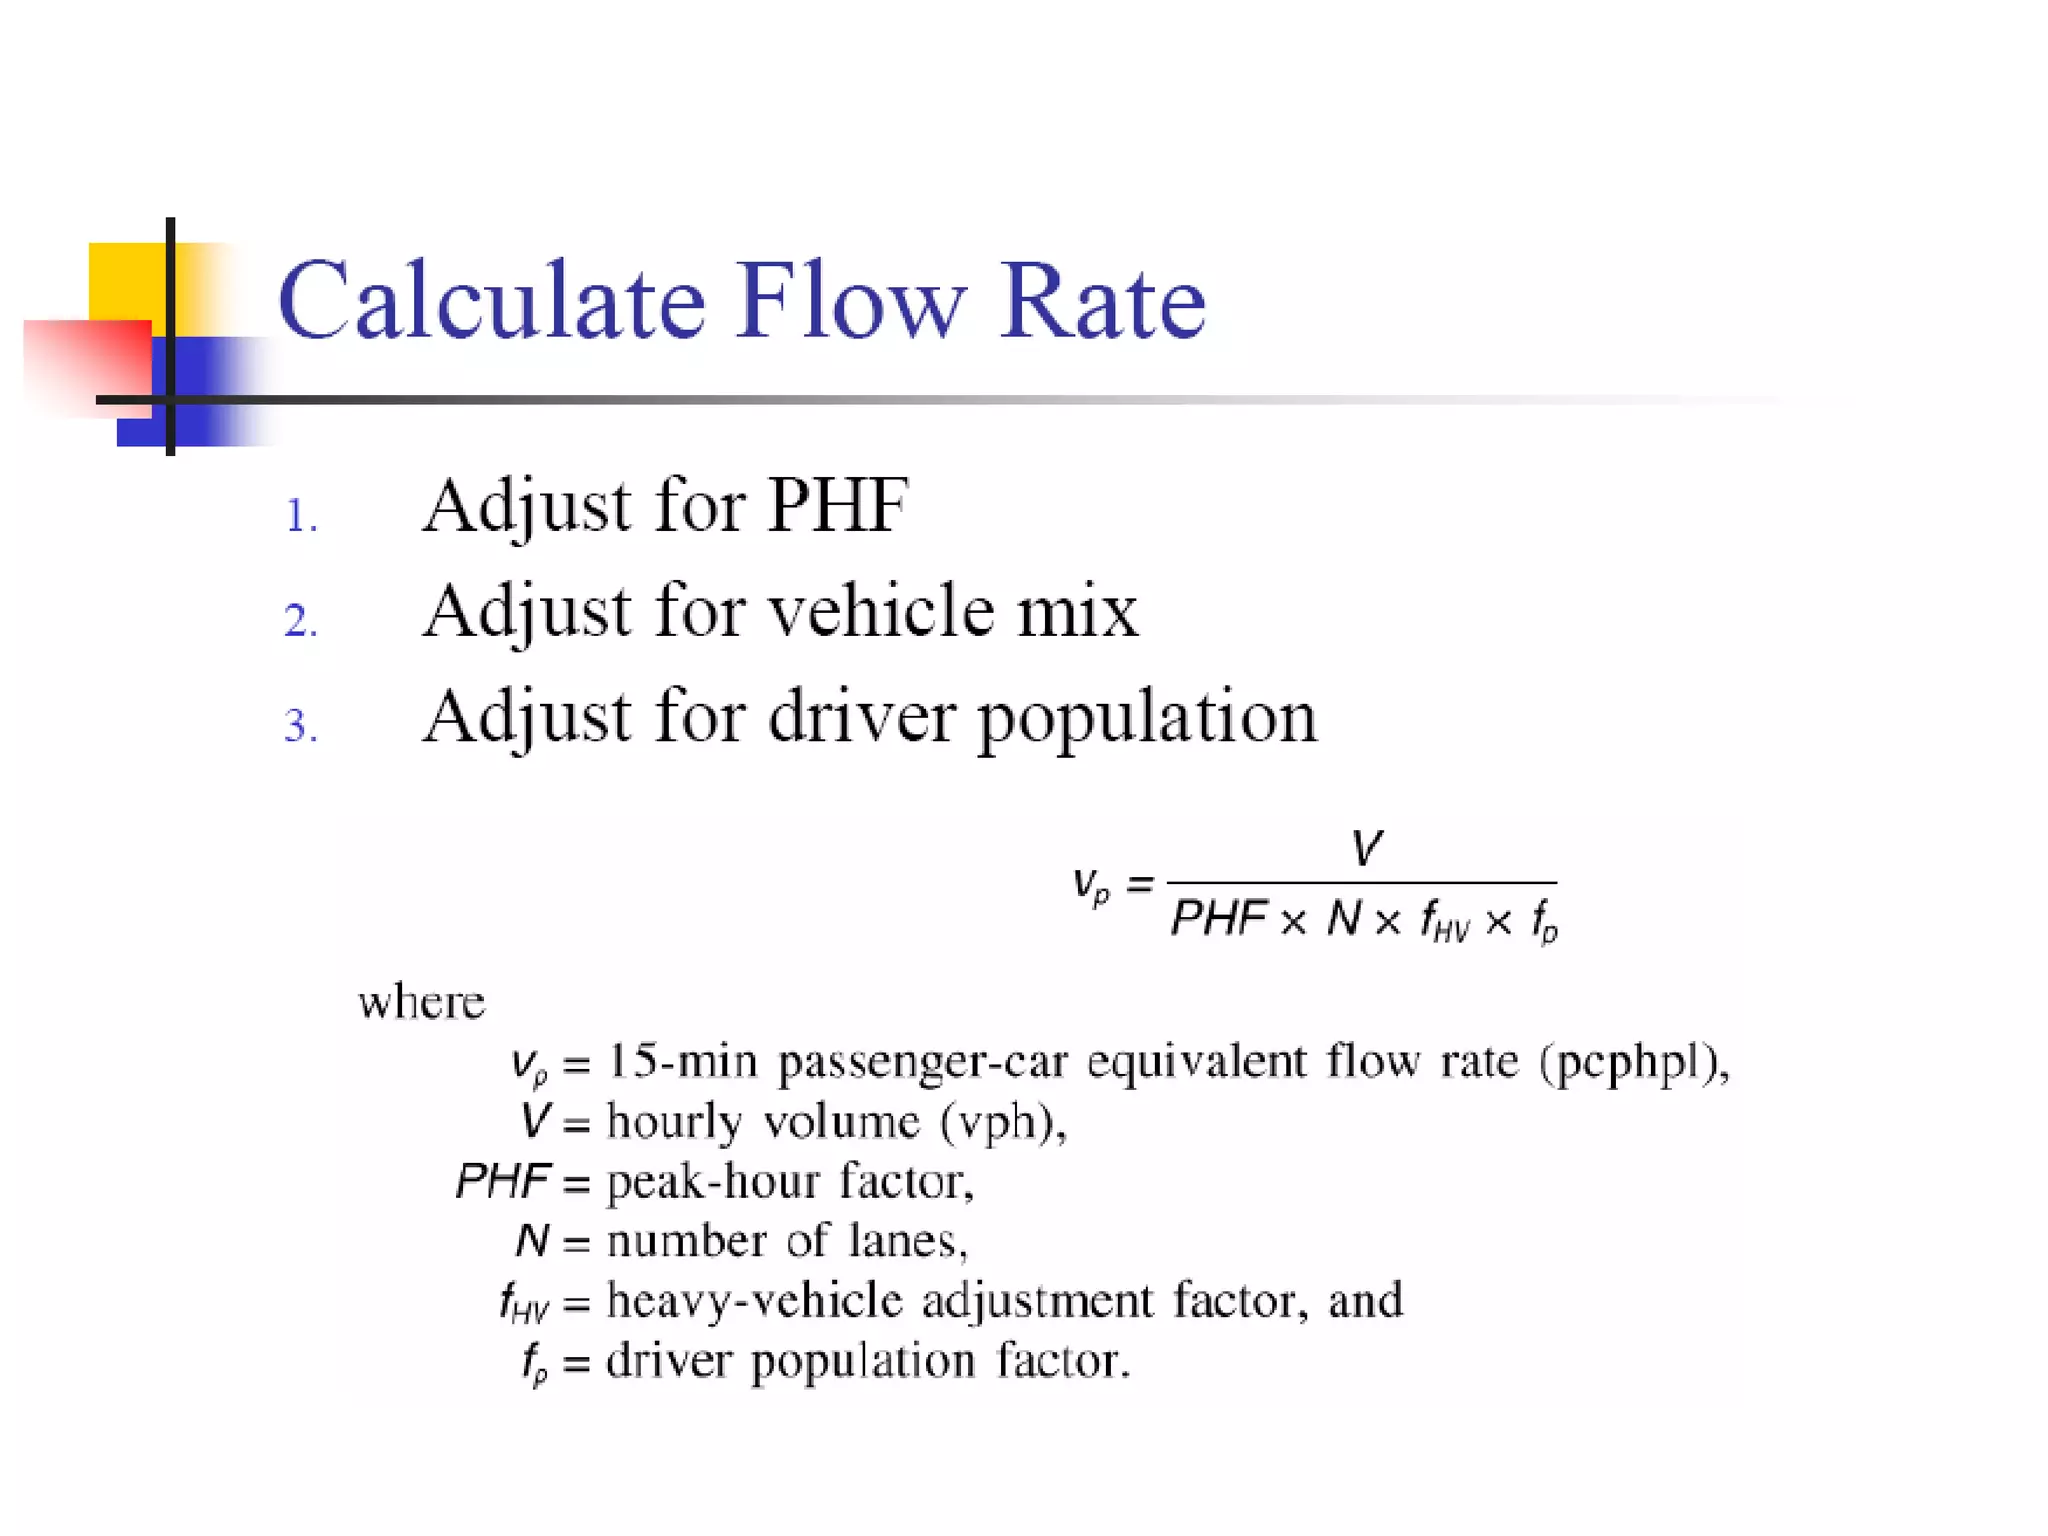
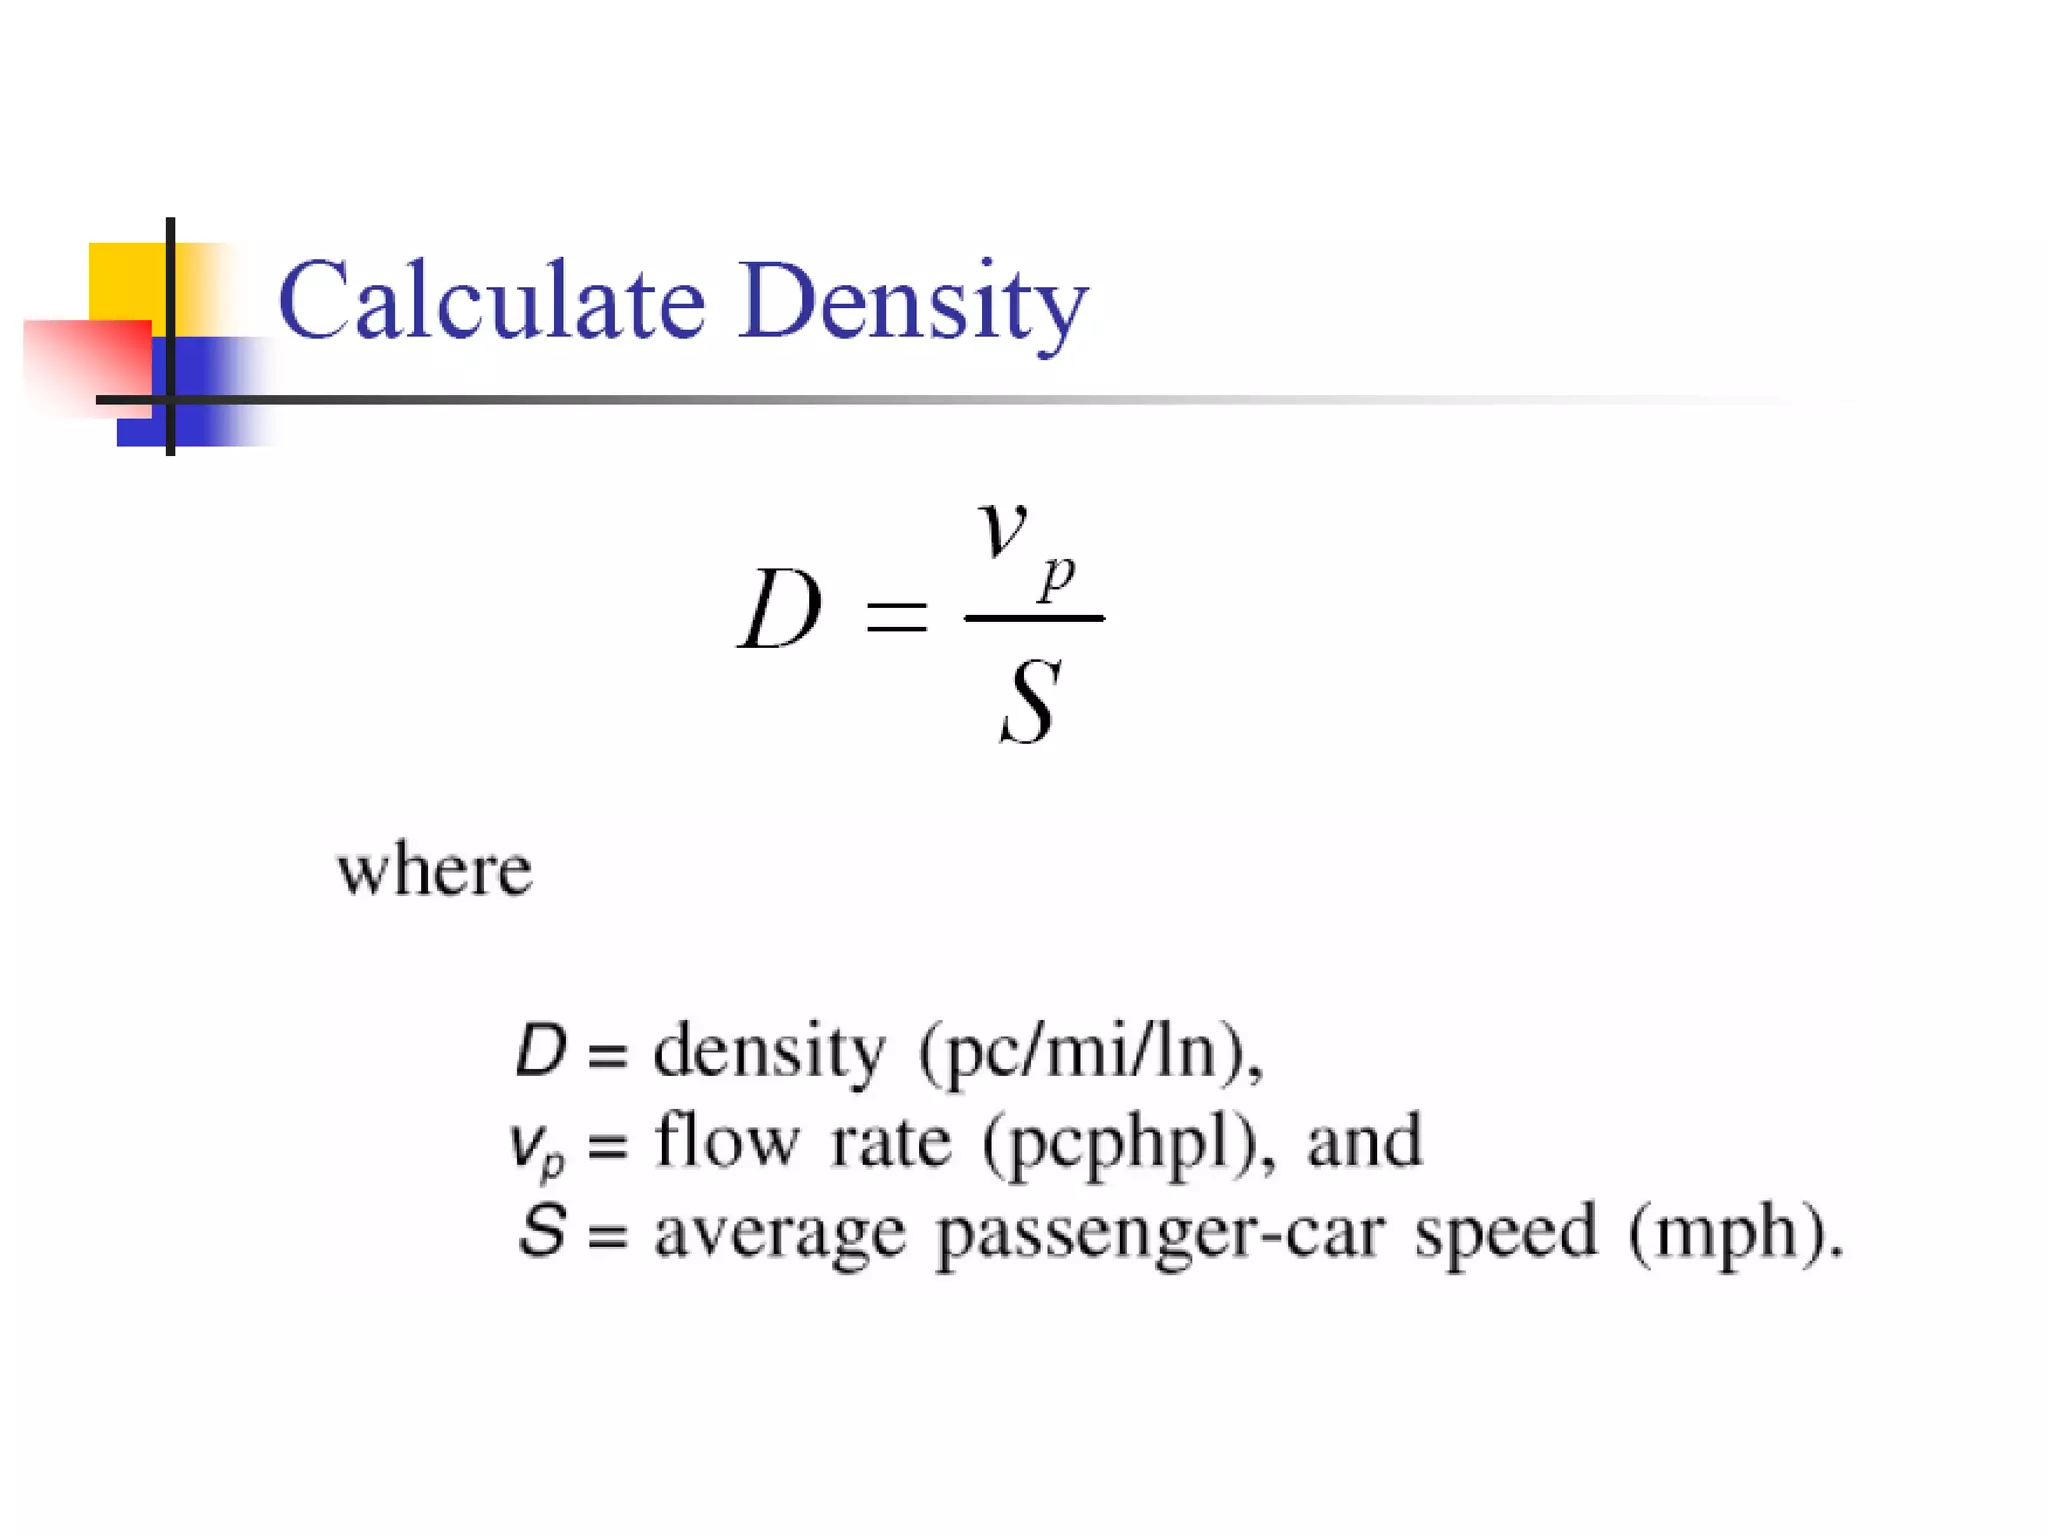
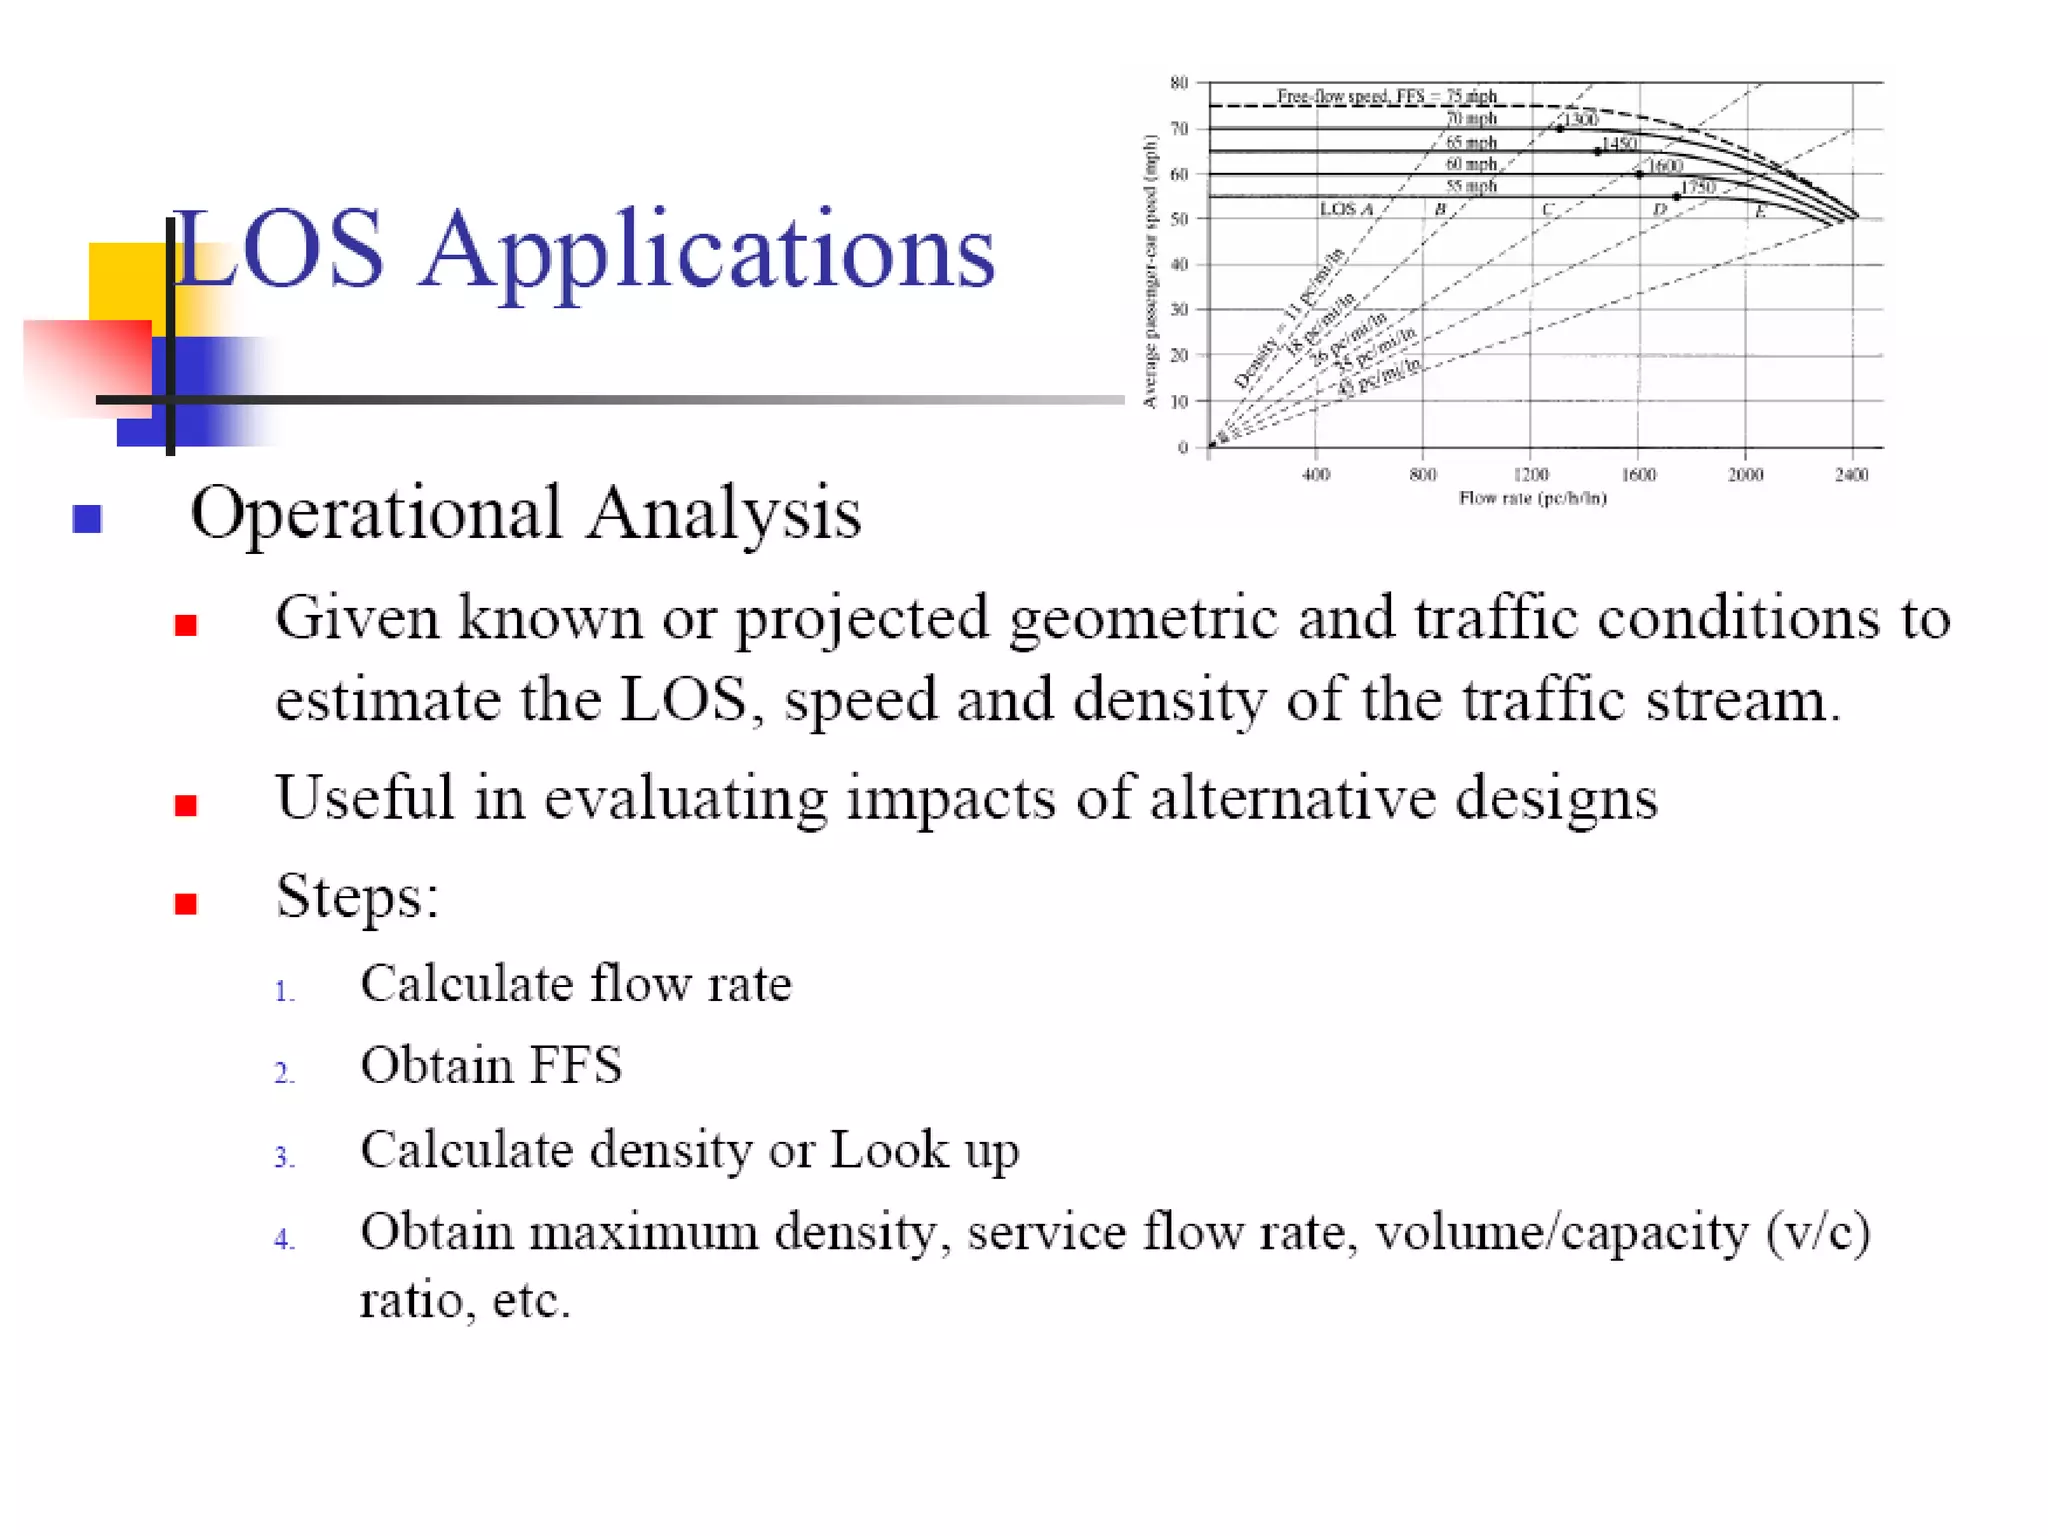
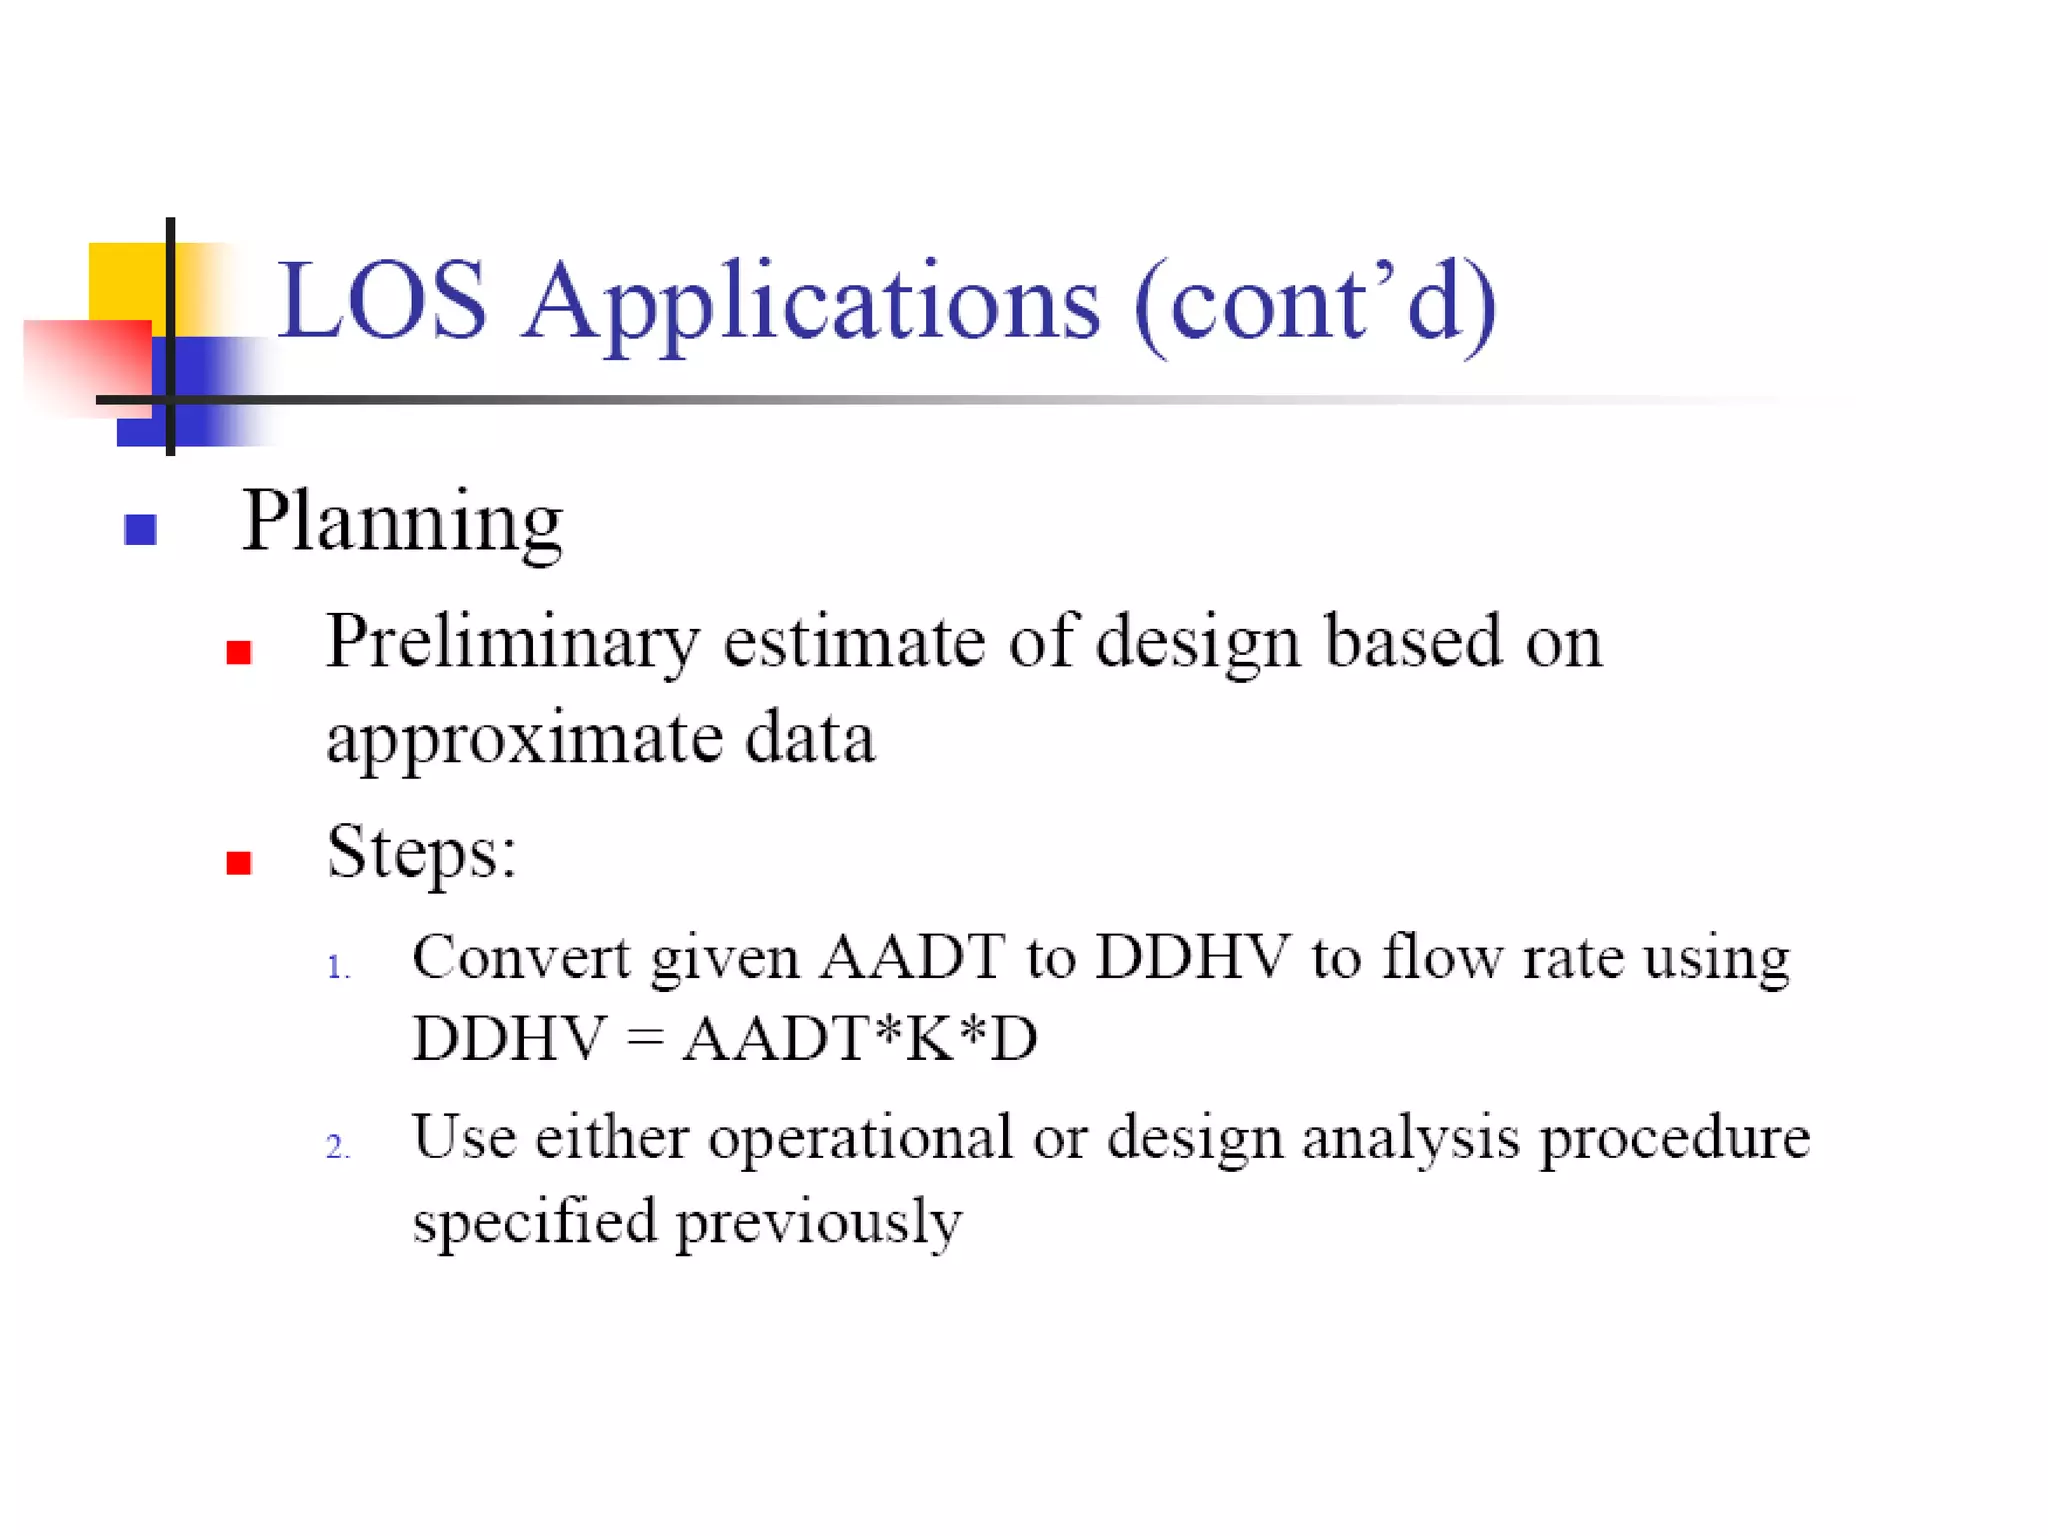
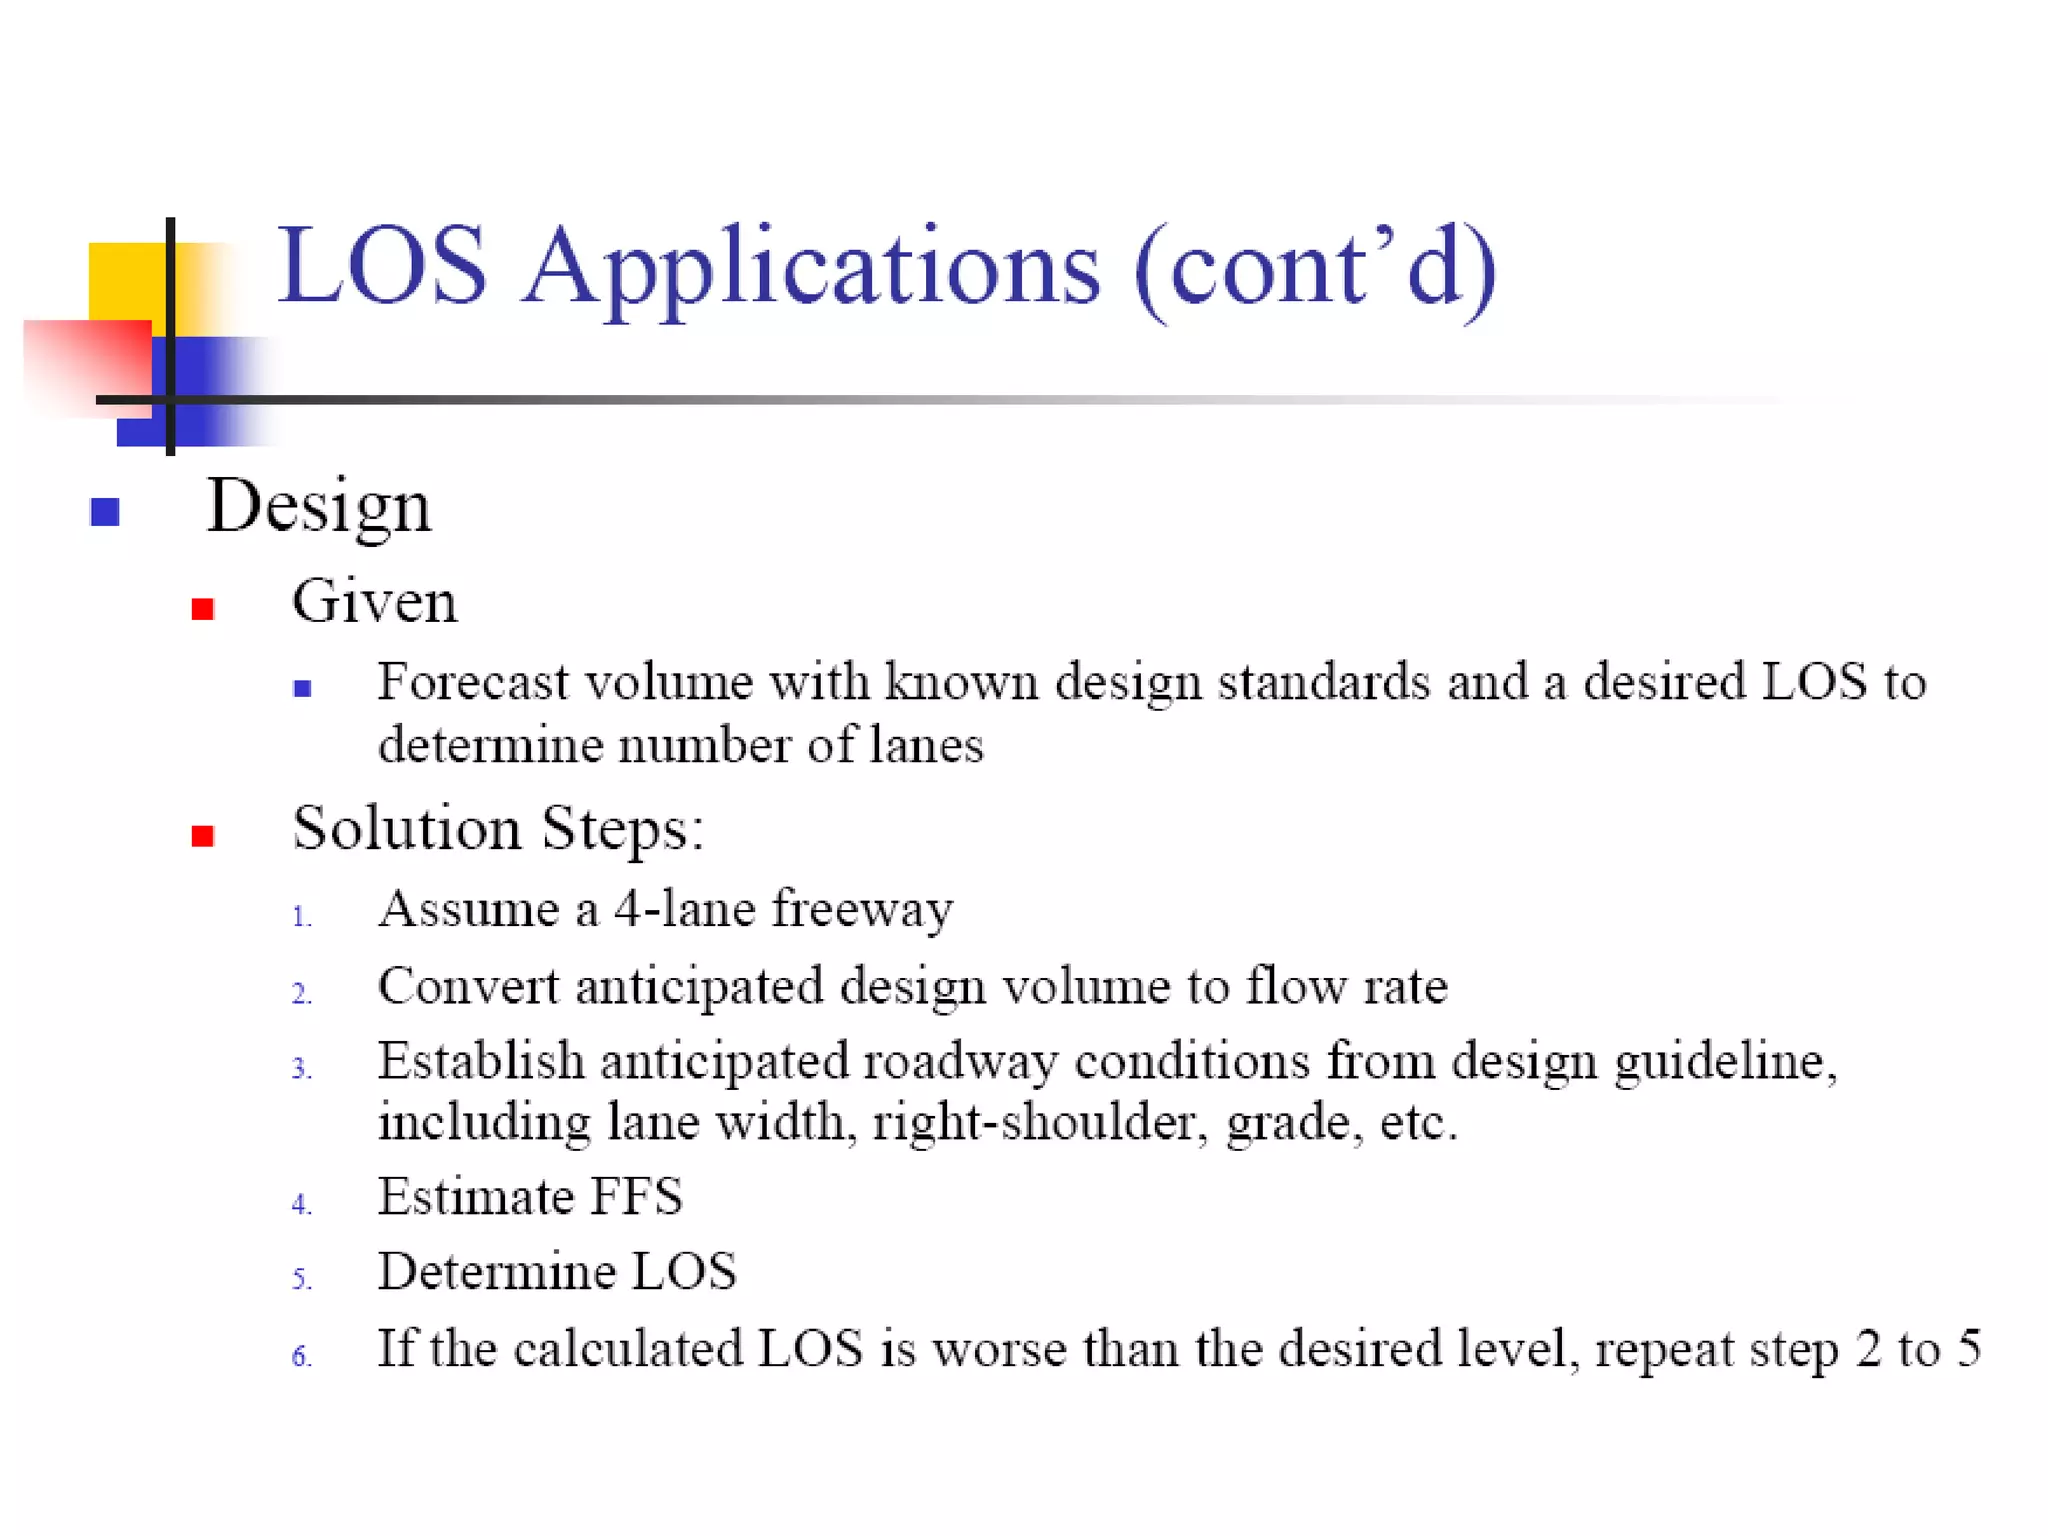
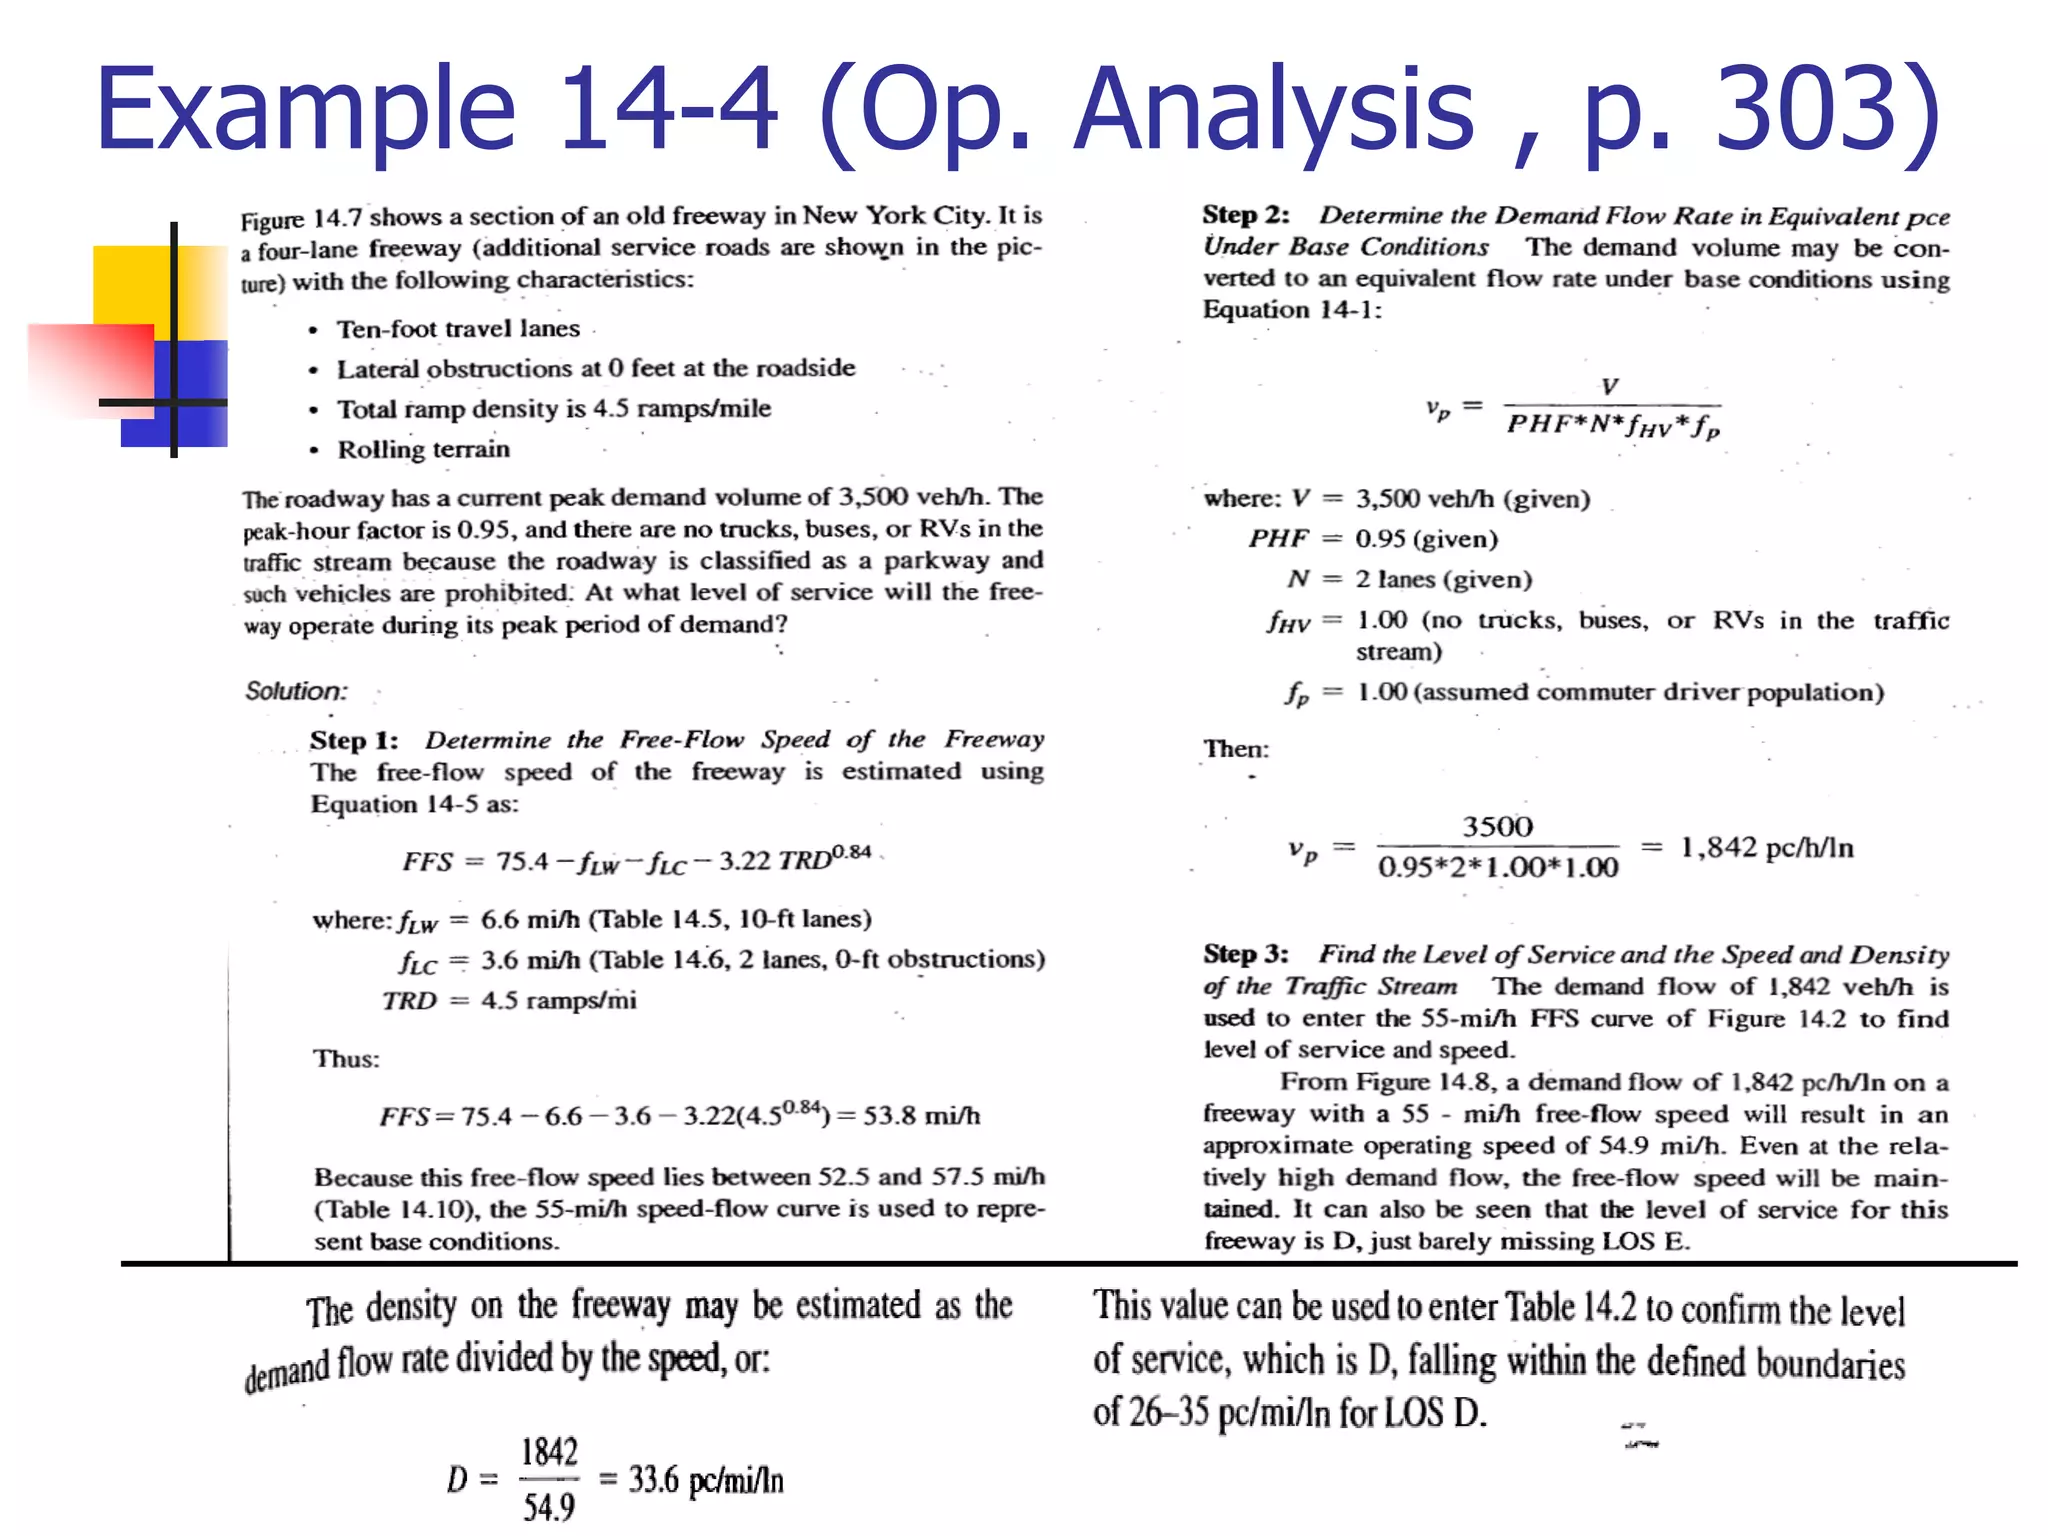
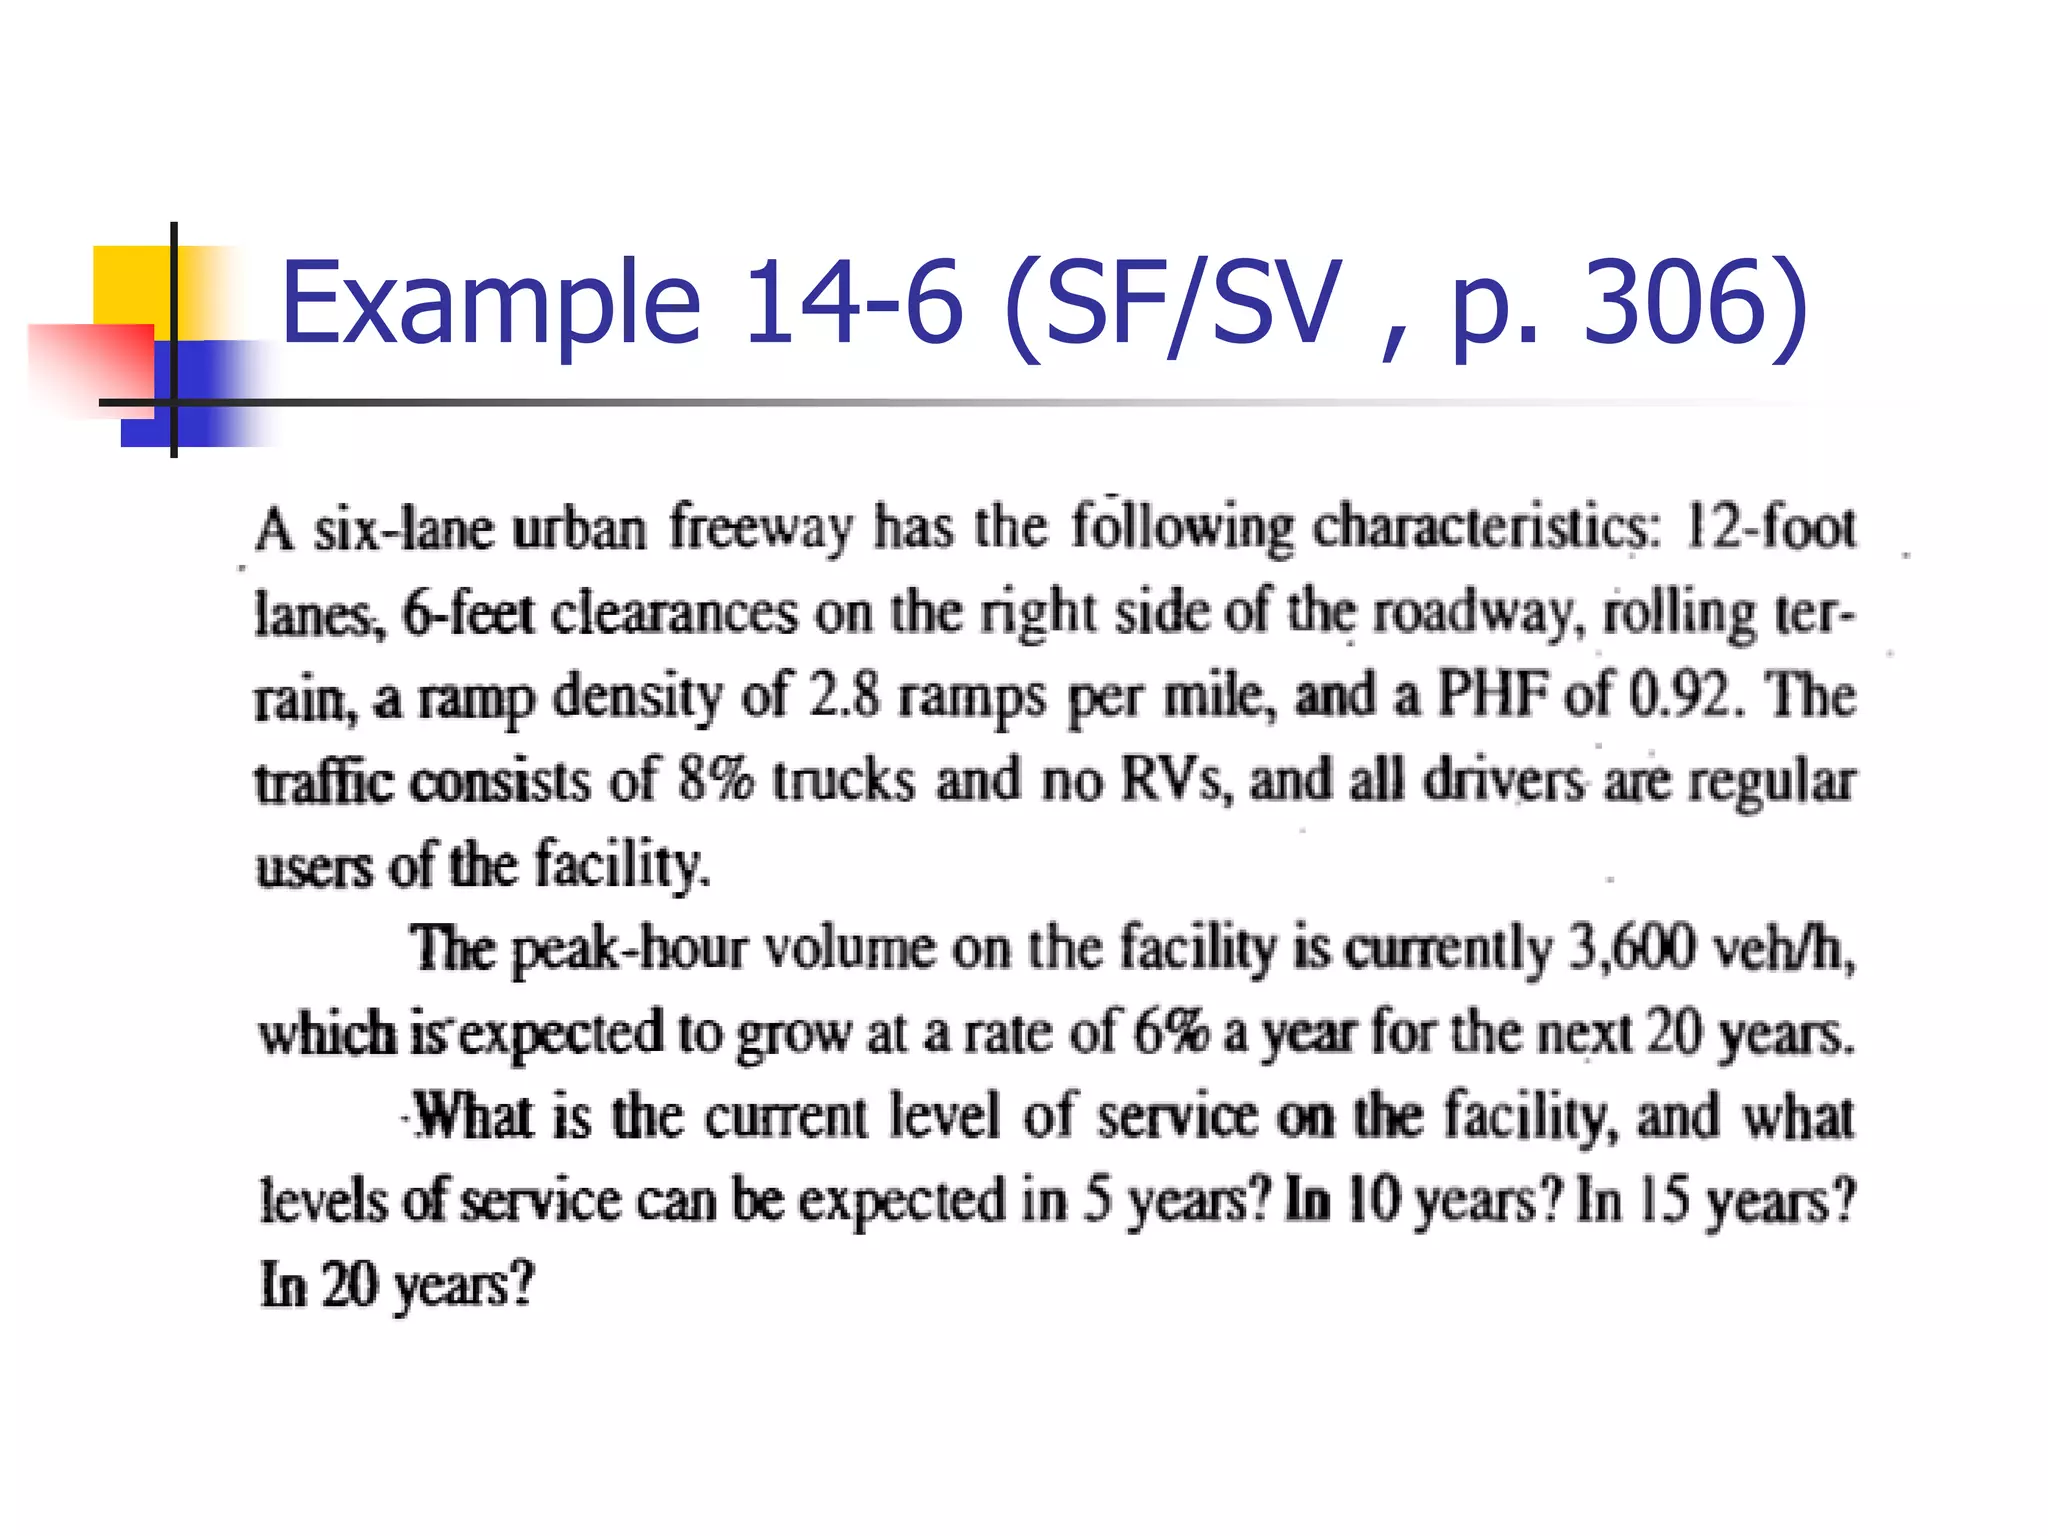
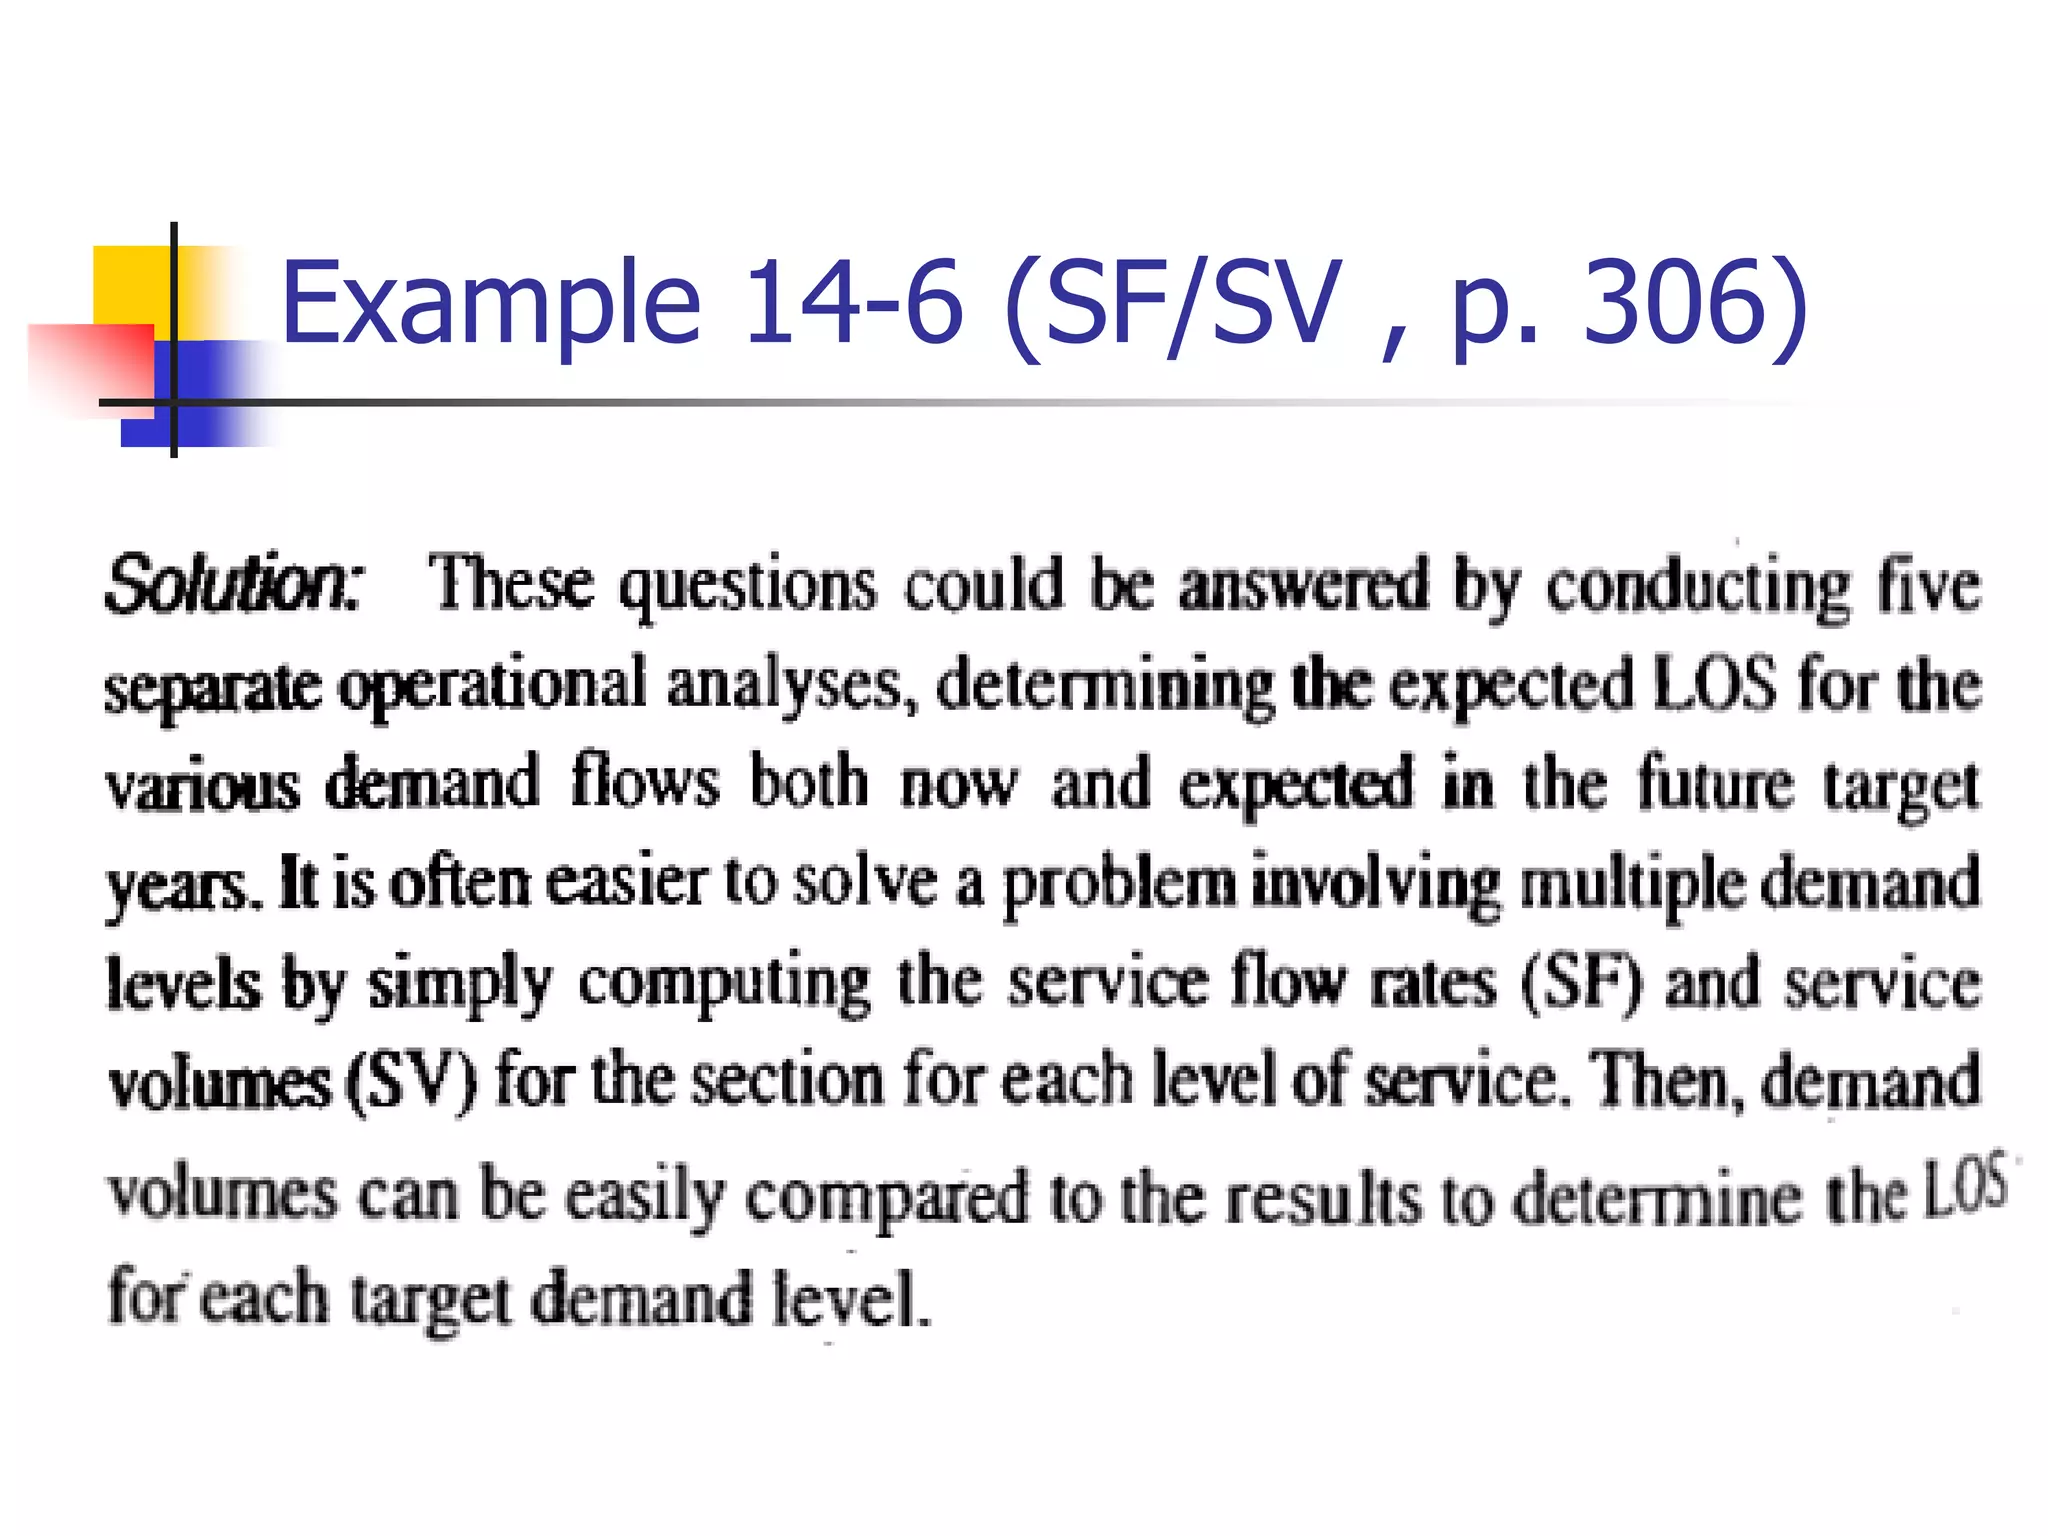
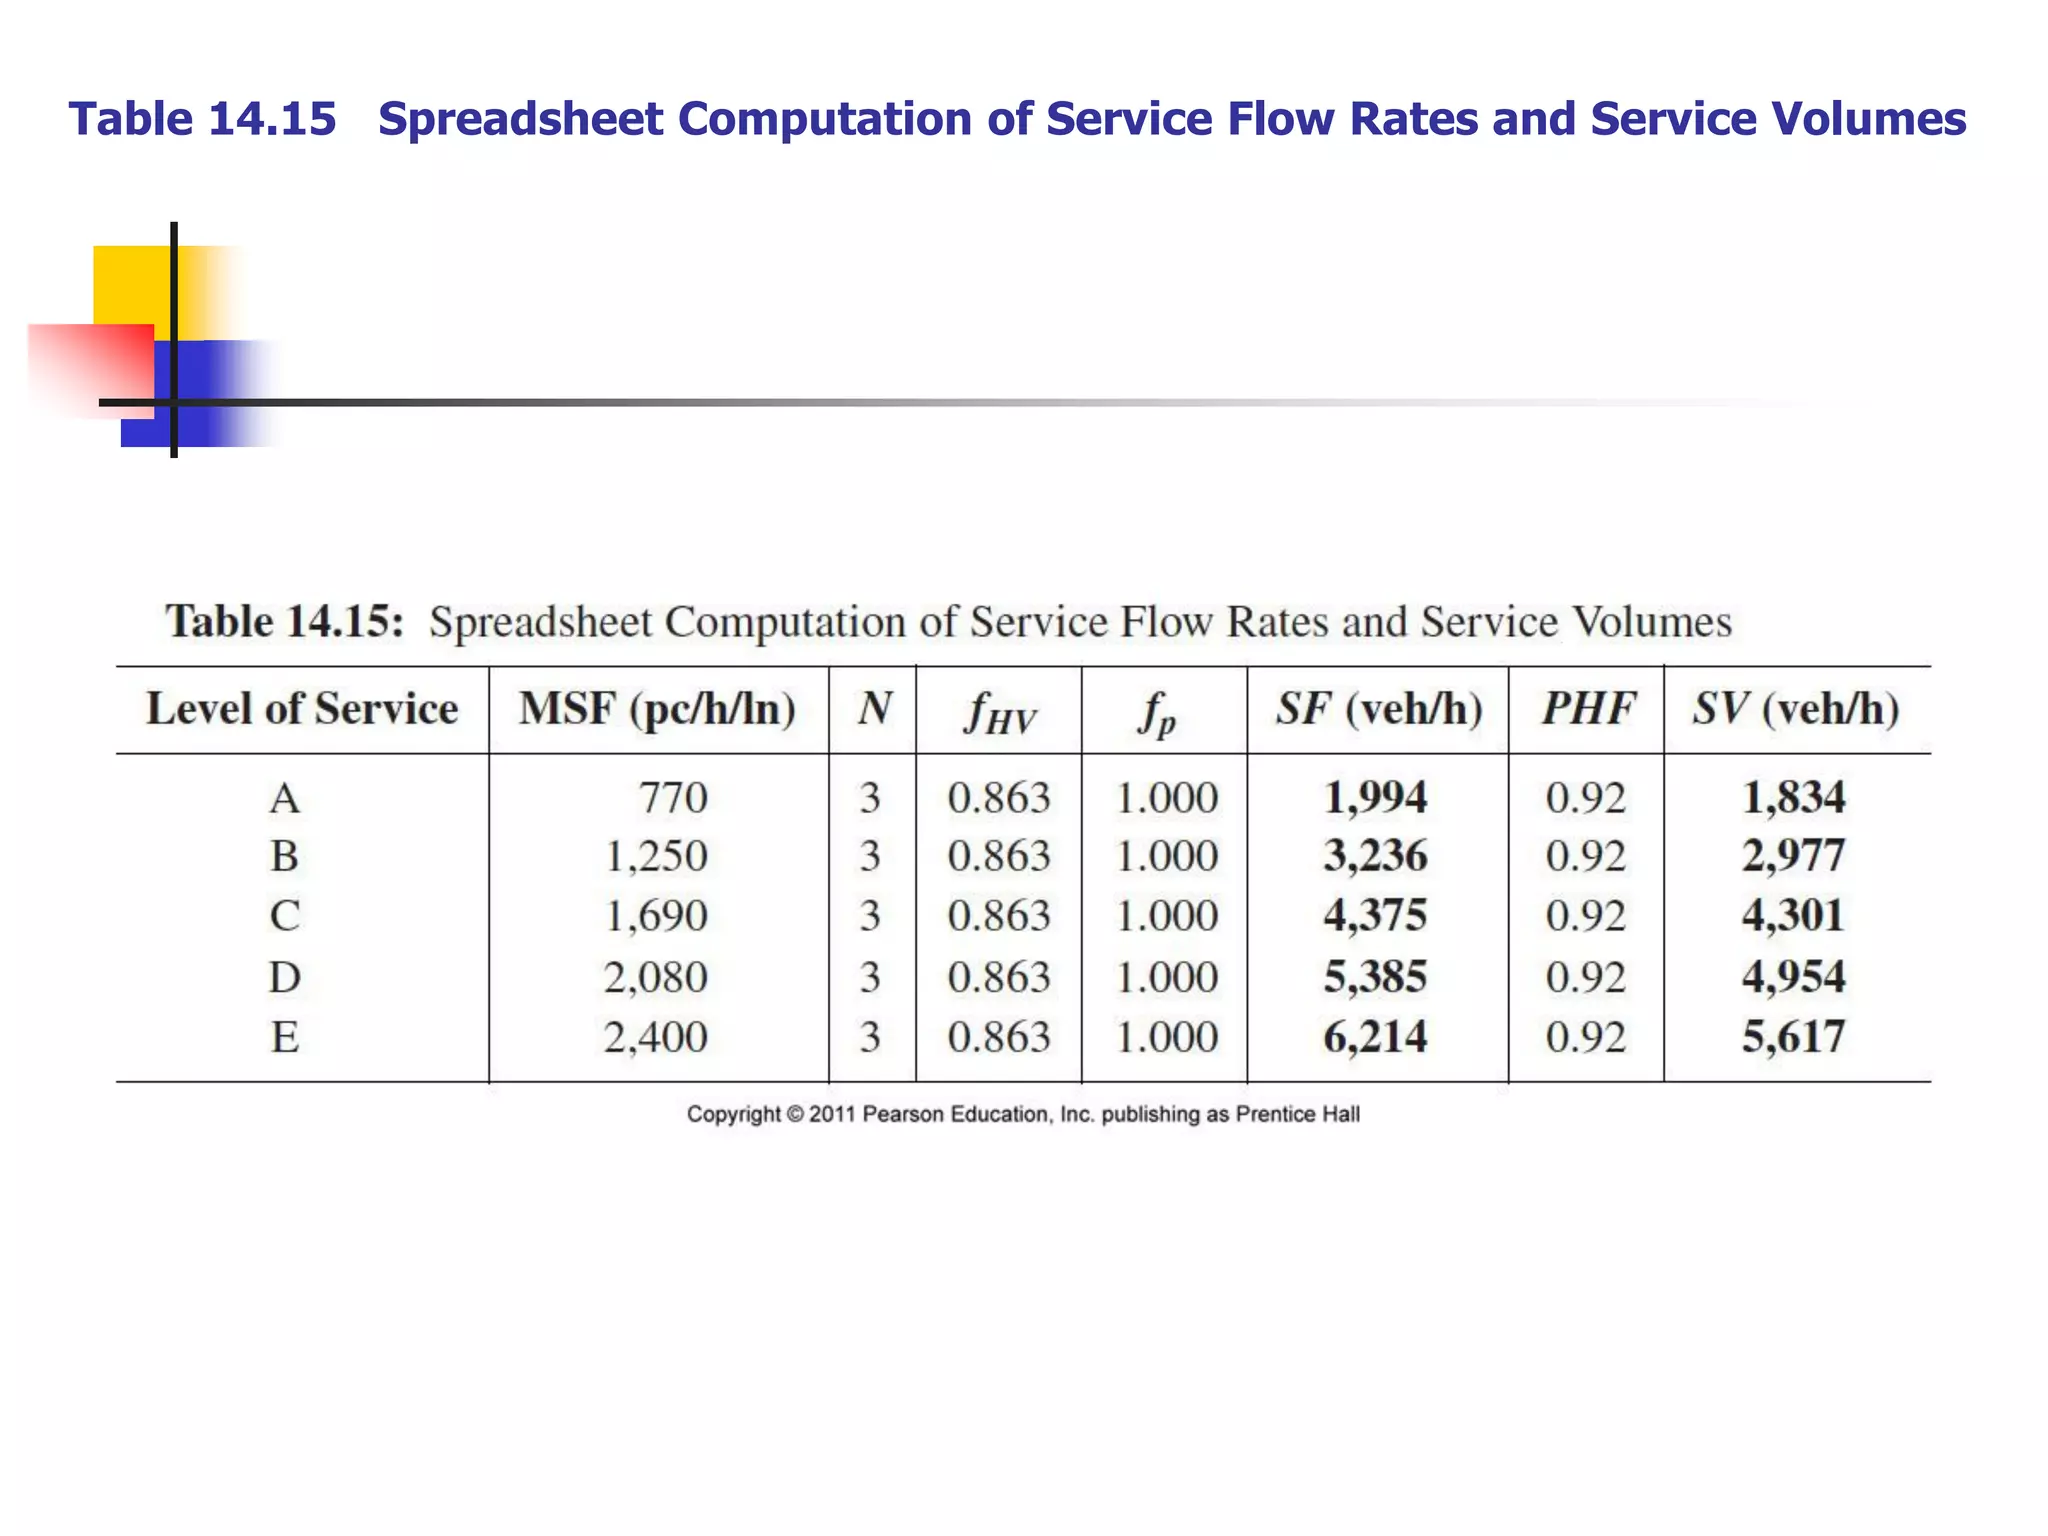
Different analysis types including operational analysis and service flow rate/service volume analysis.
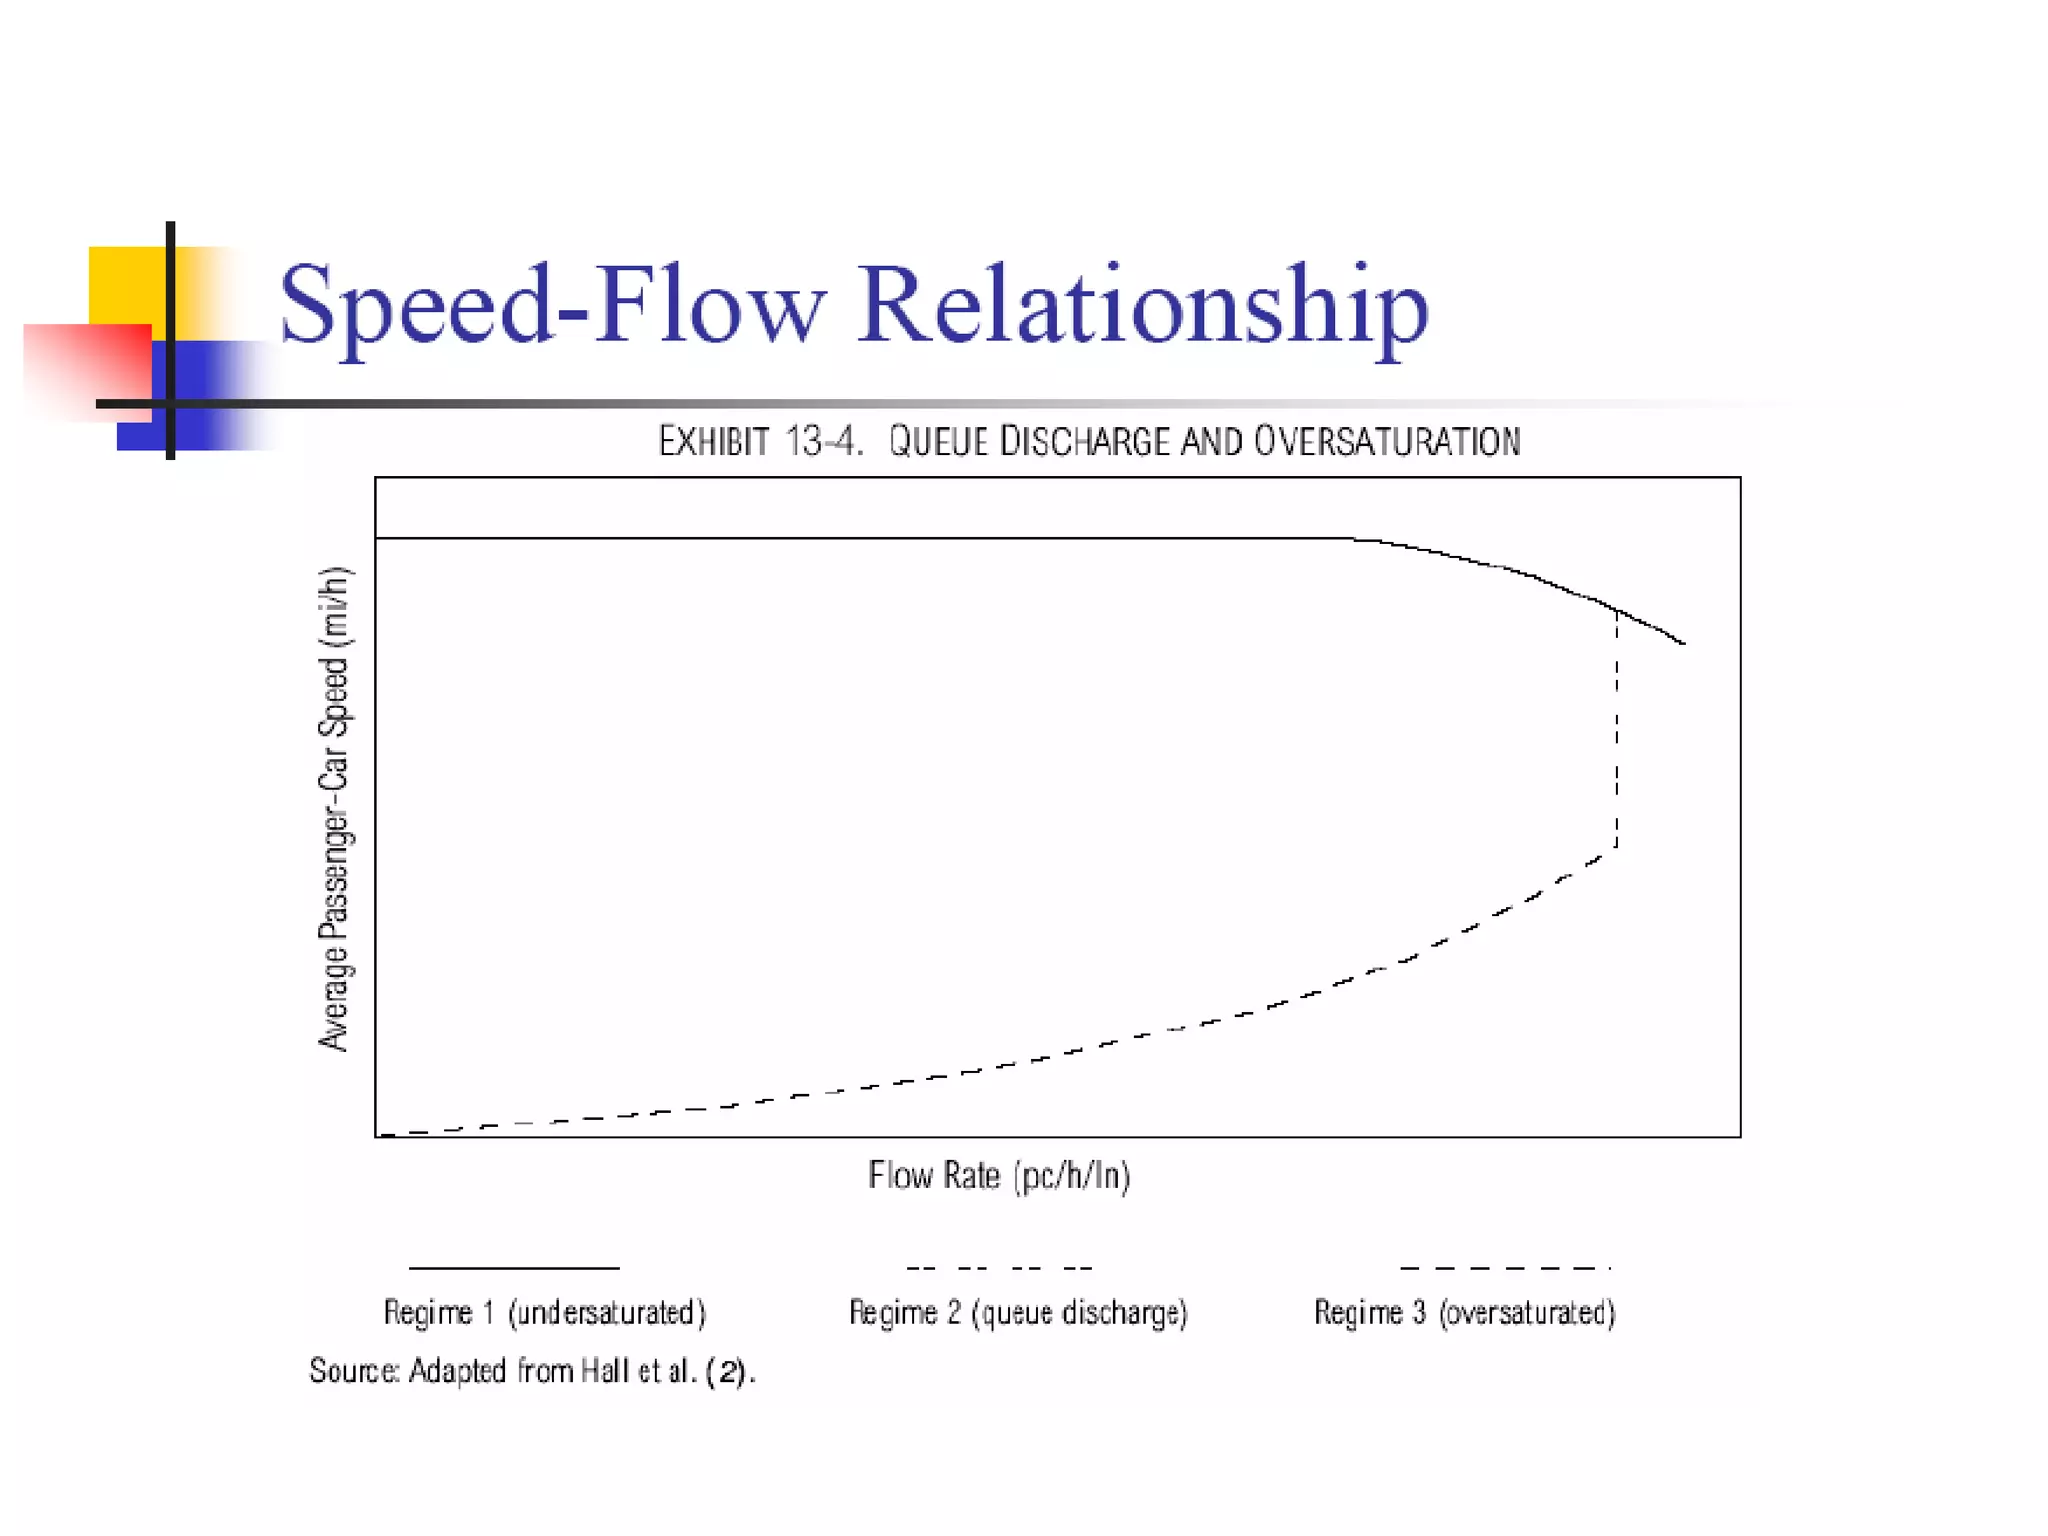
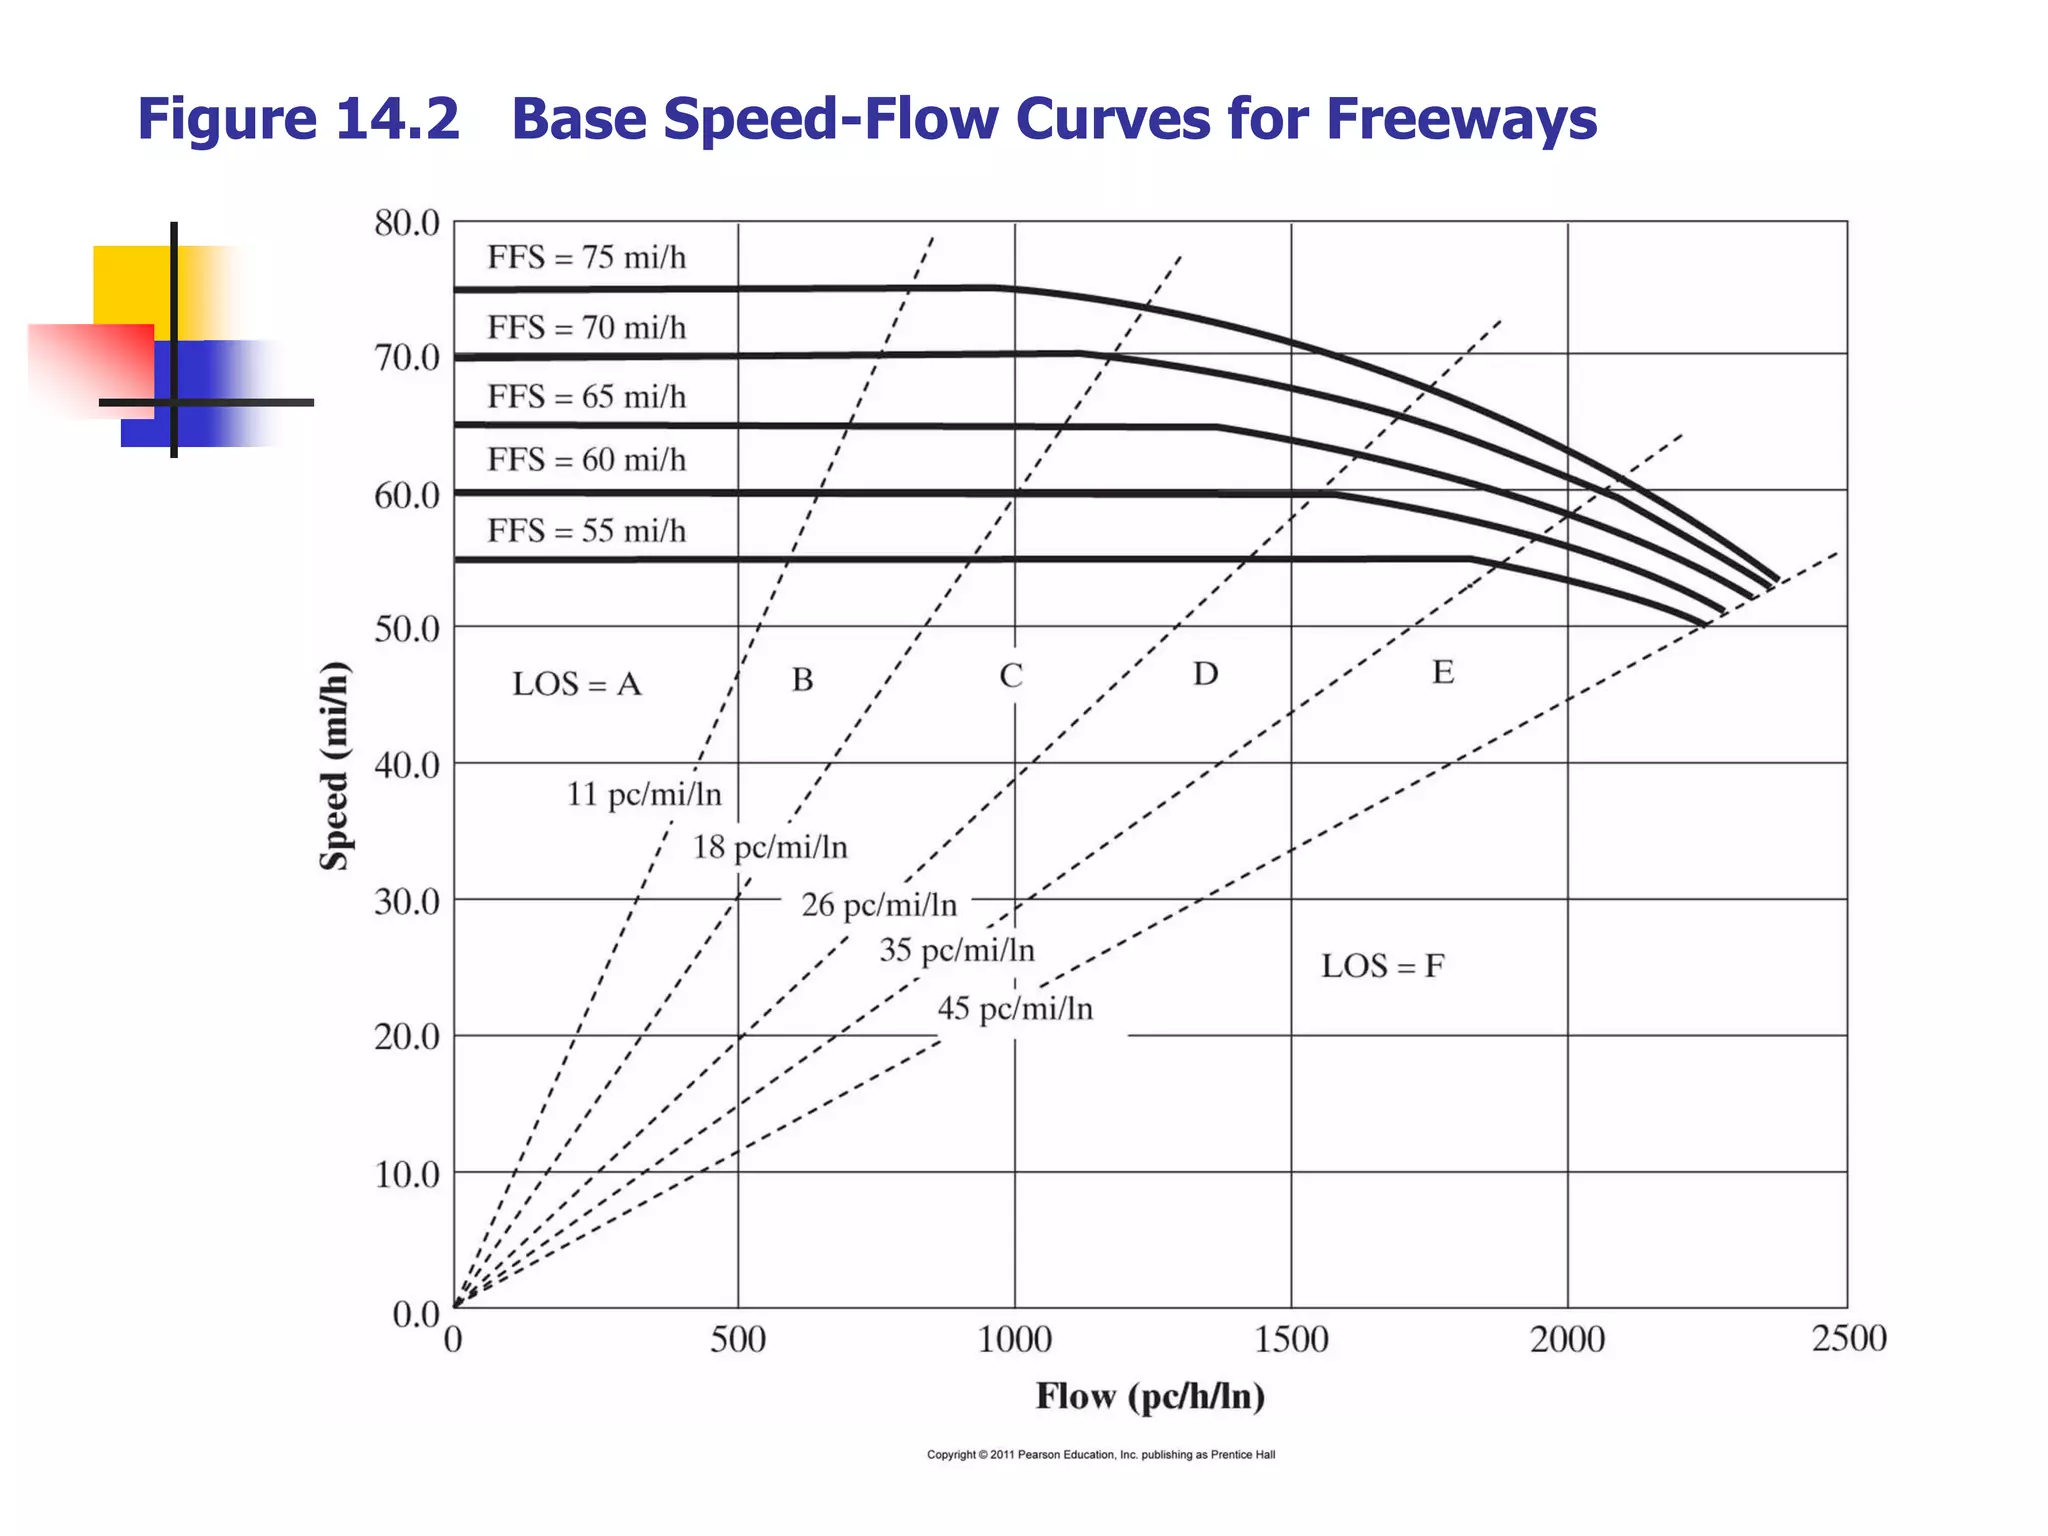
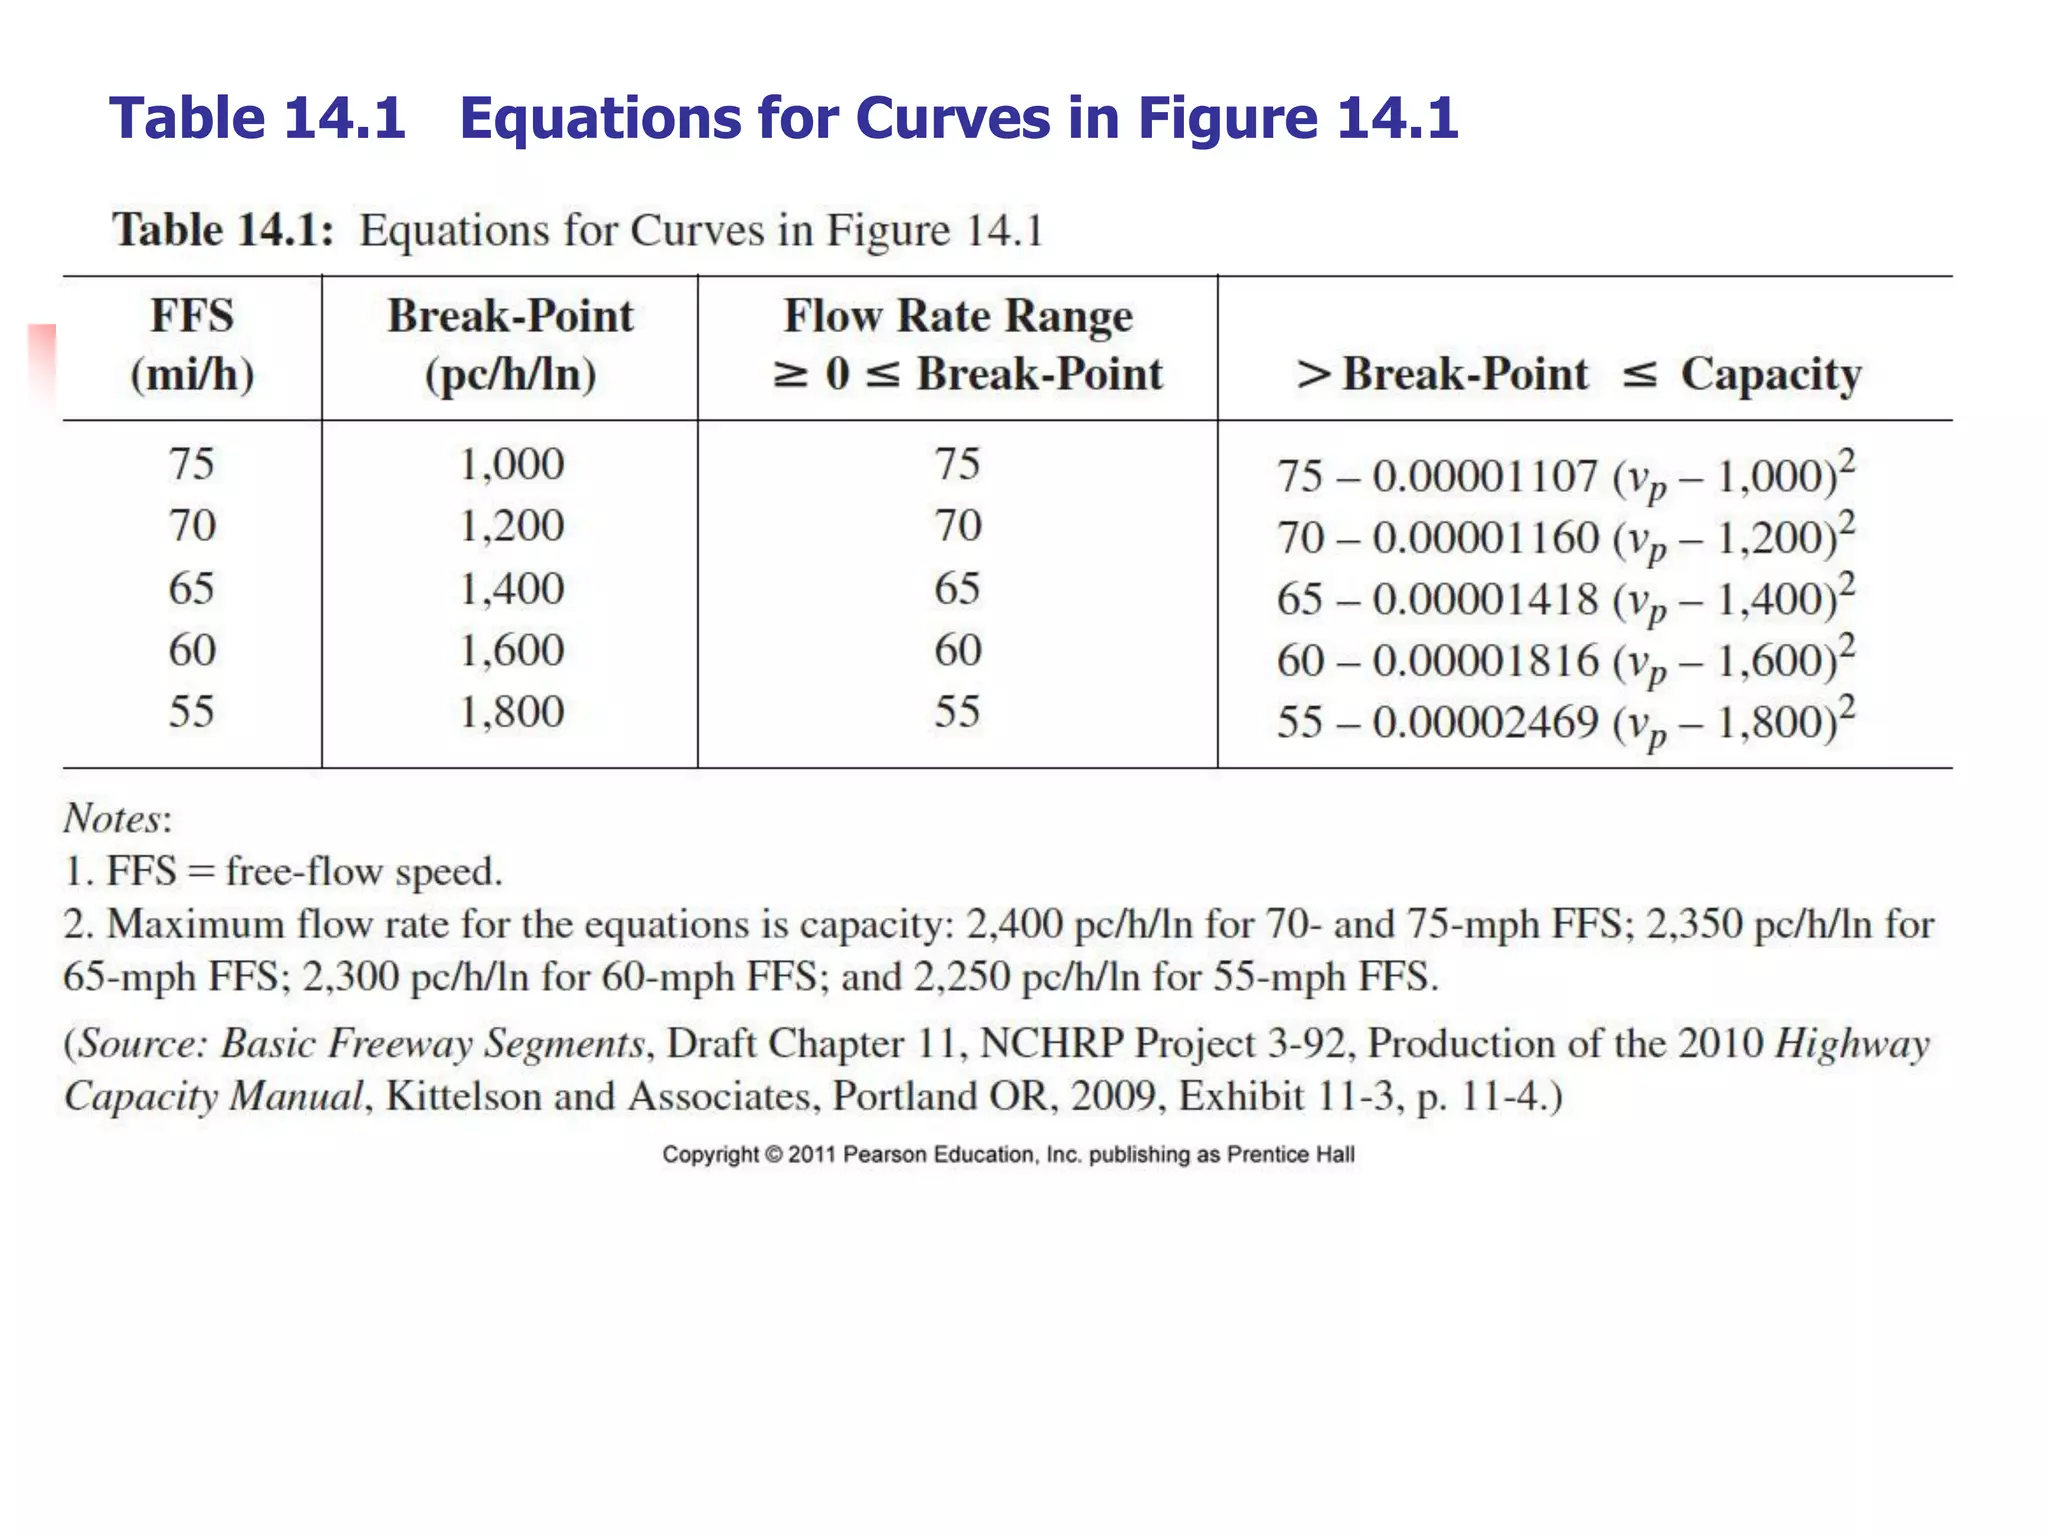
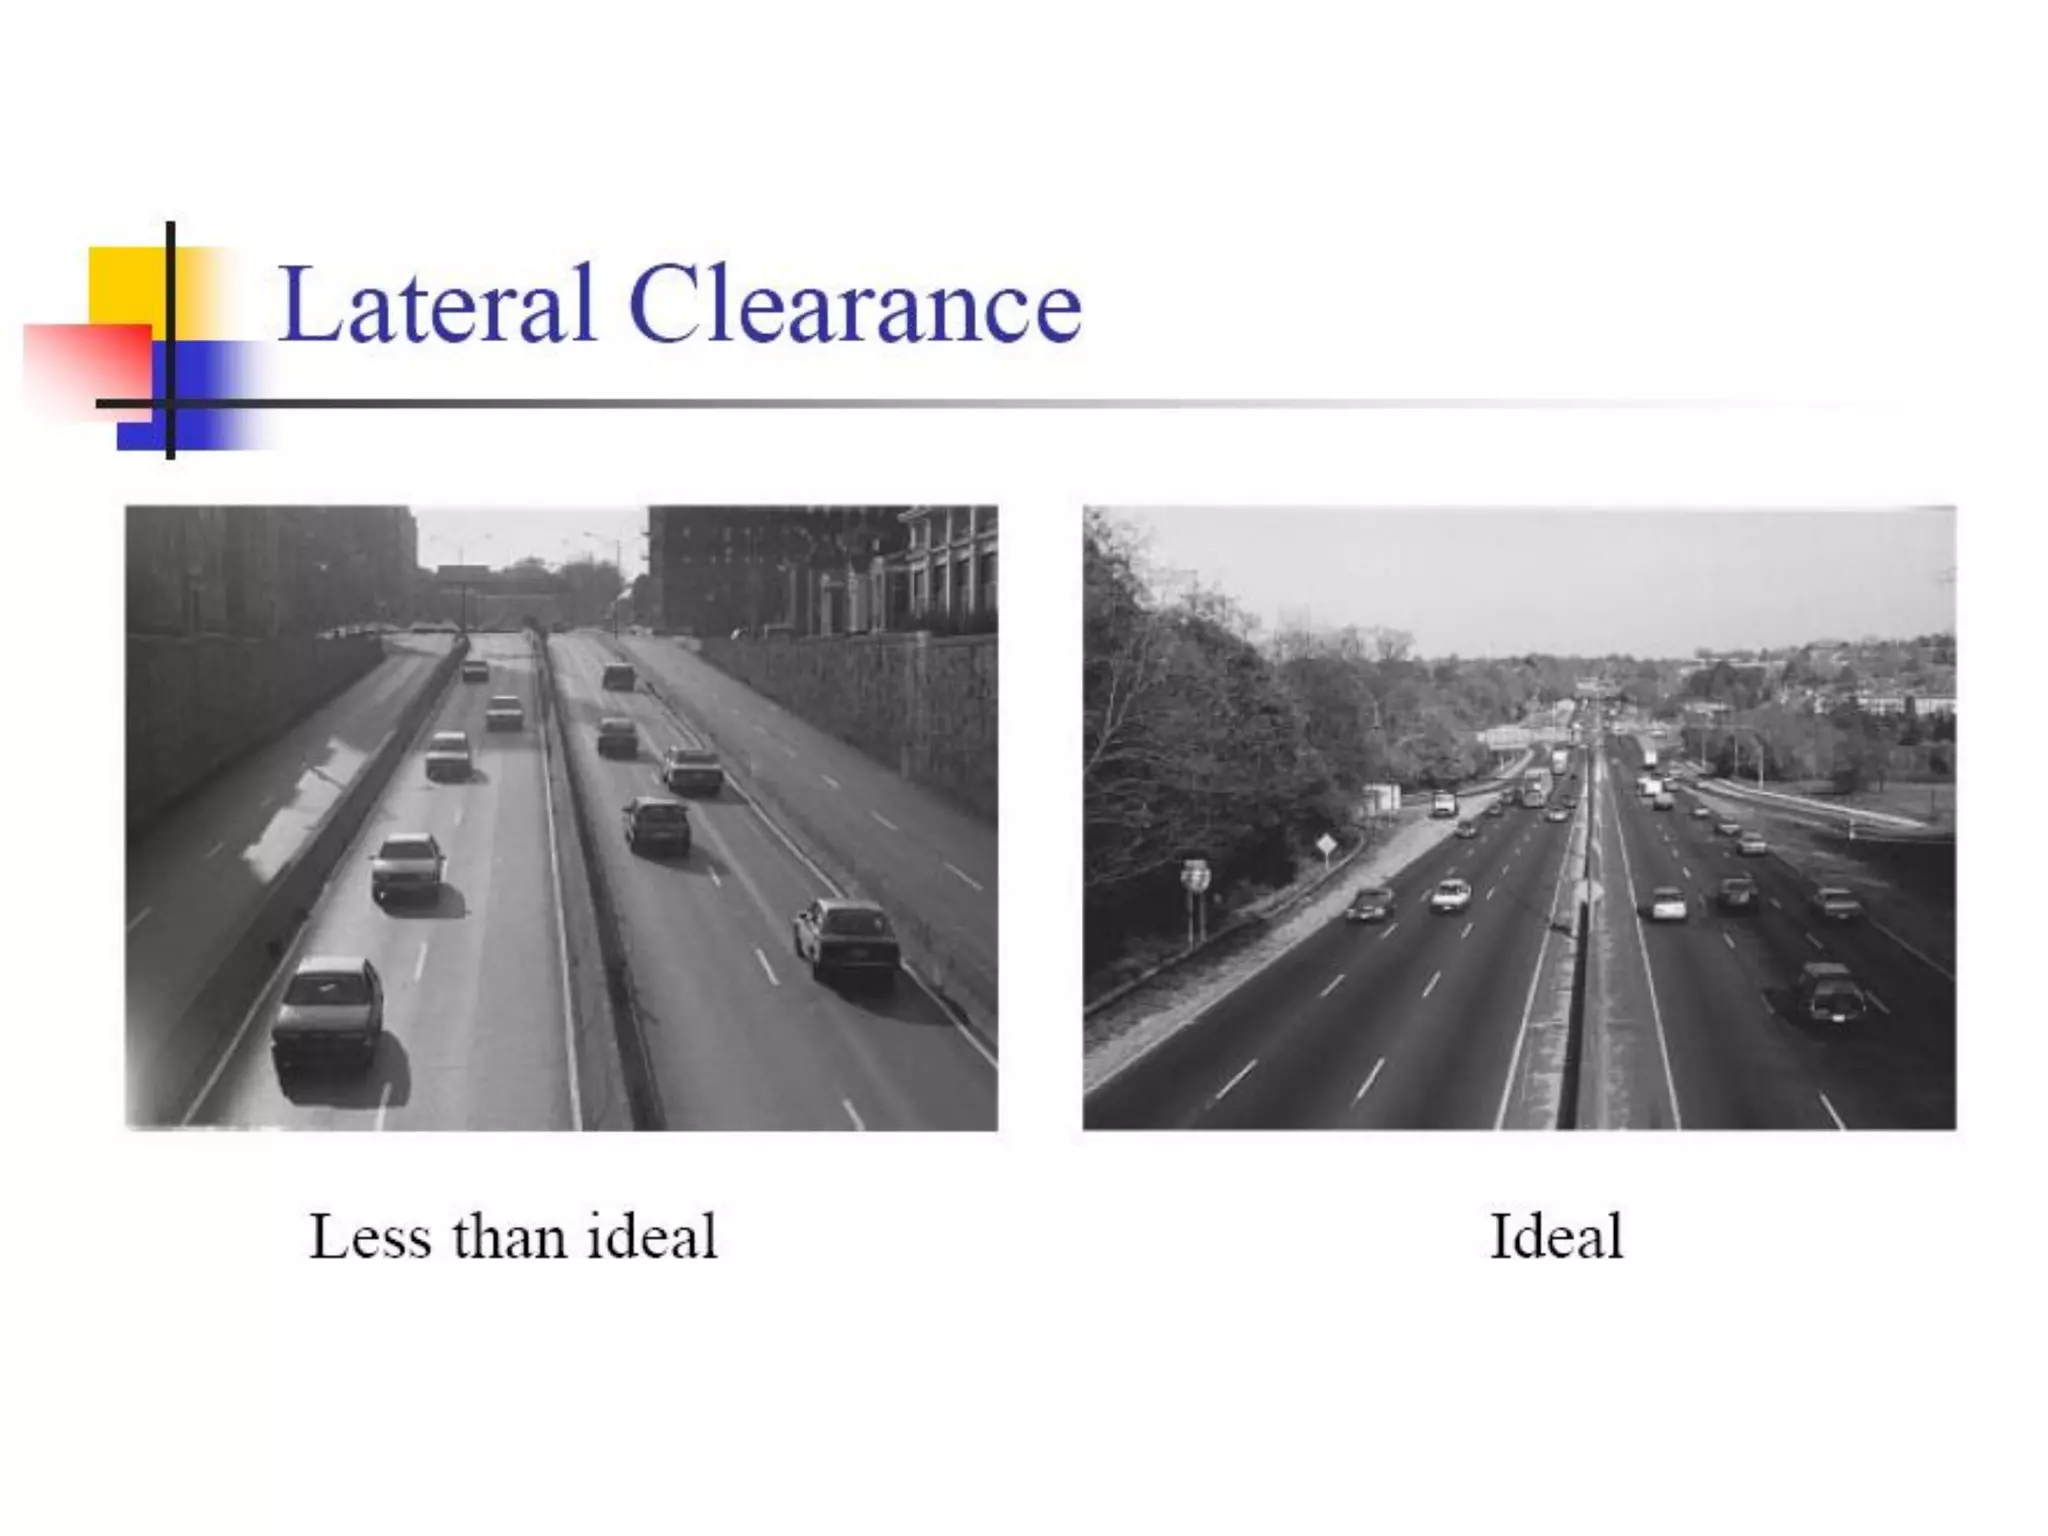
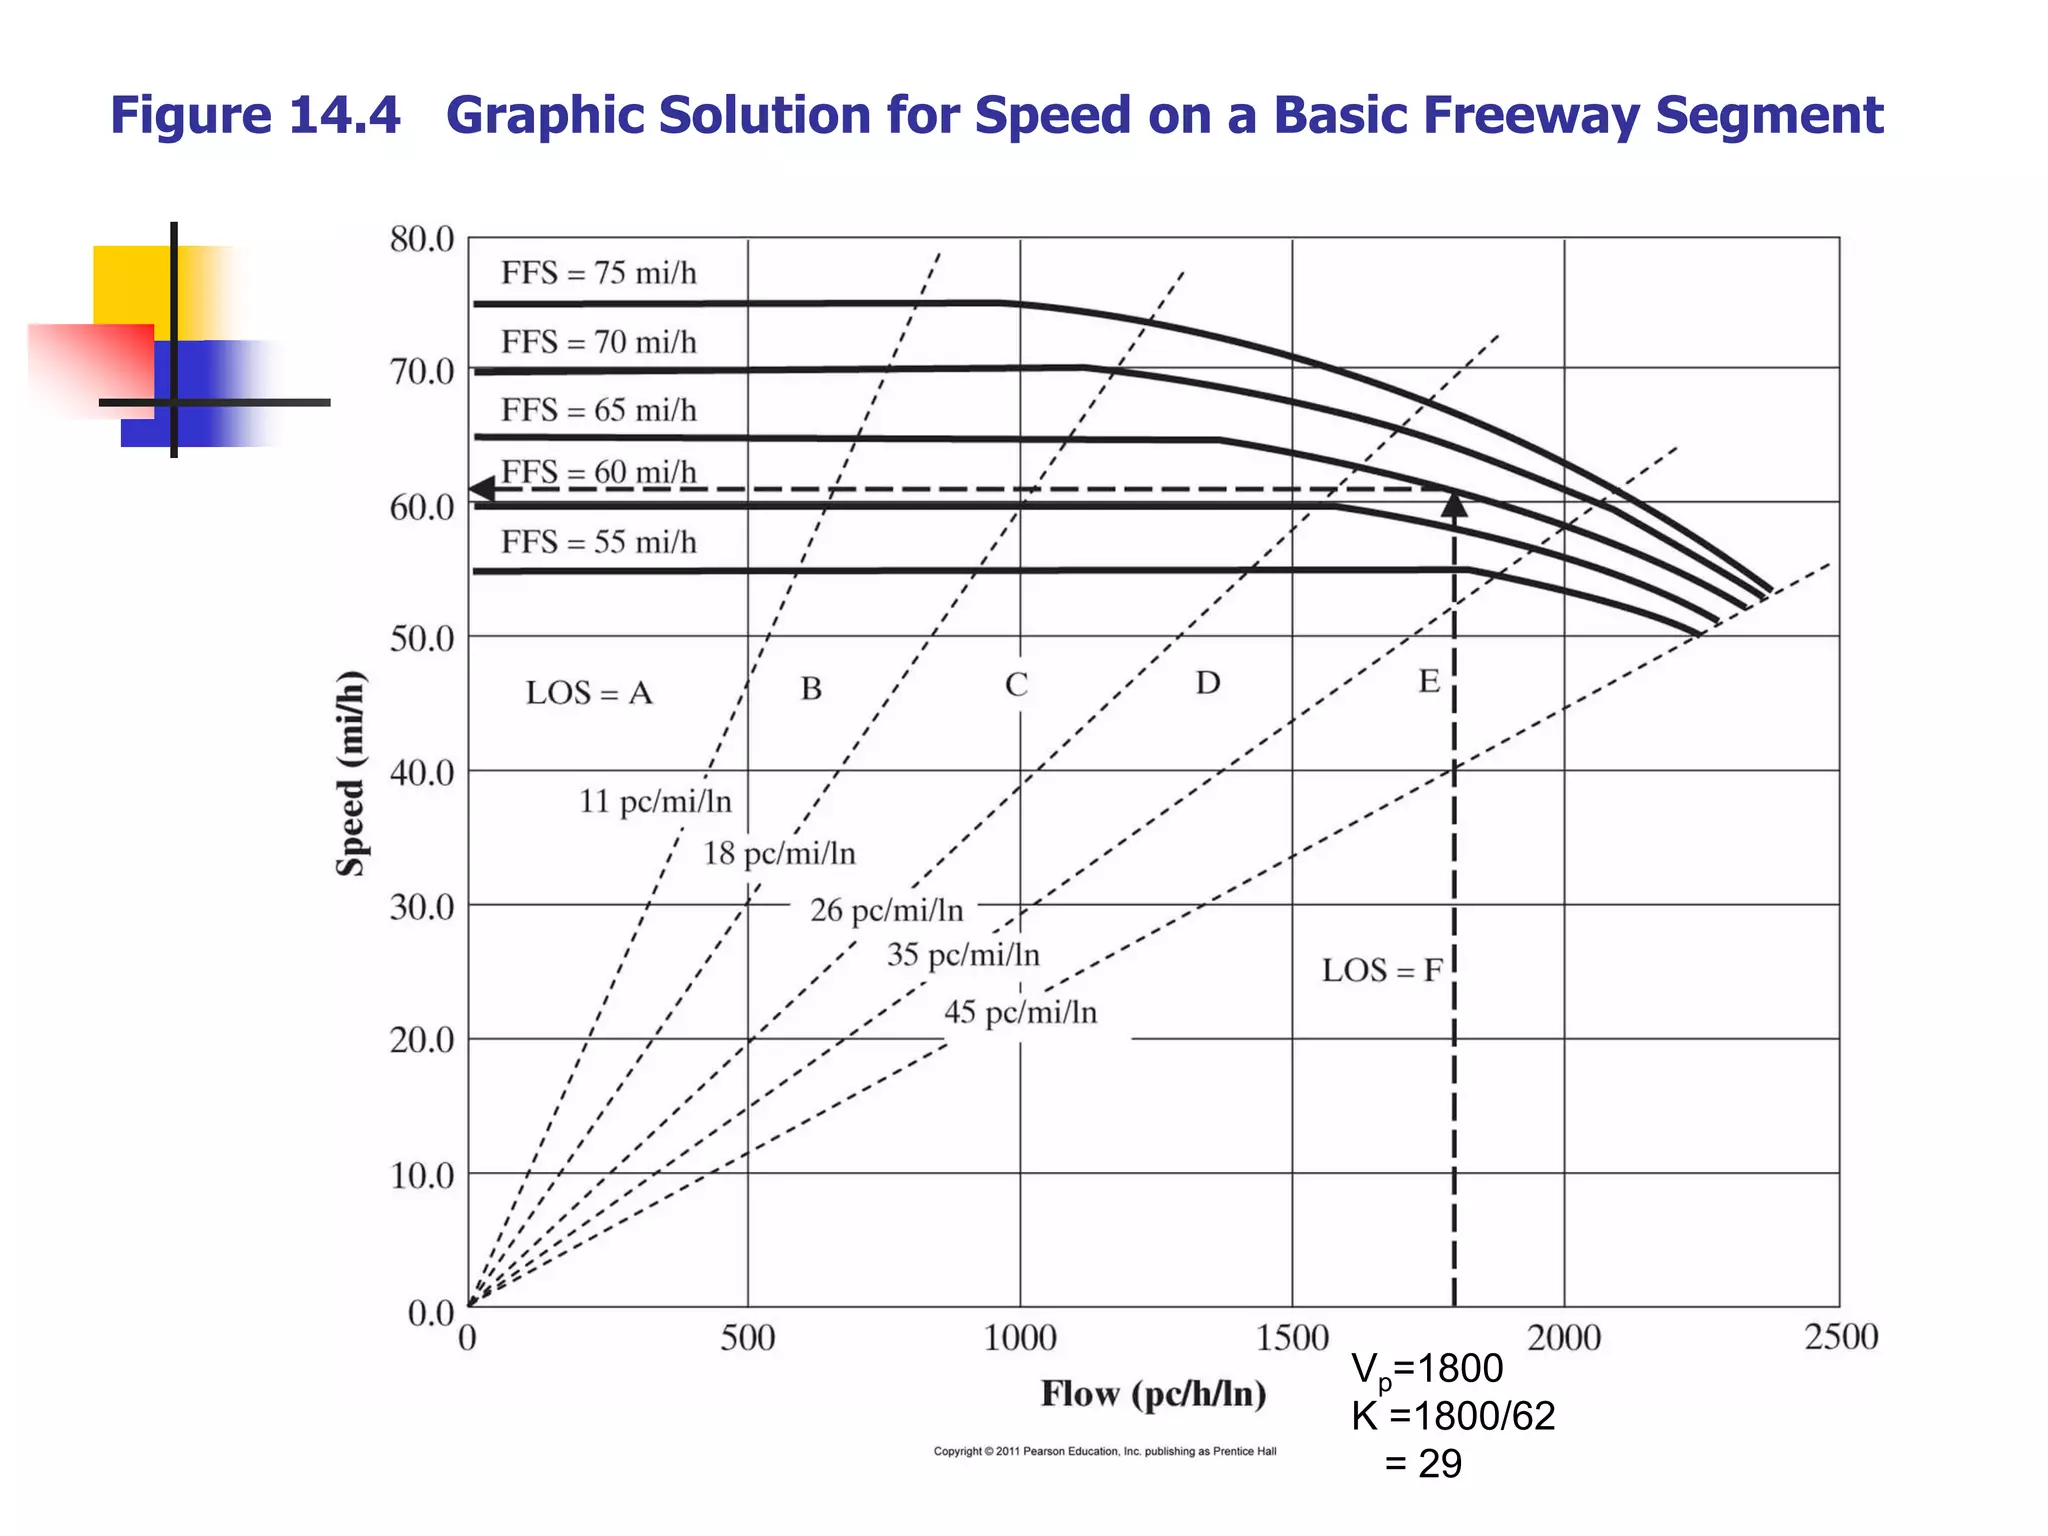
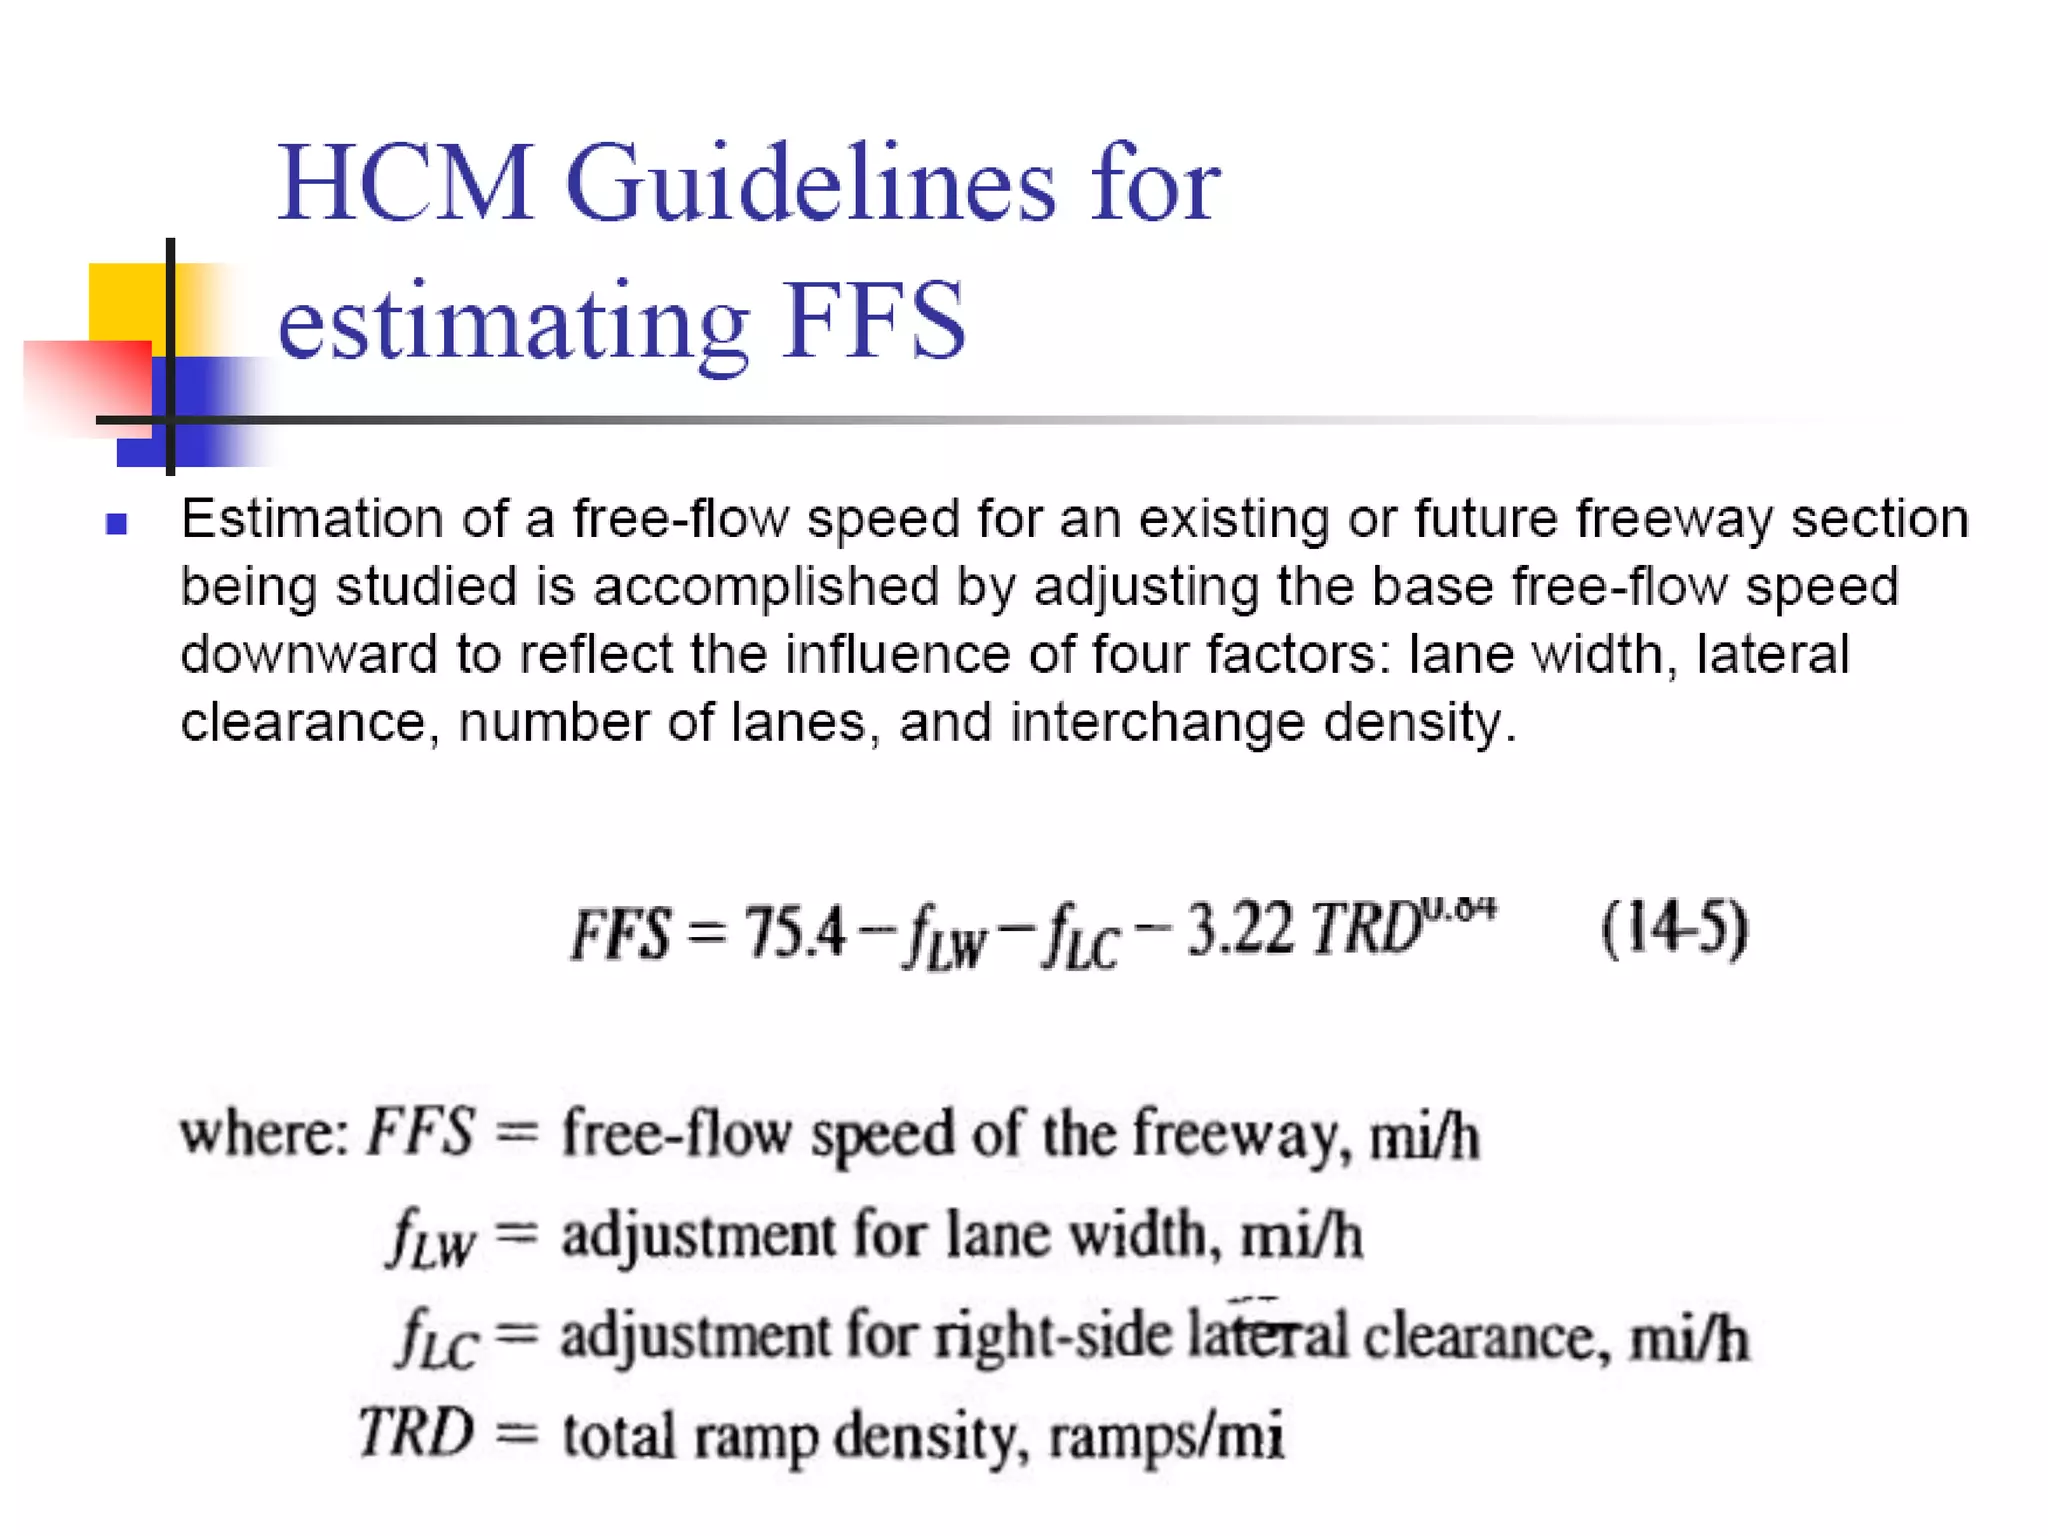
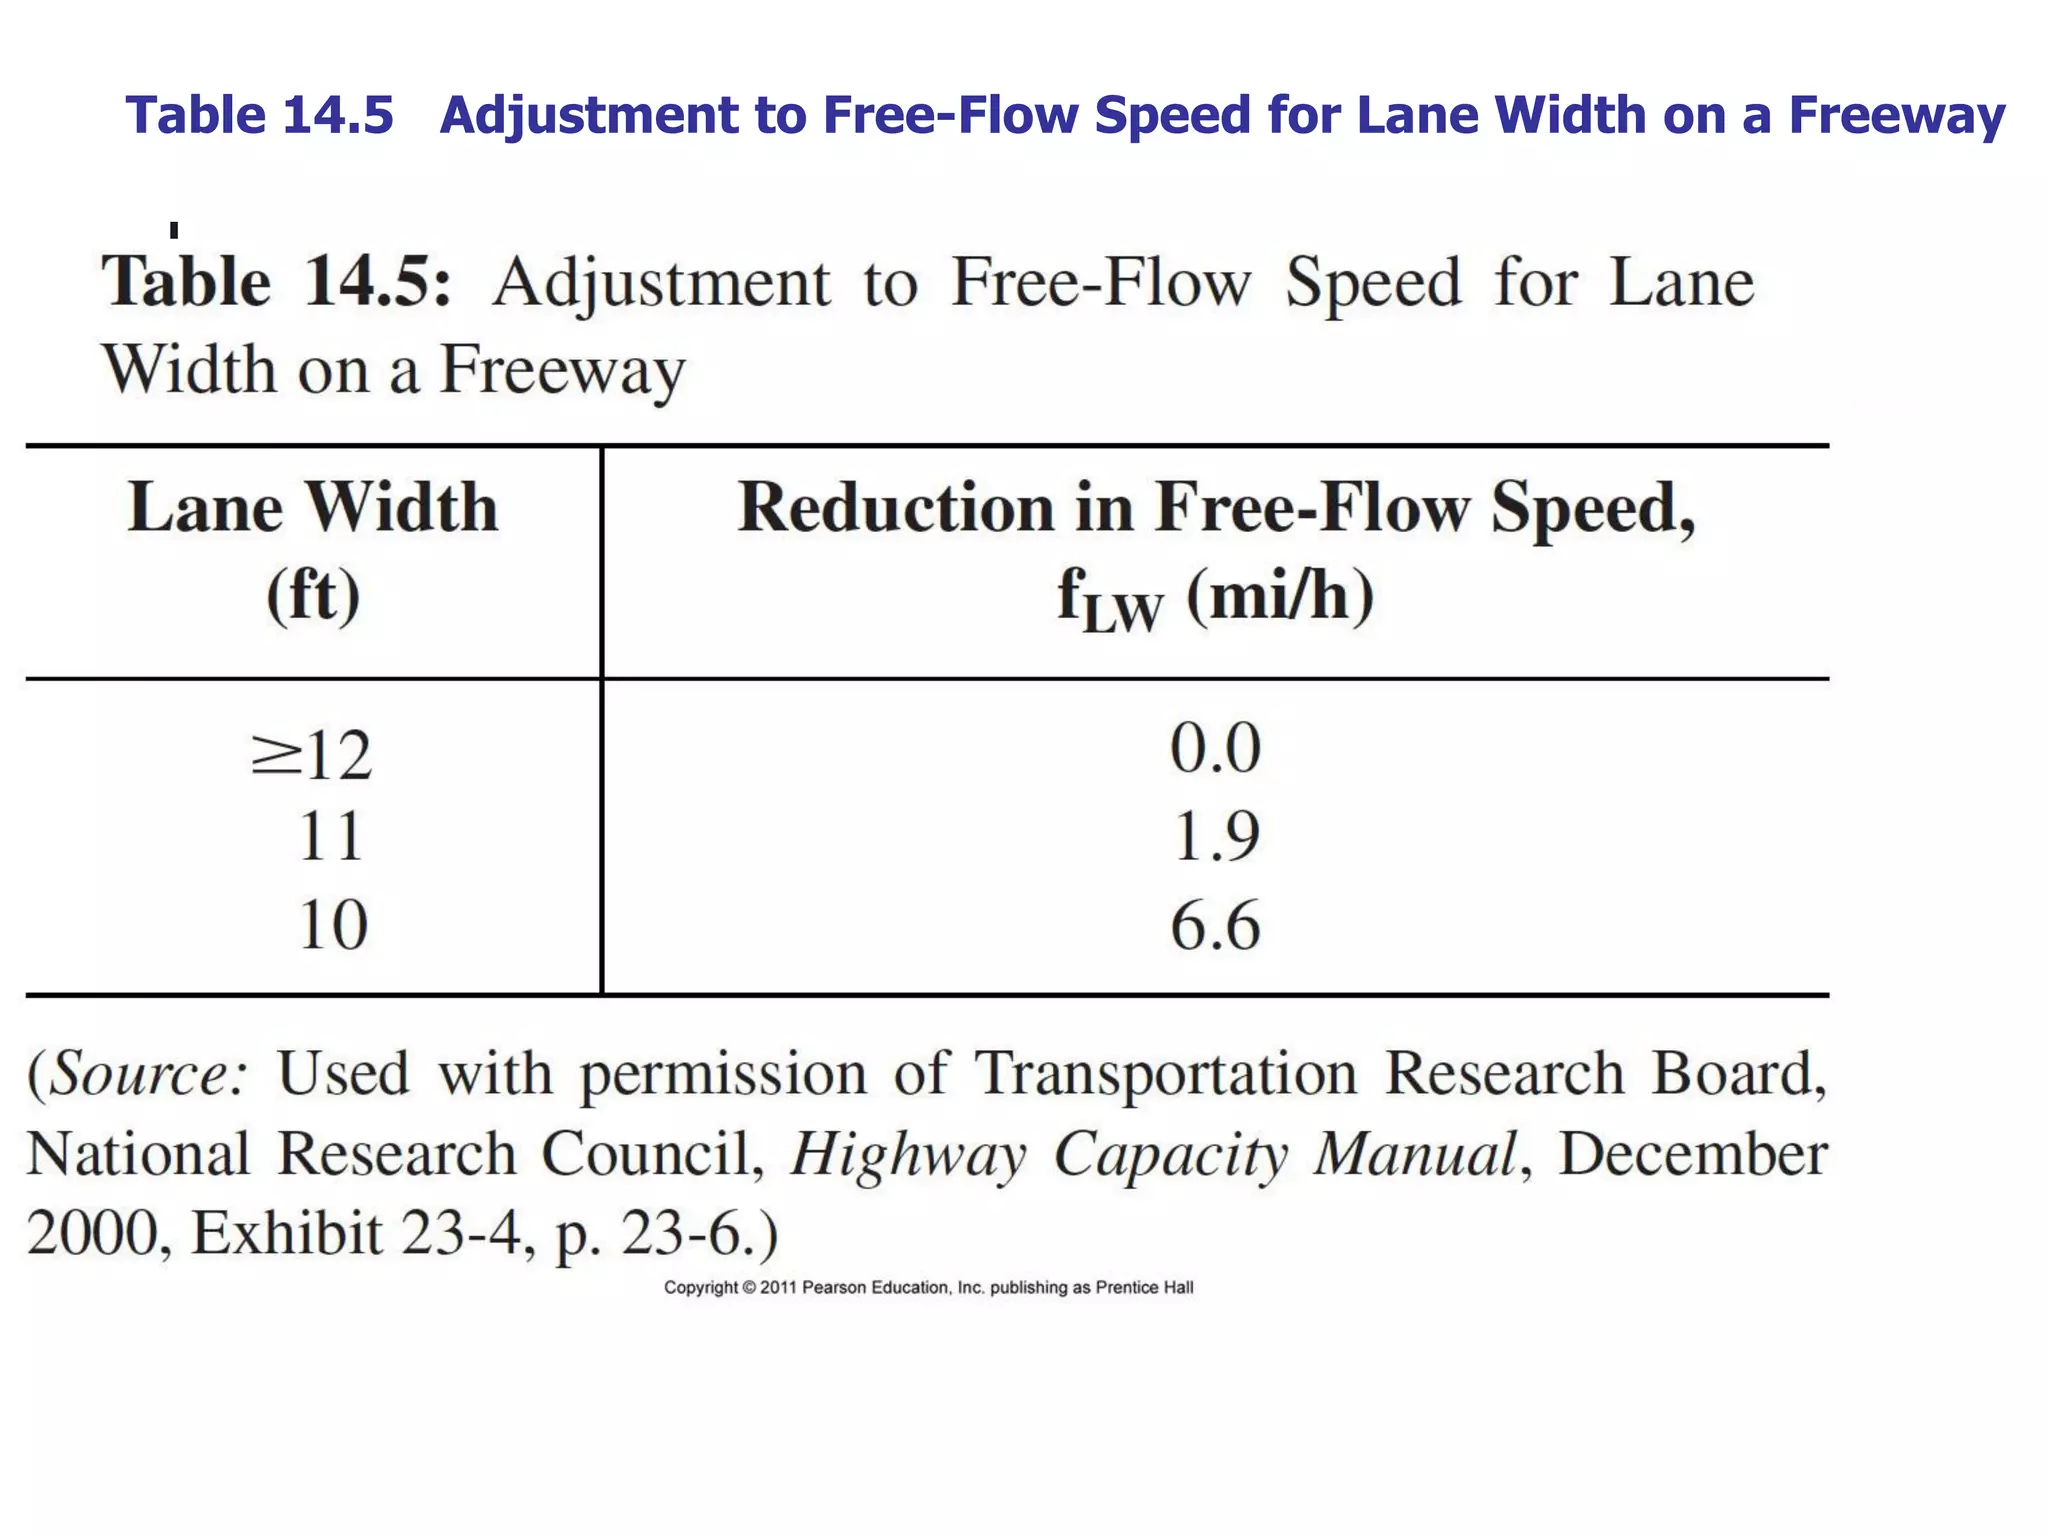
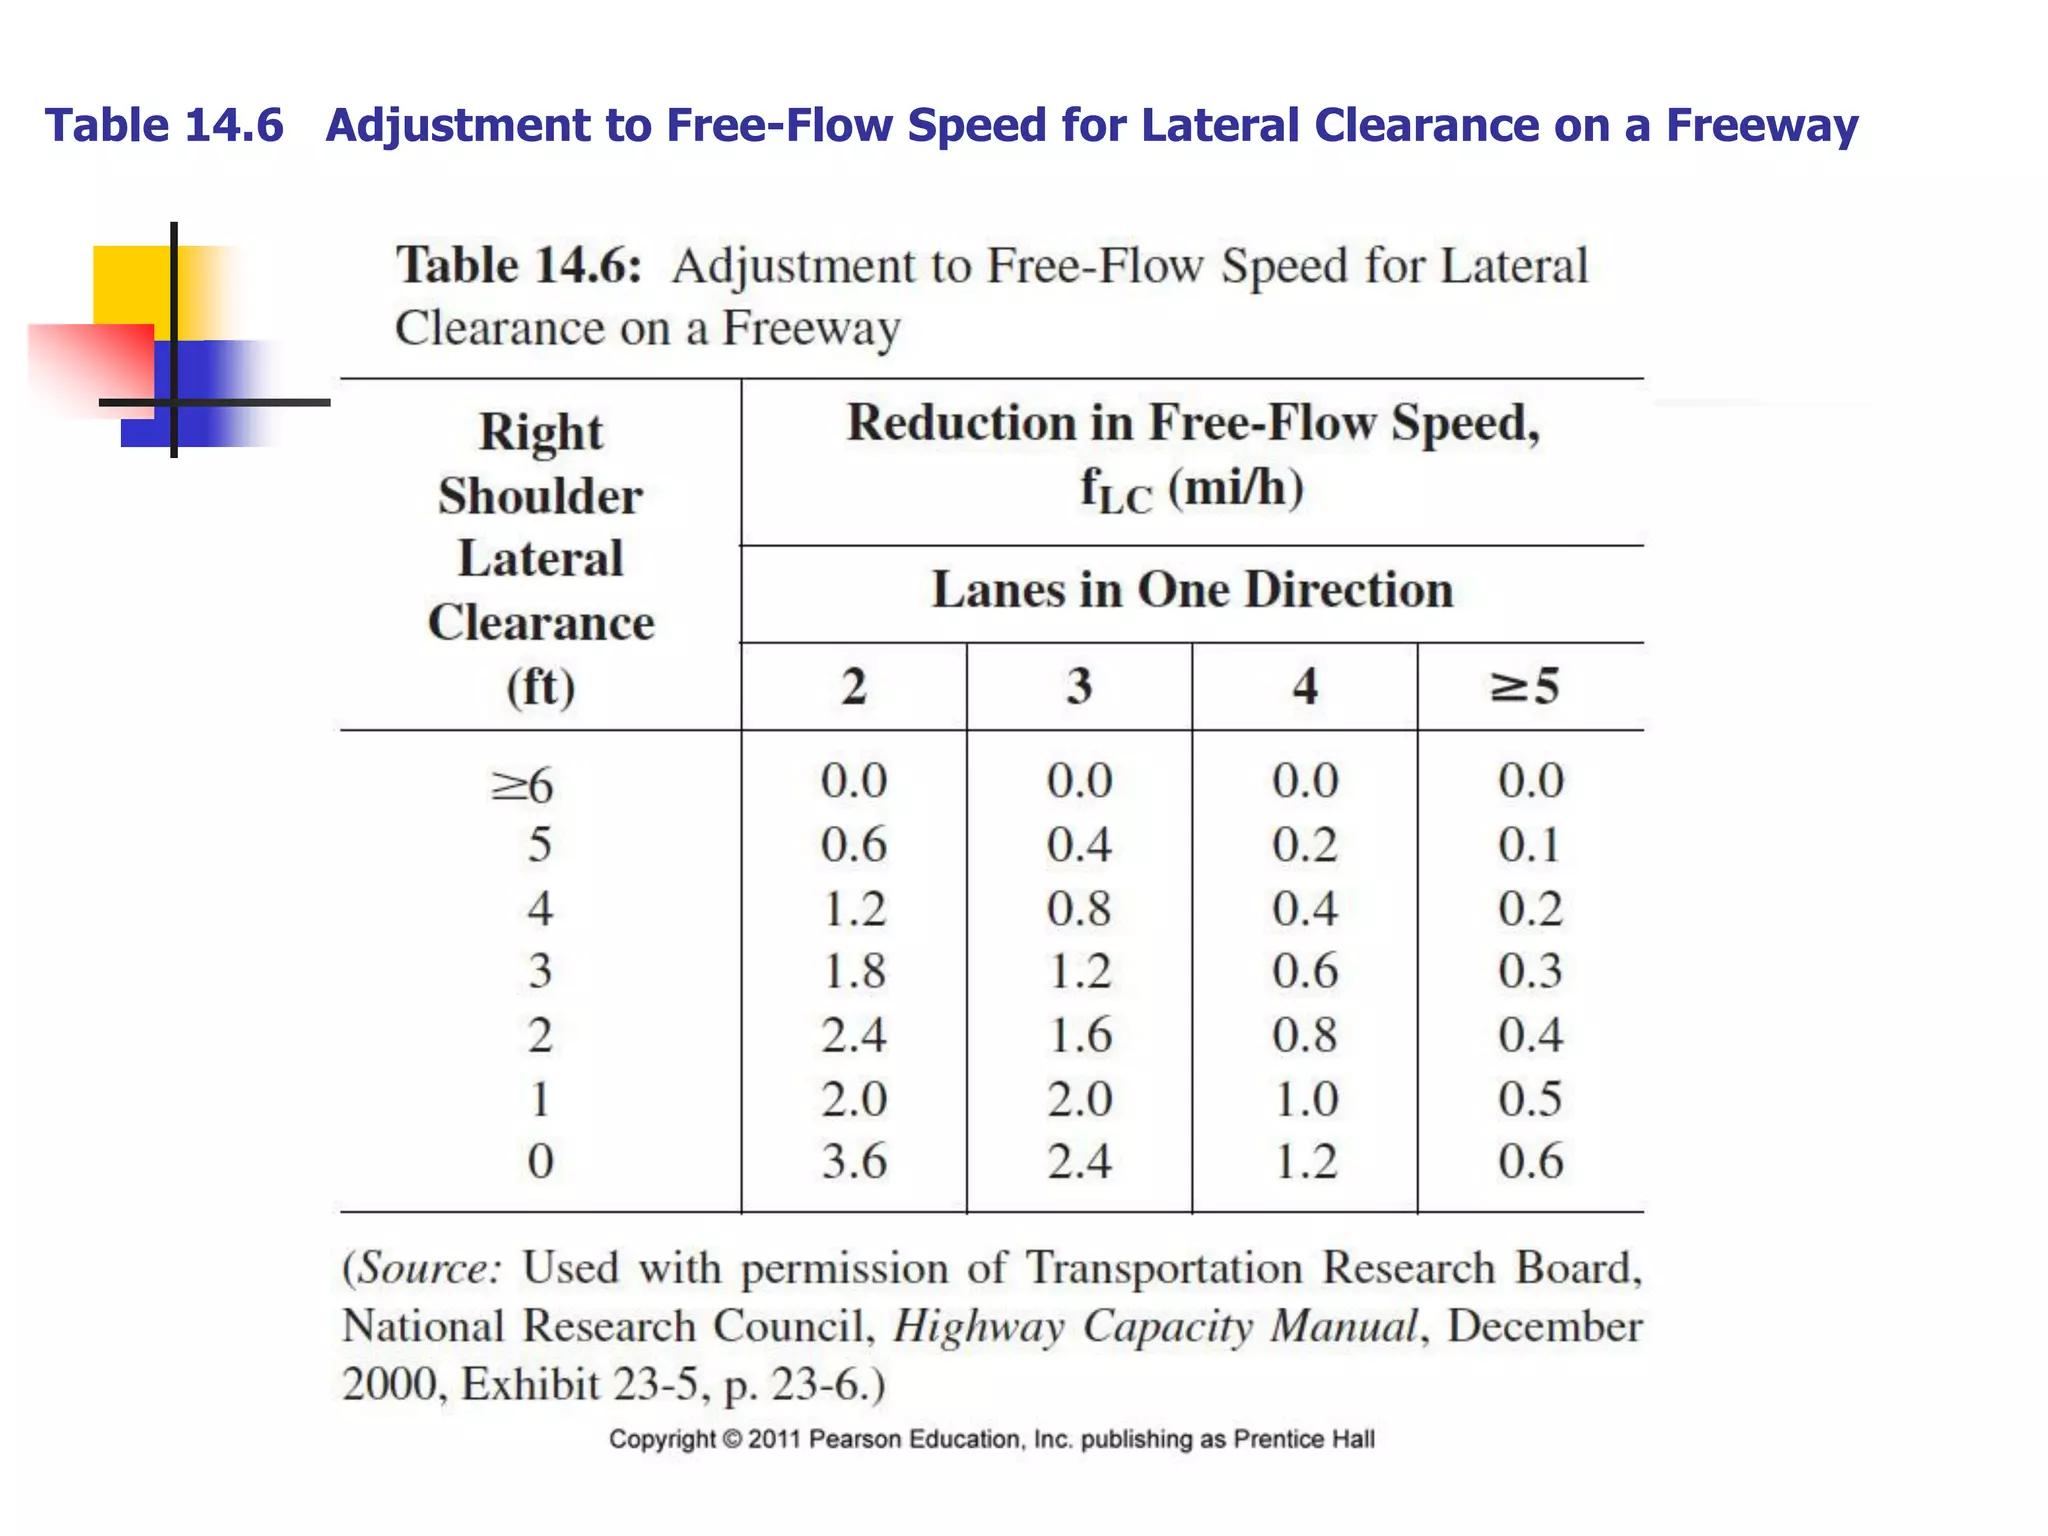
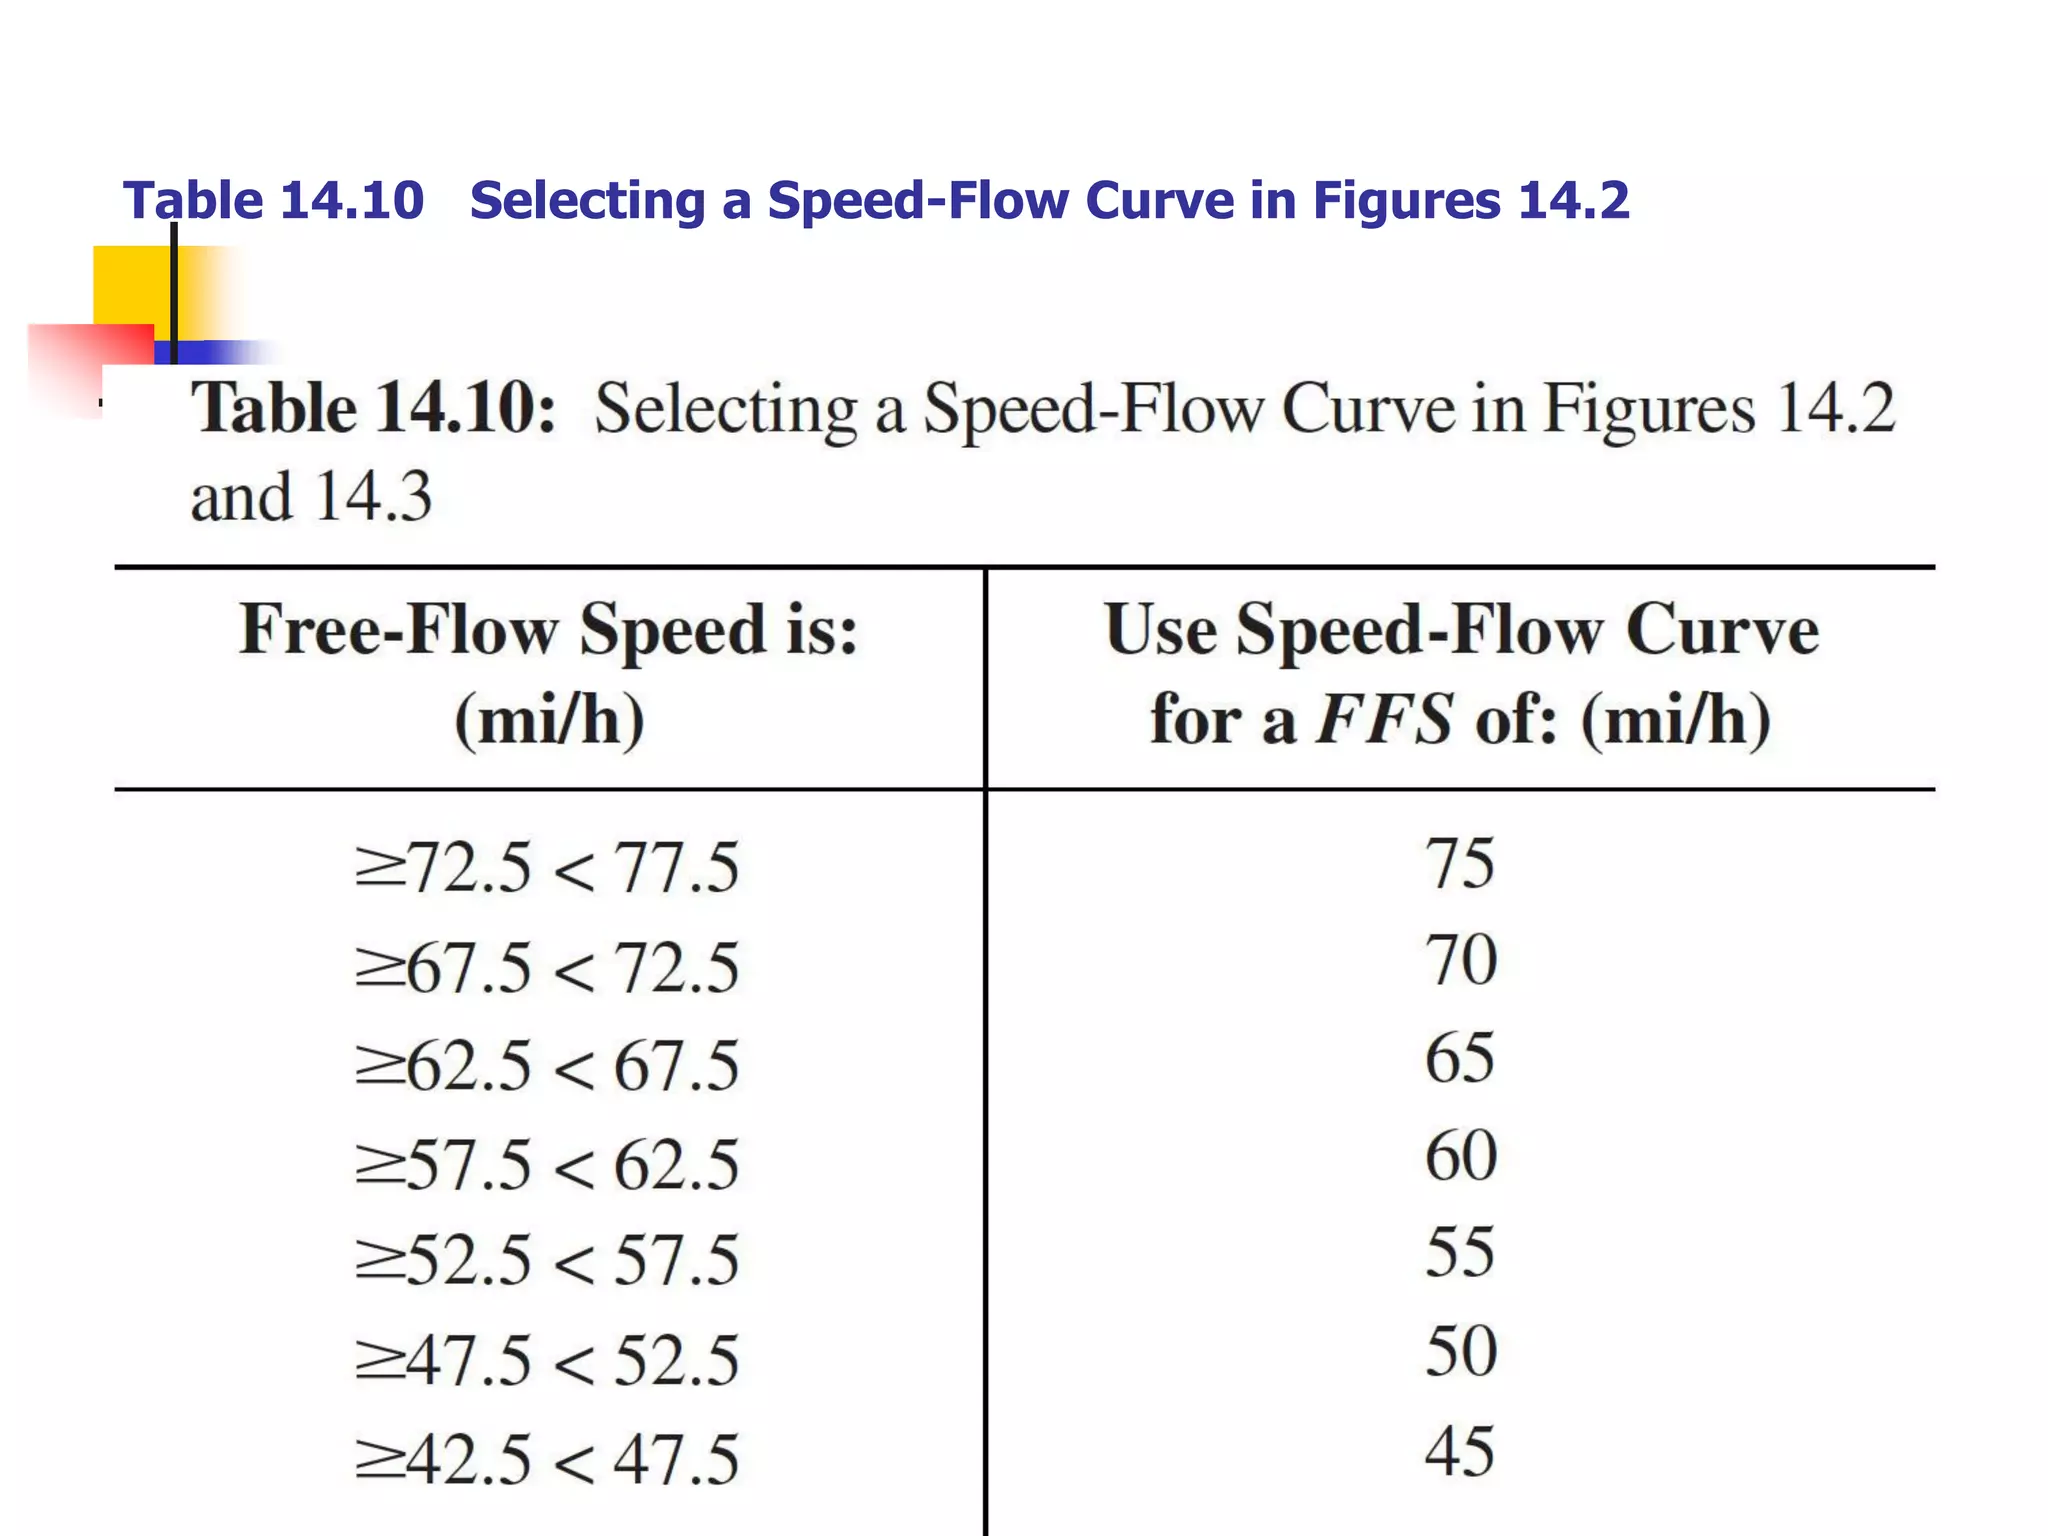
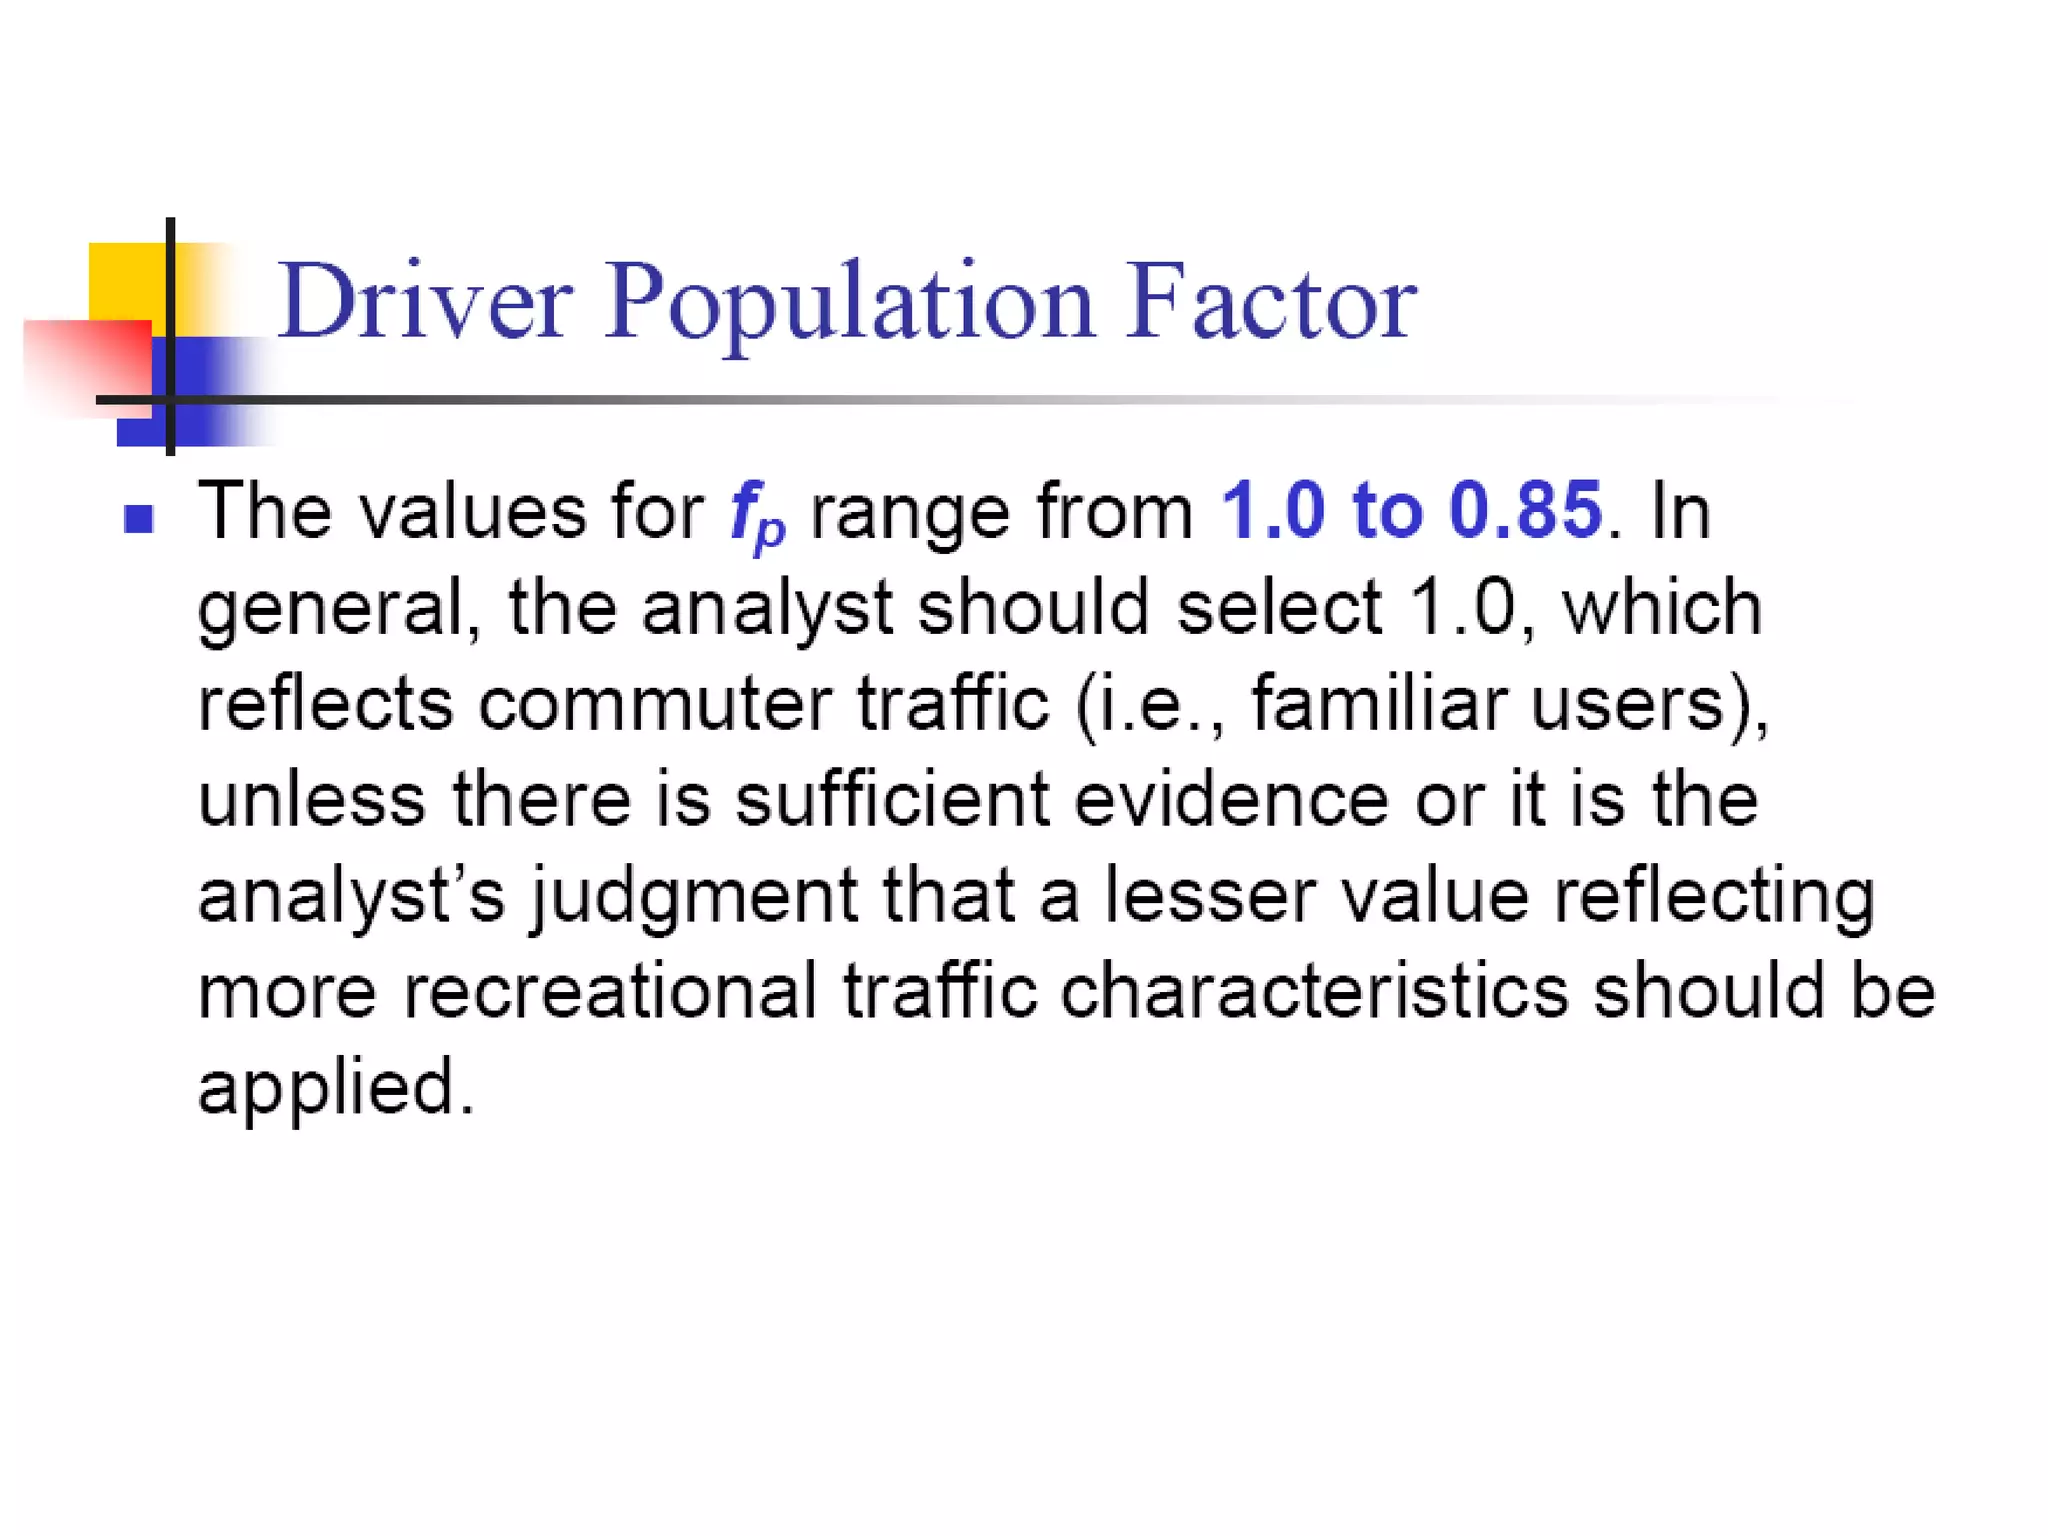
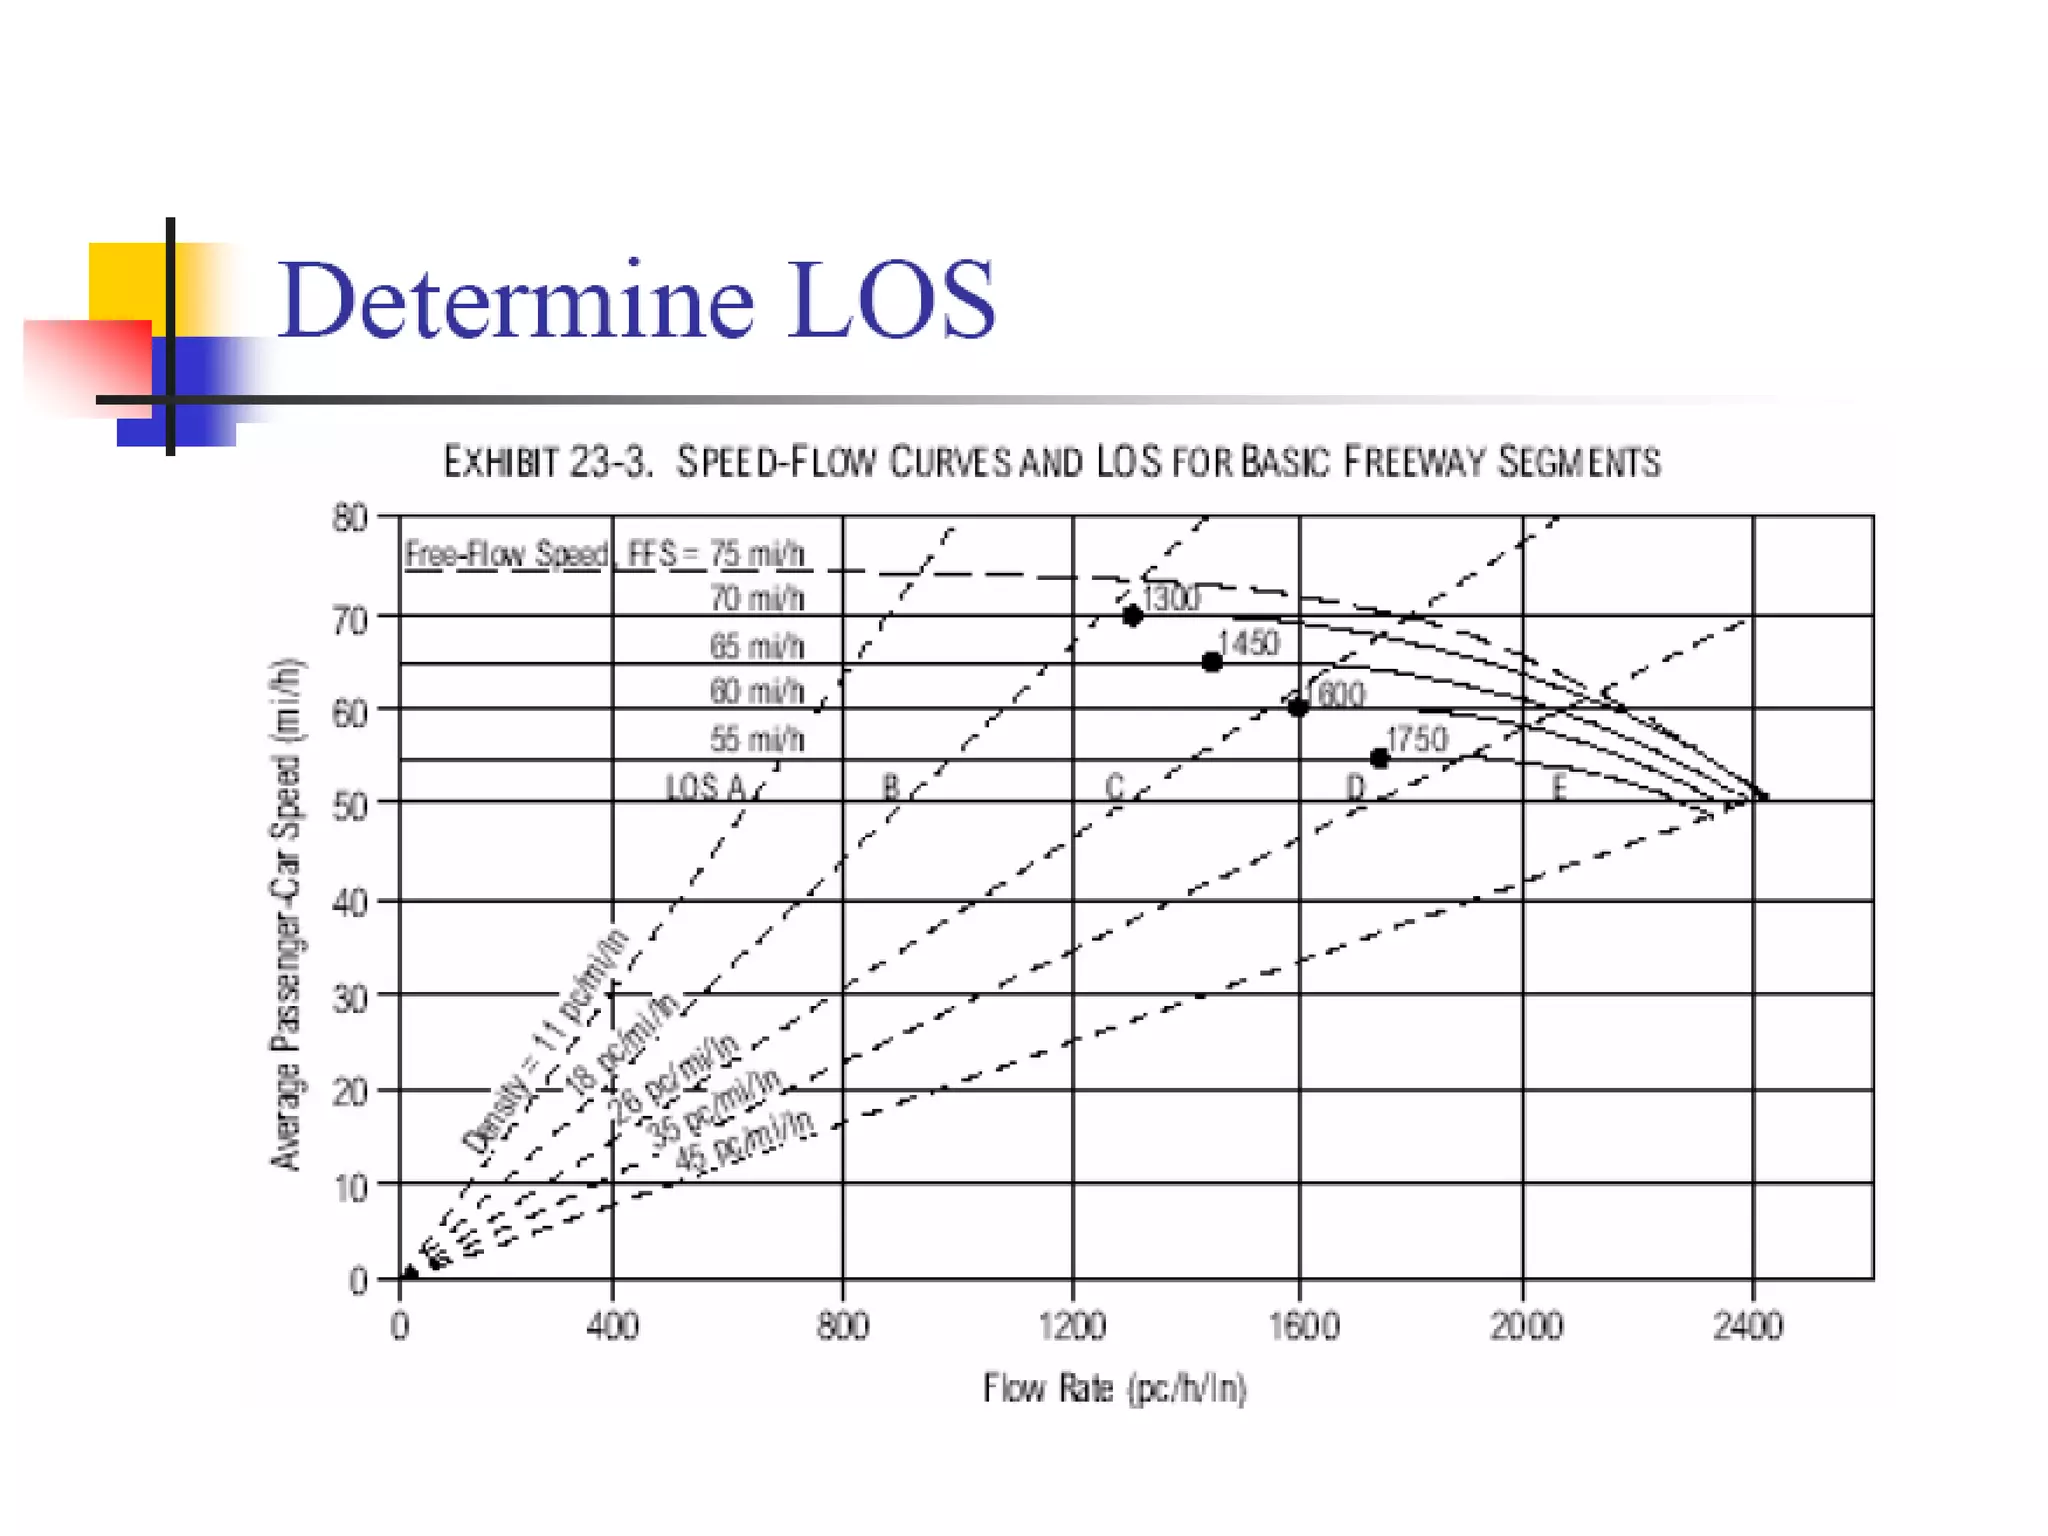
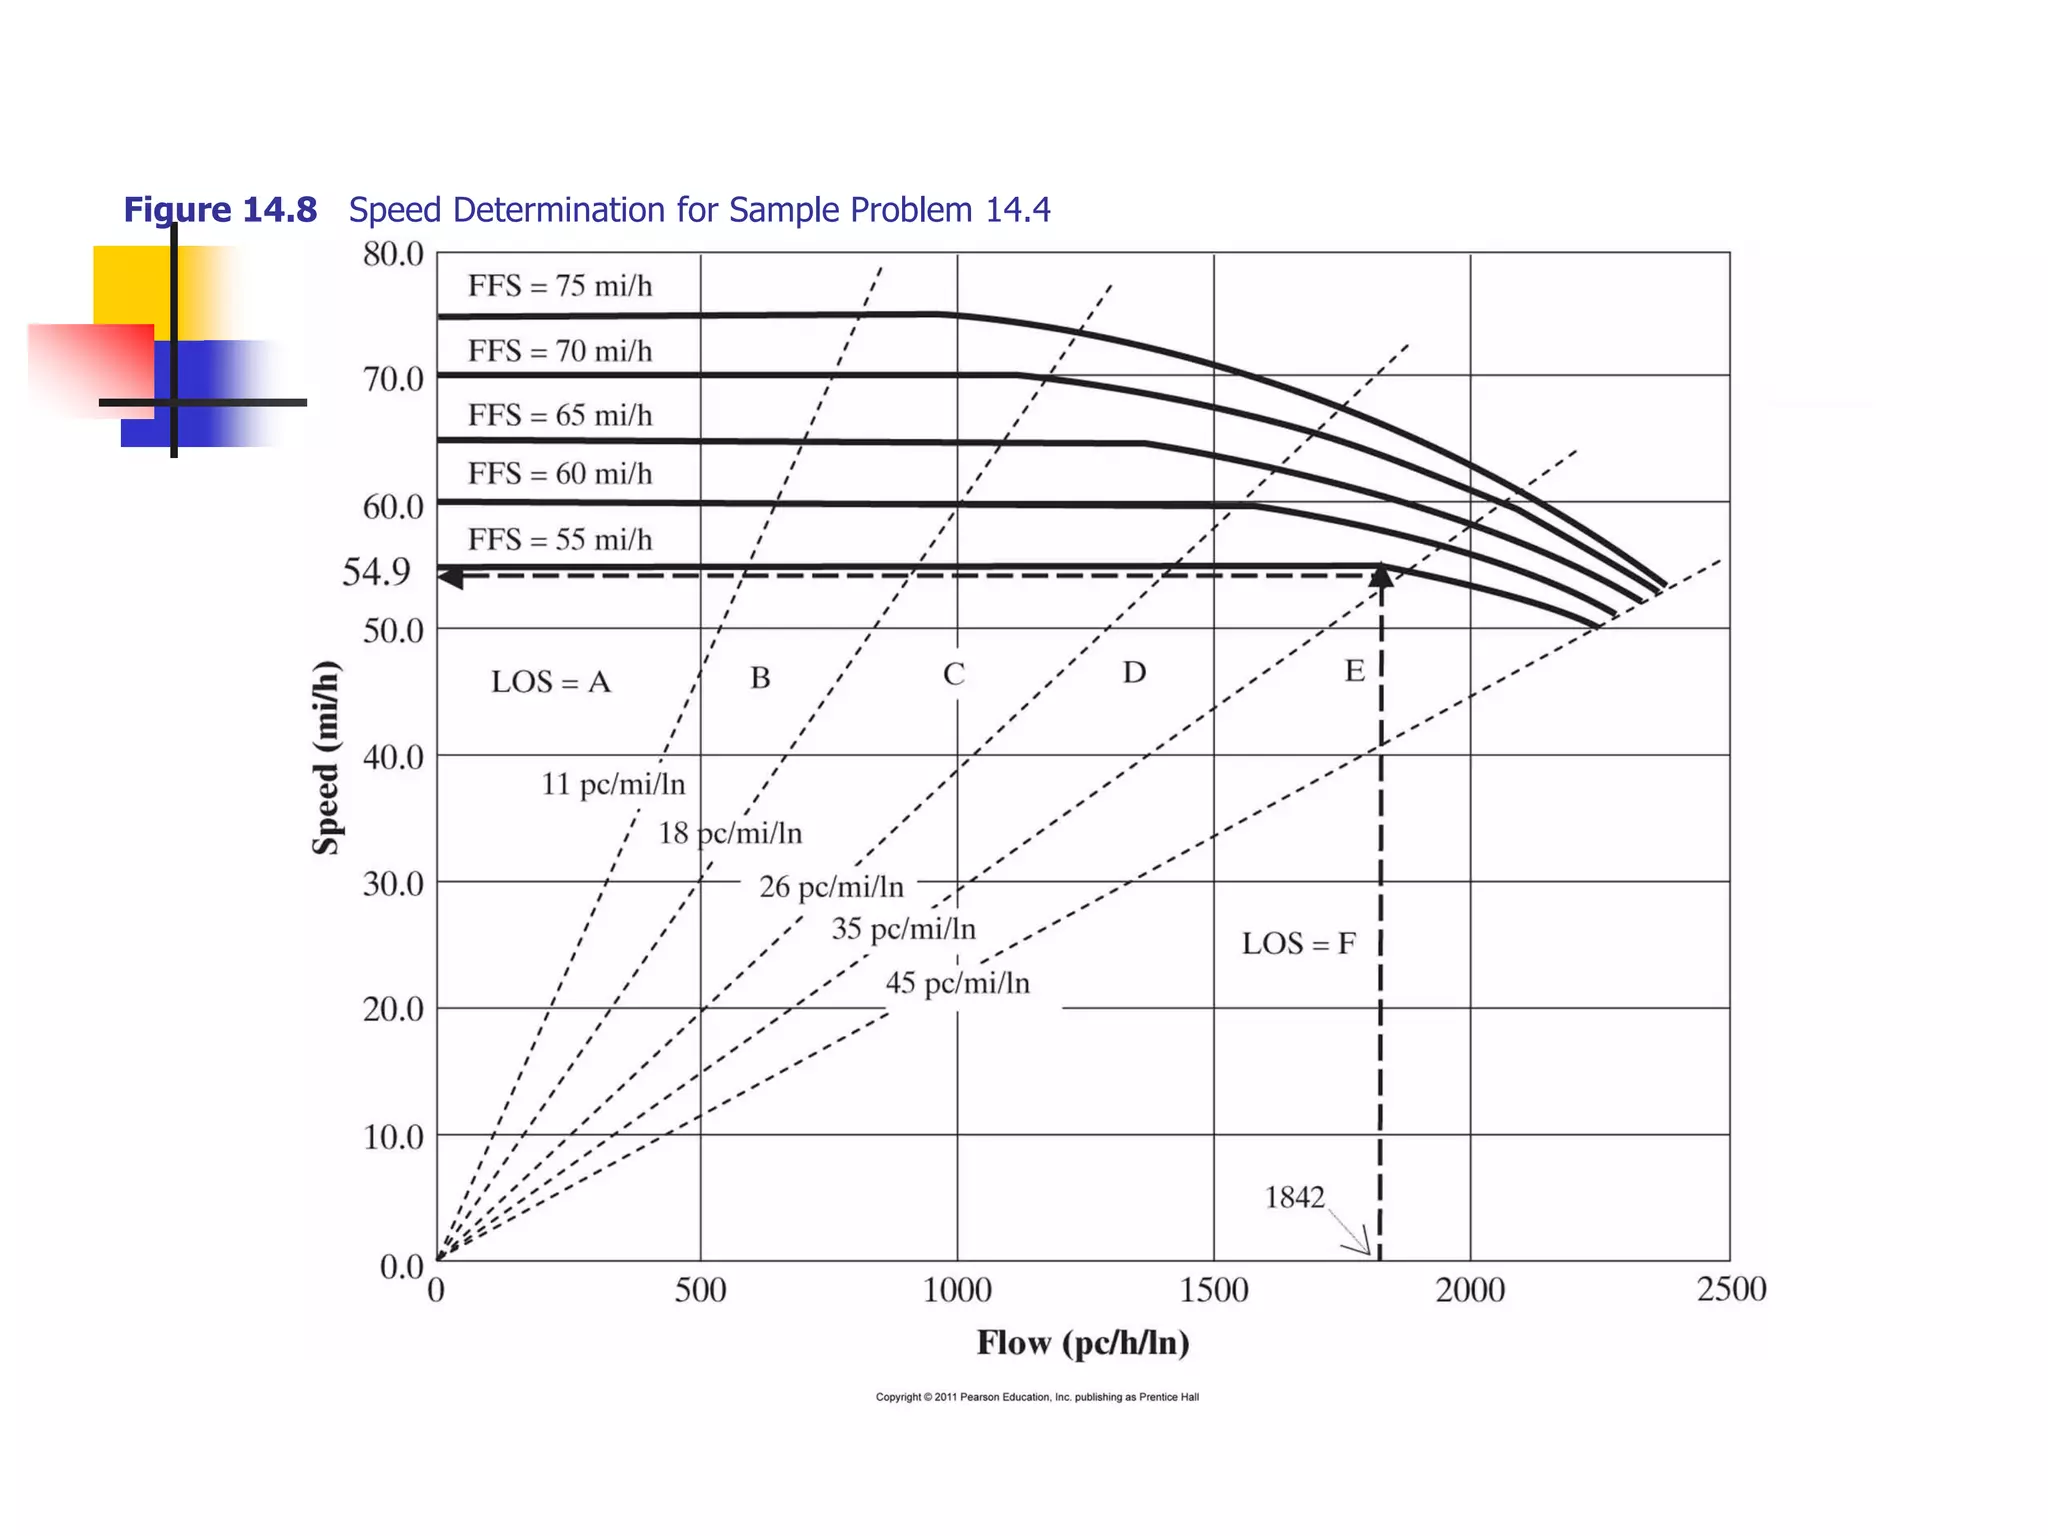
Graphic solutions, curves for speed-flow relationships, and adjustments for various conditions in traffic.
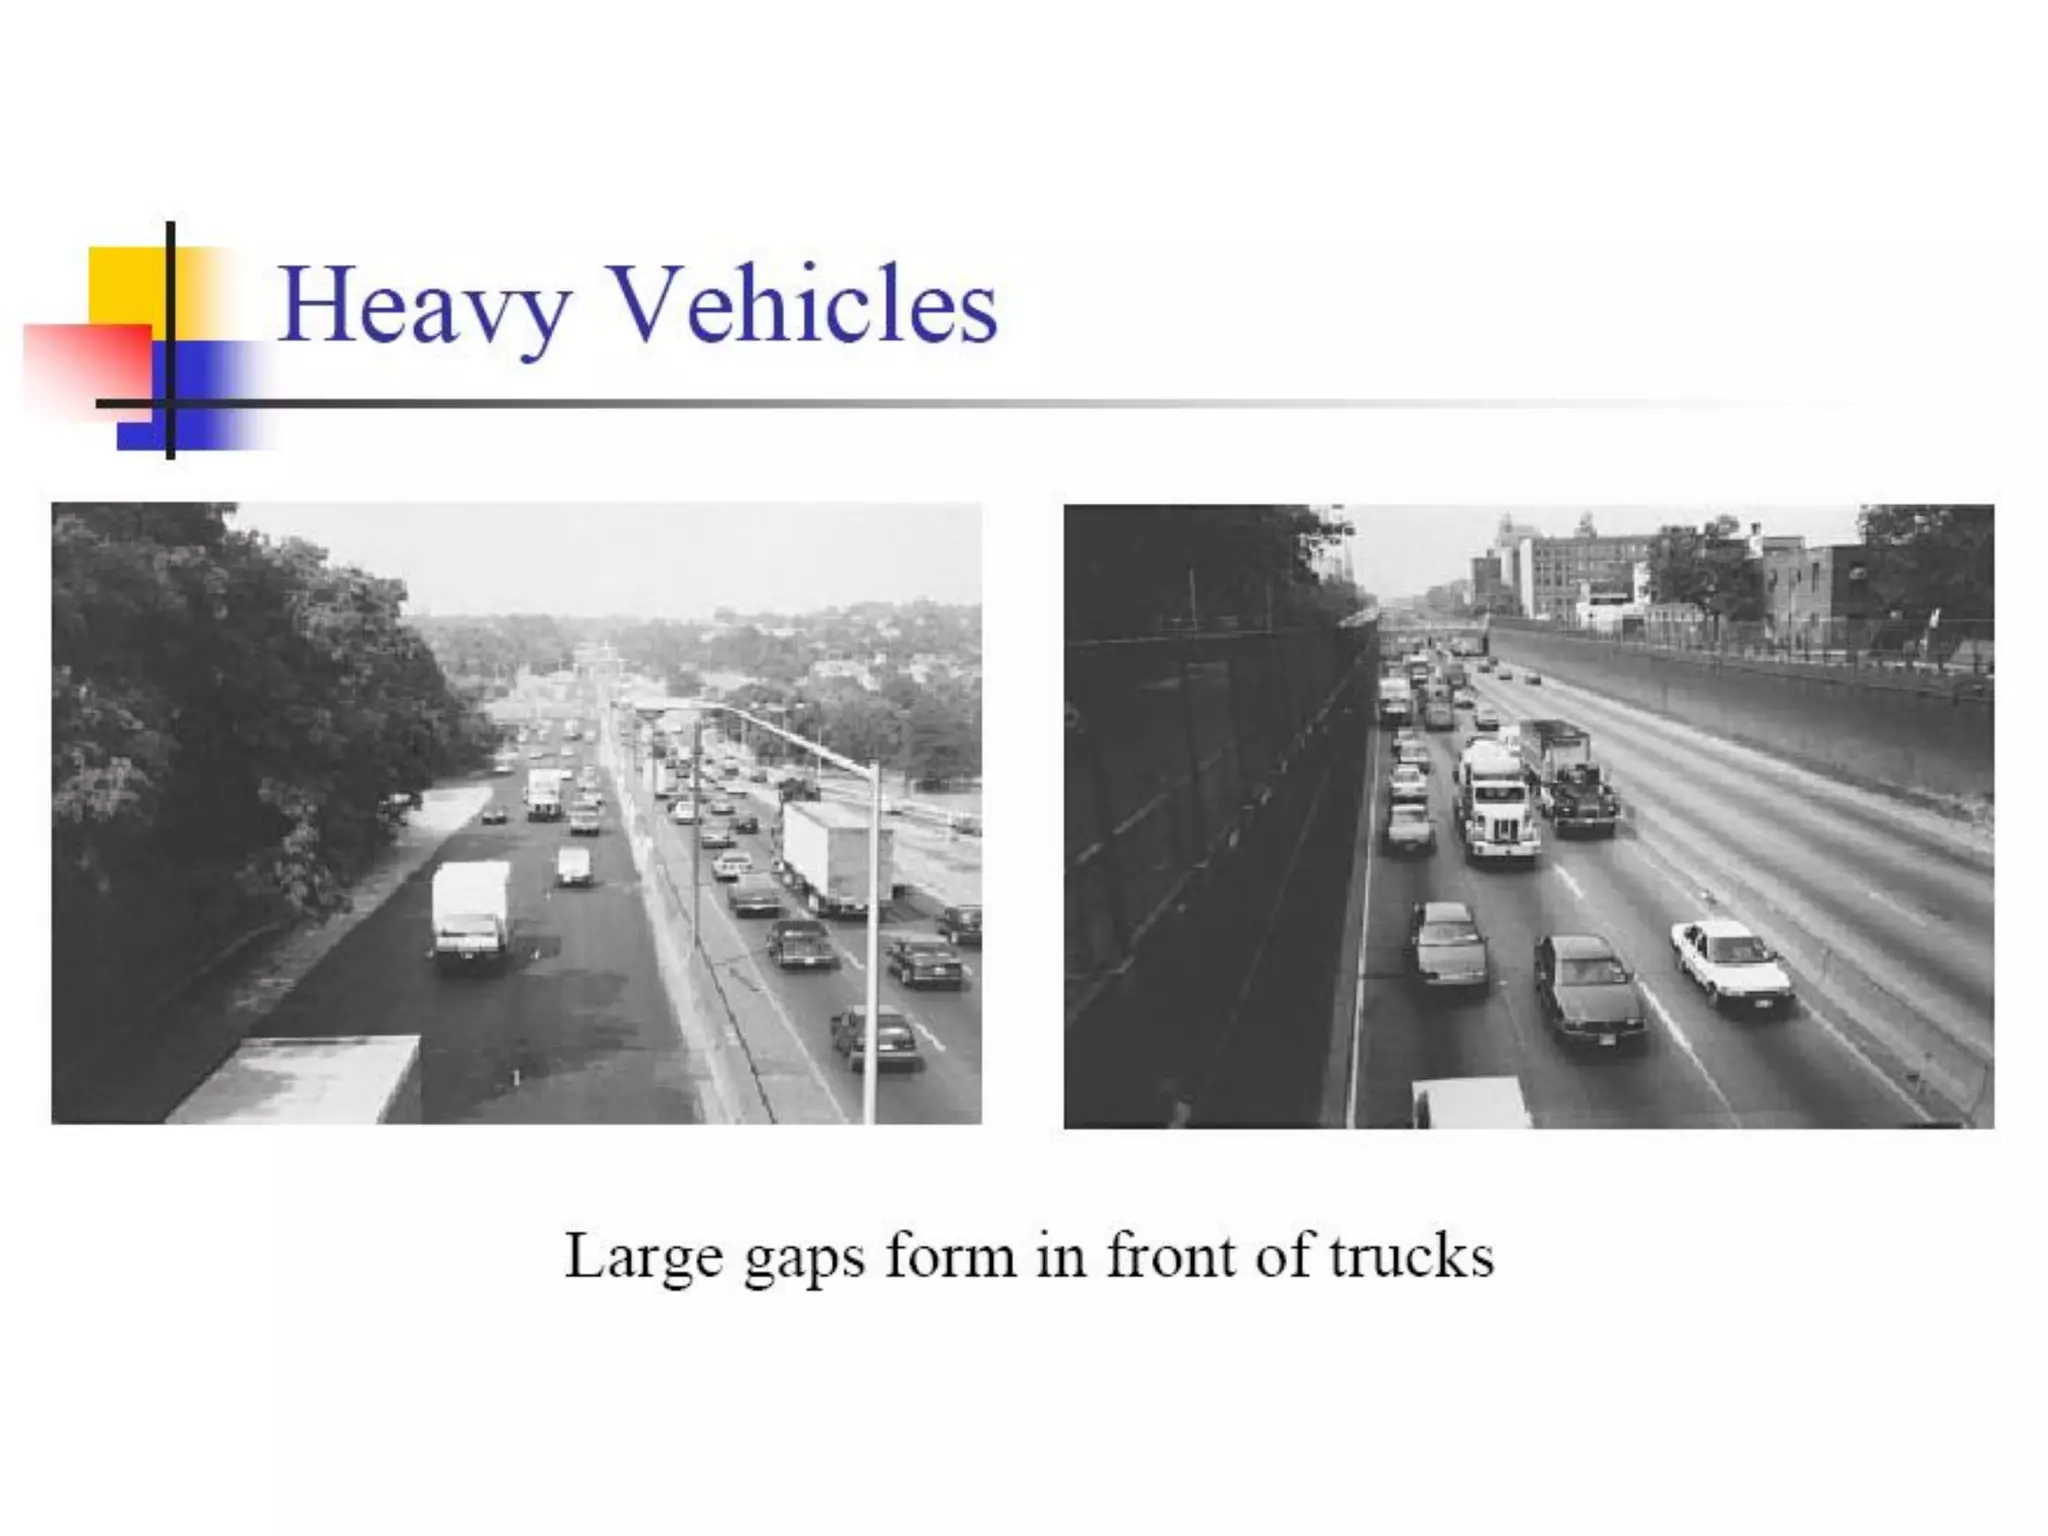
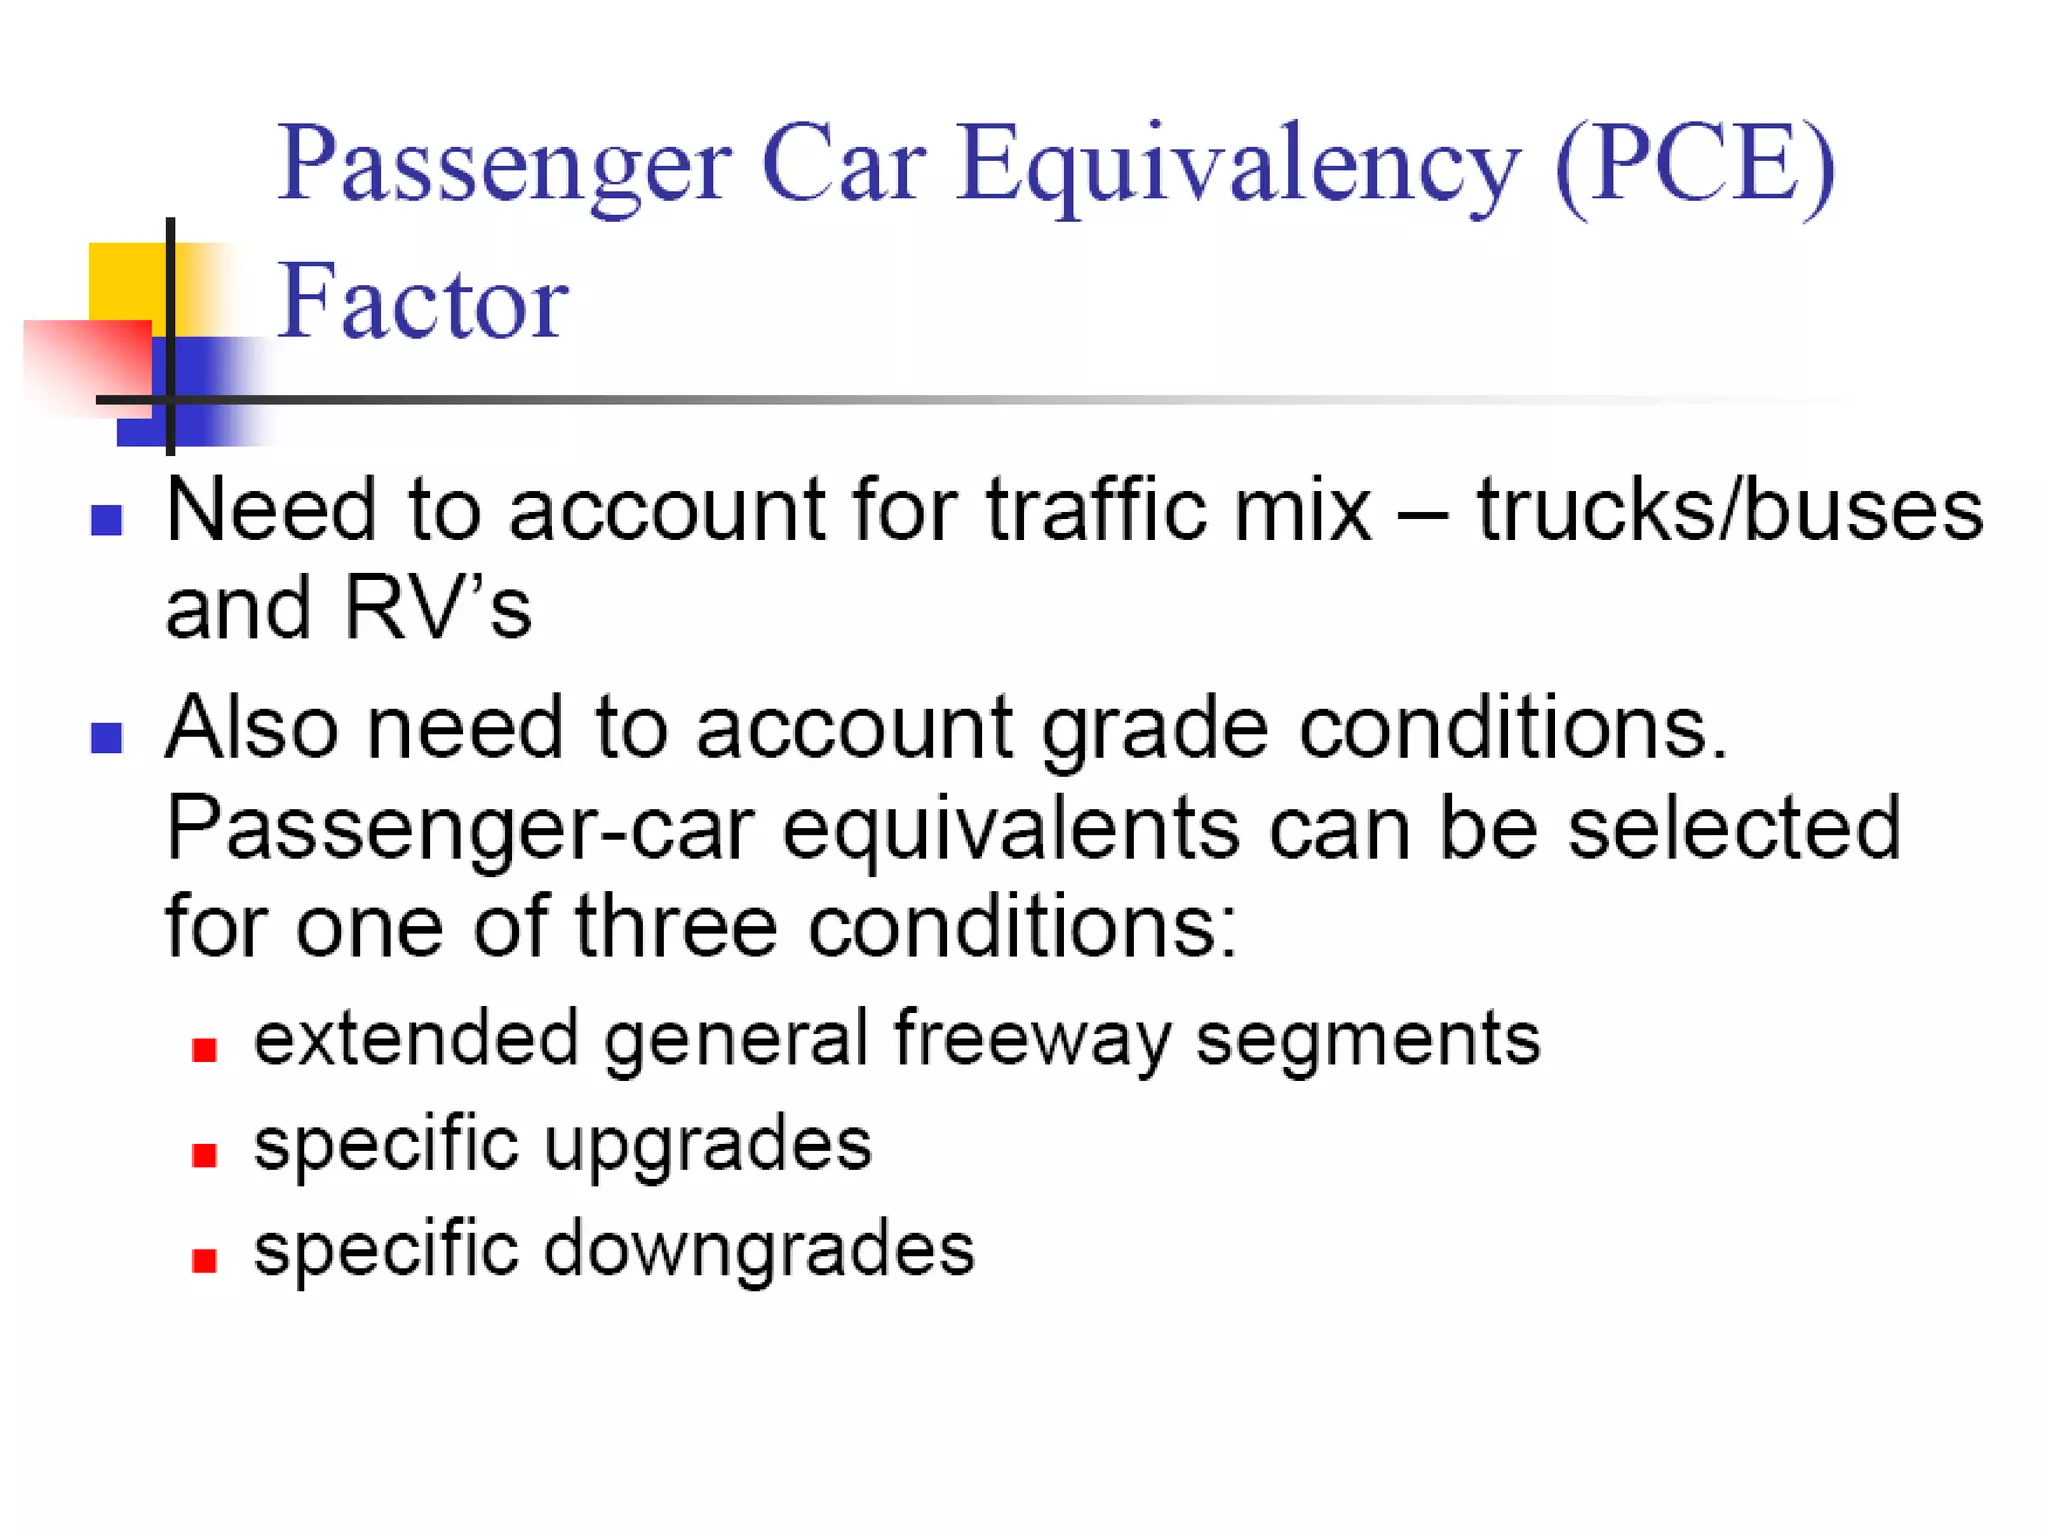
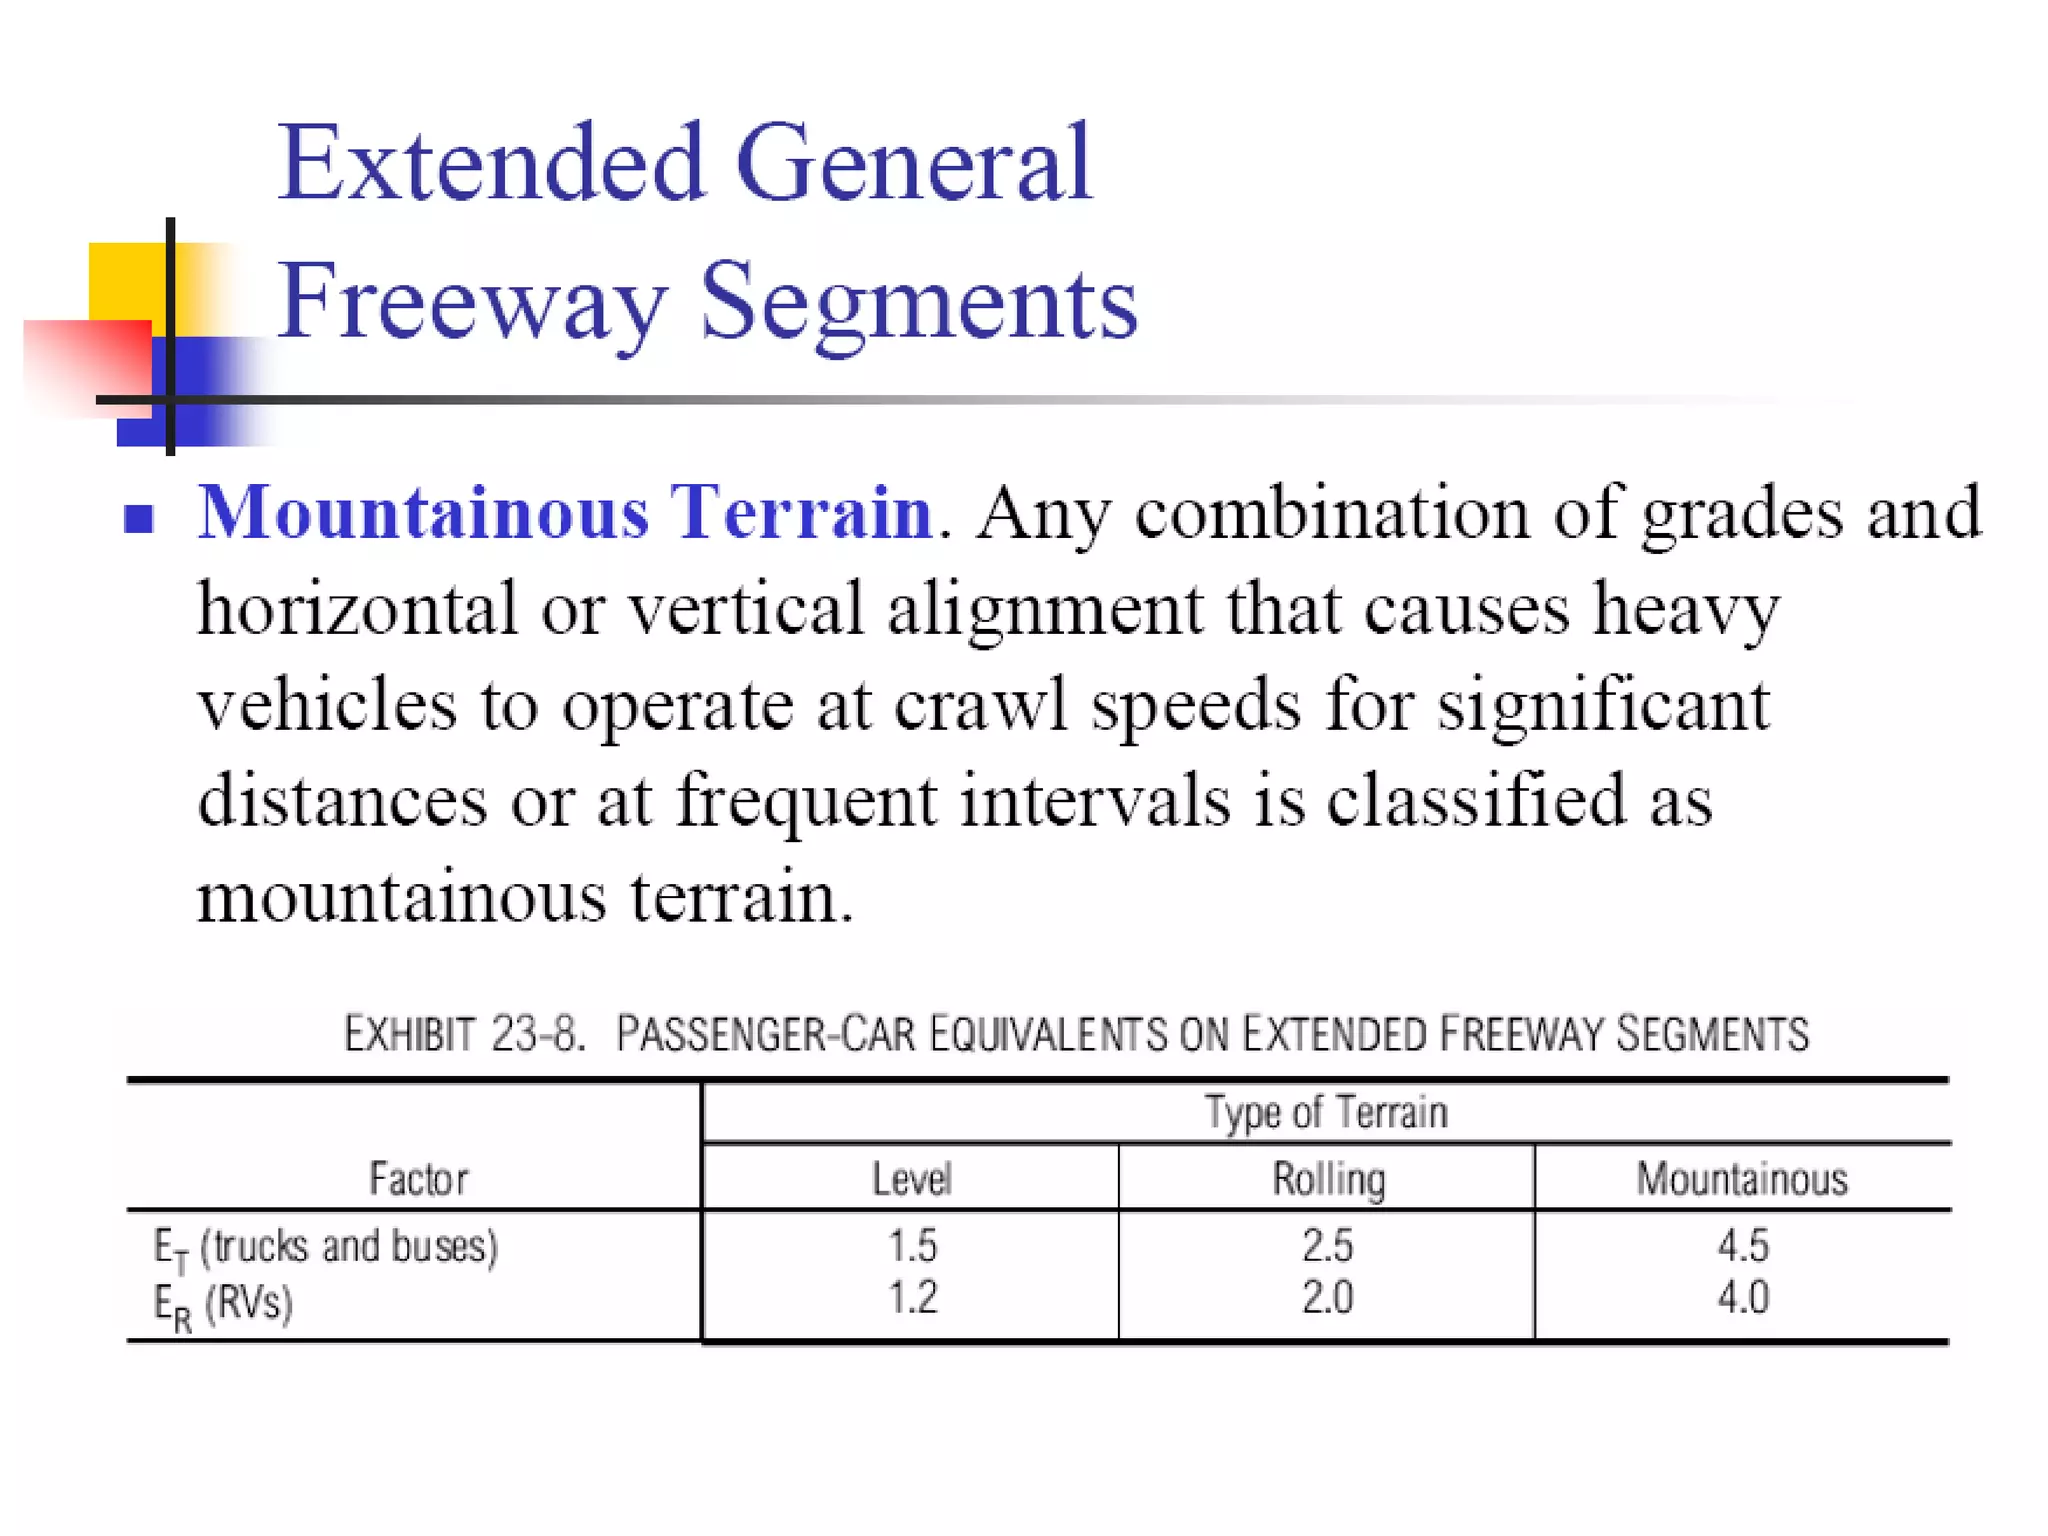
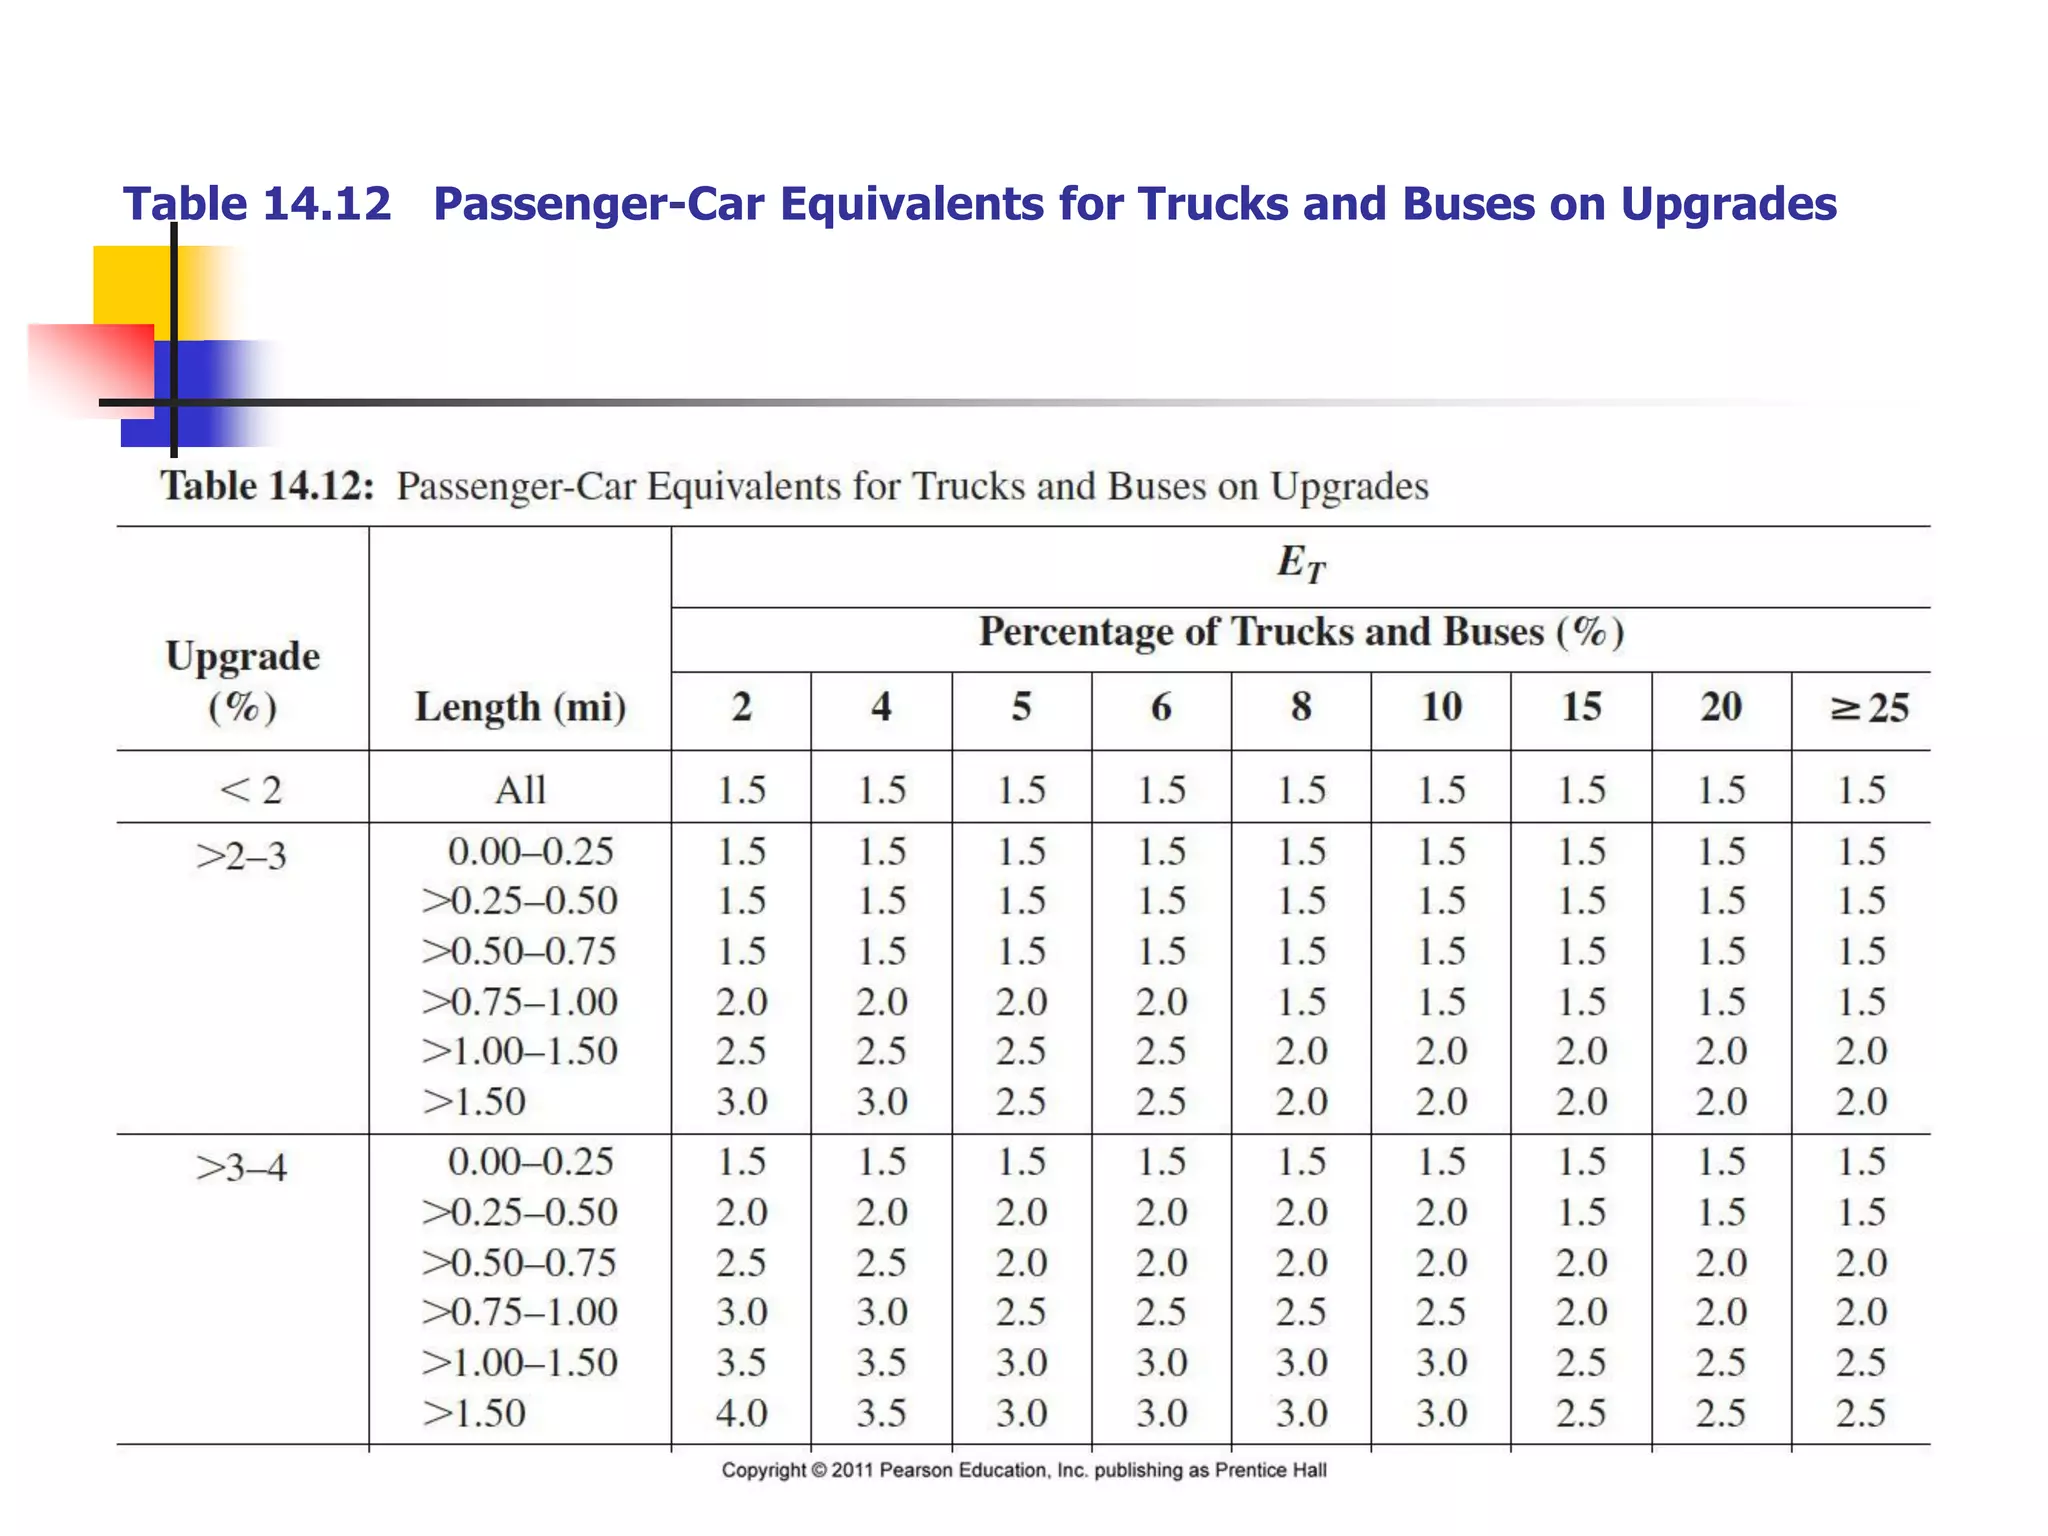
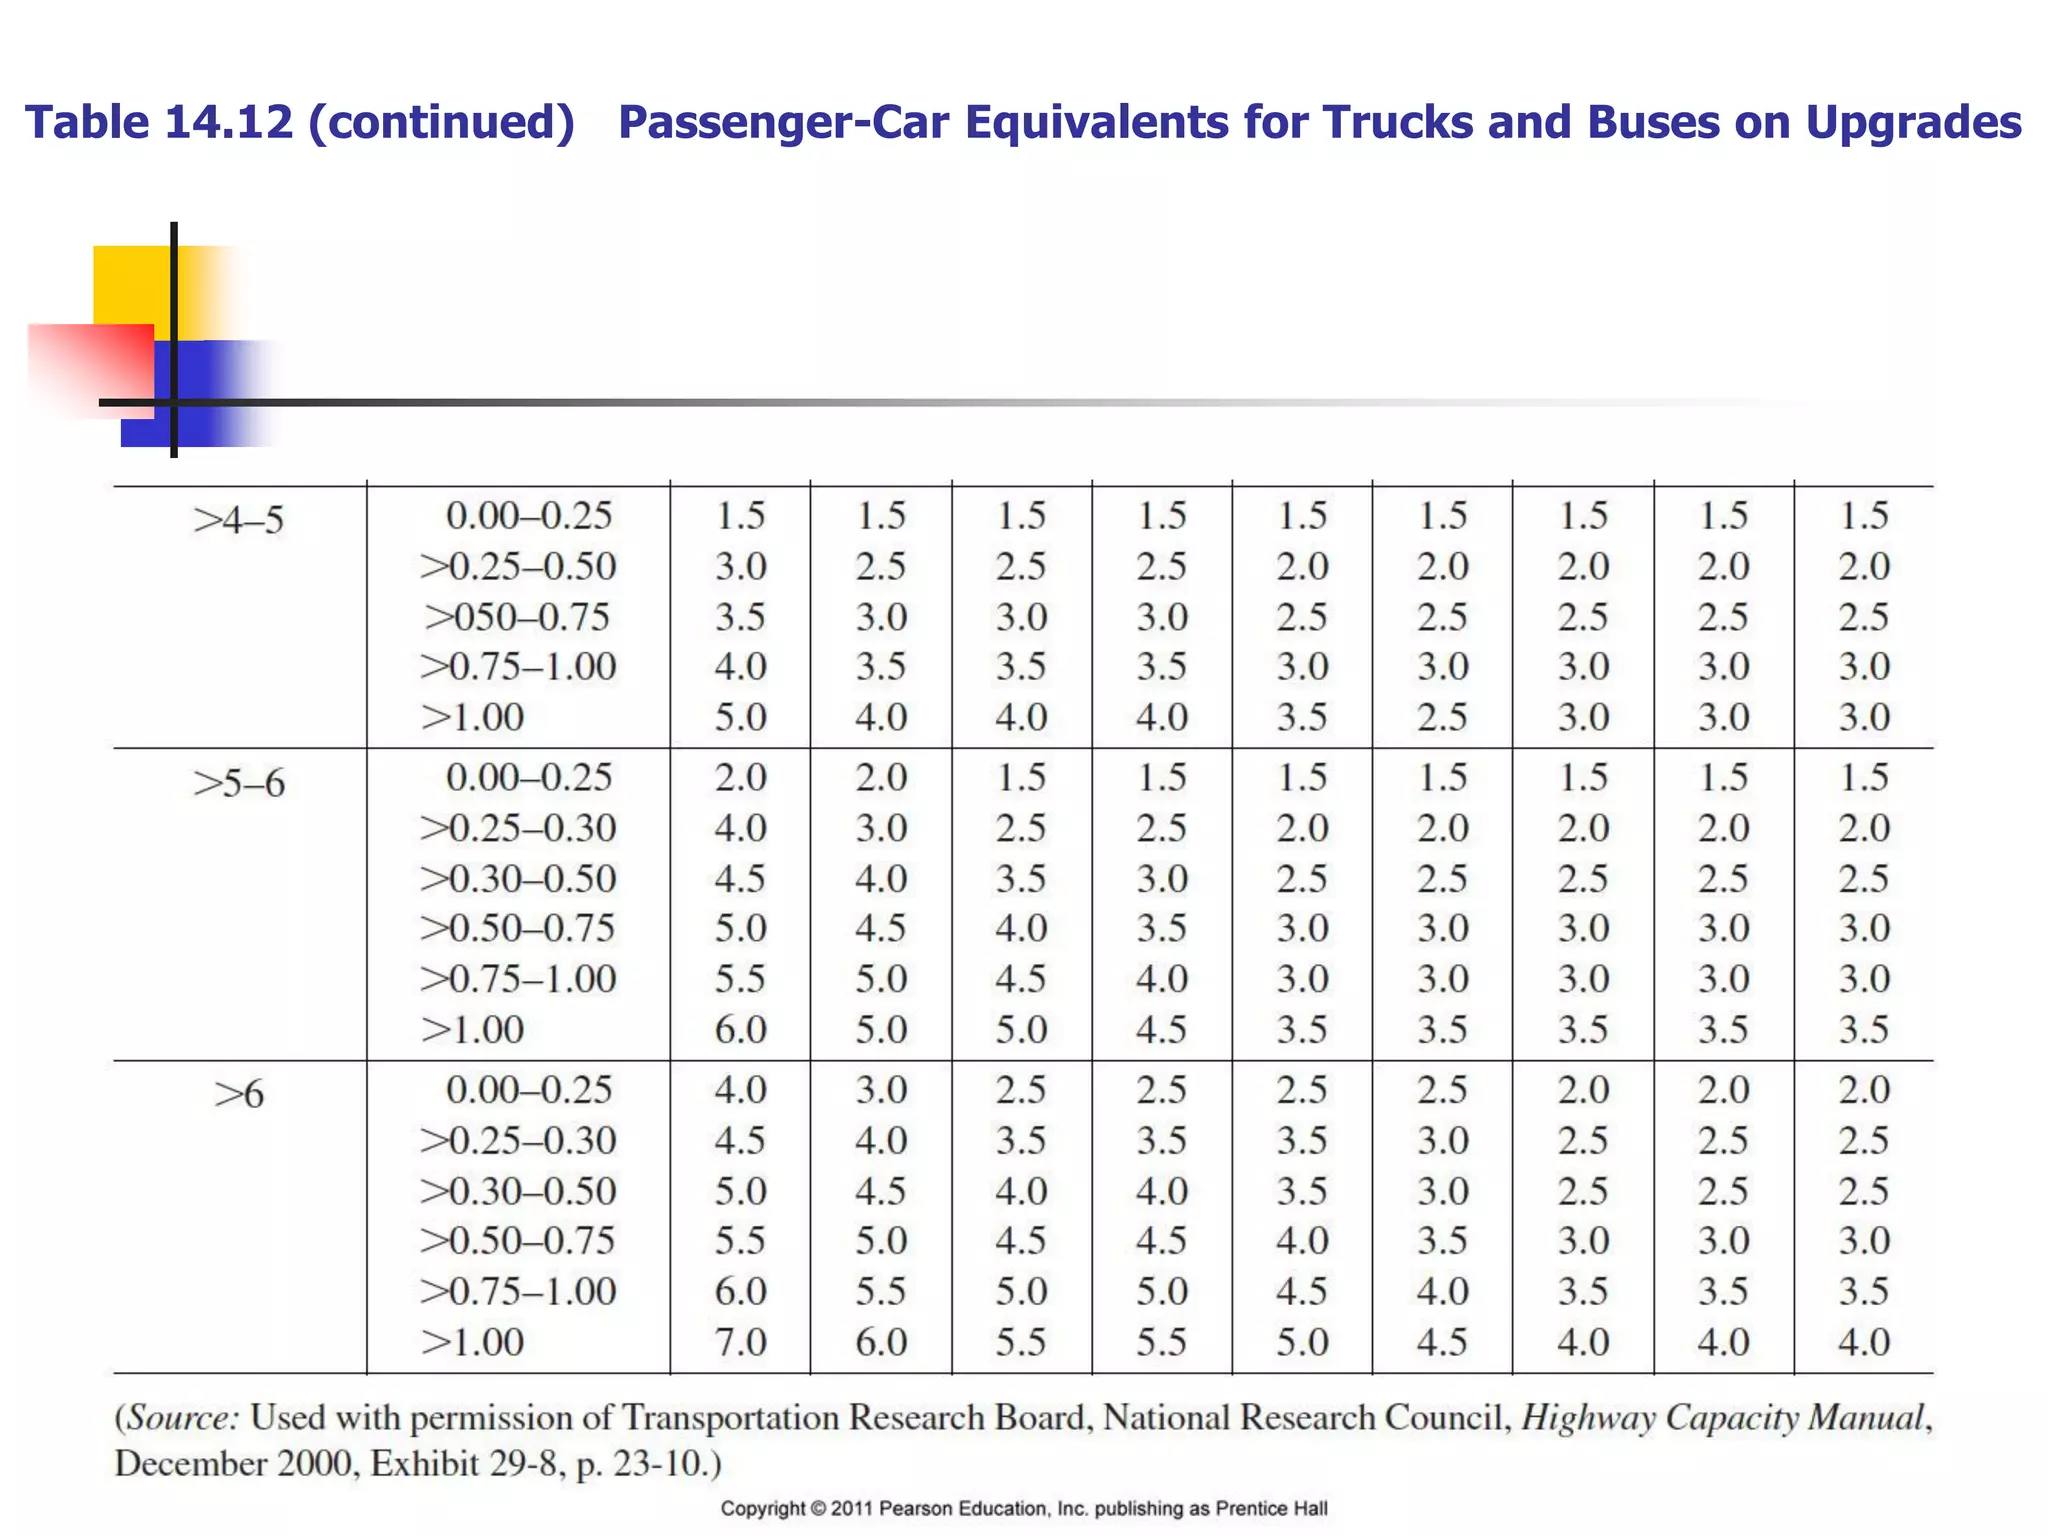
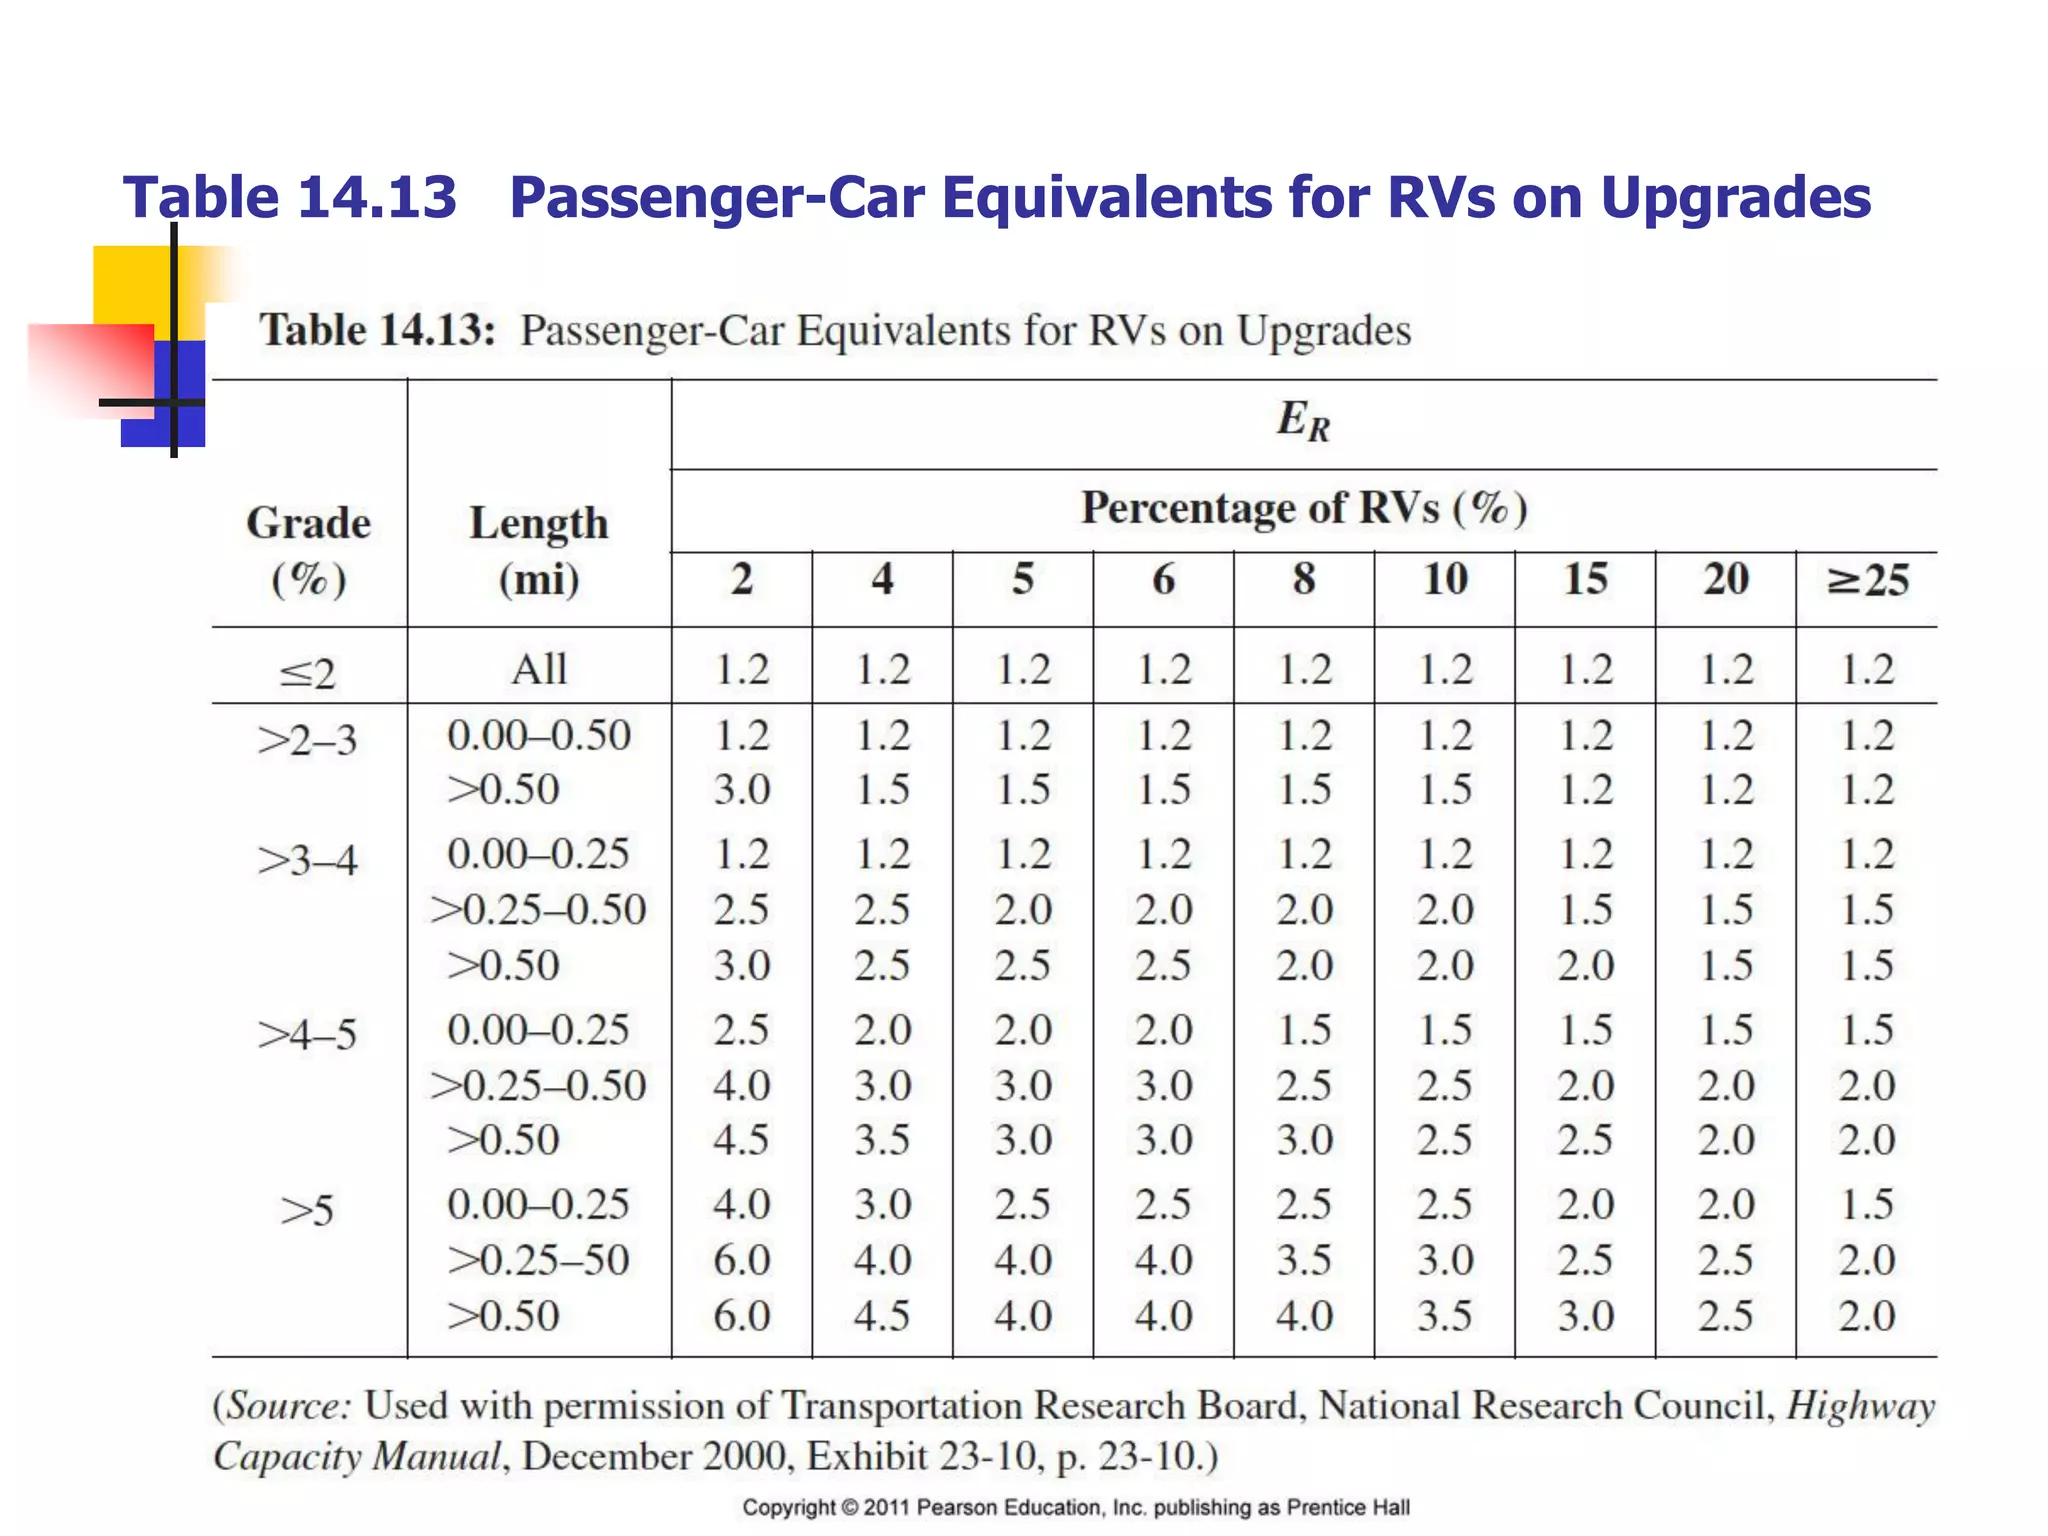
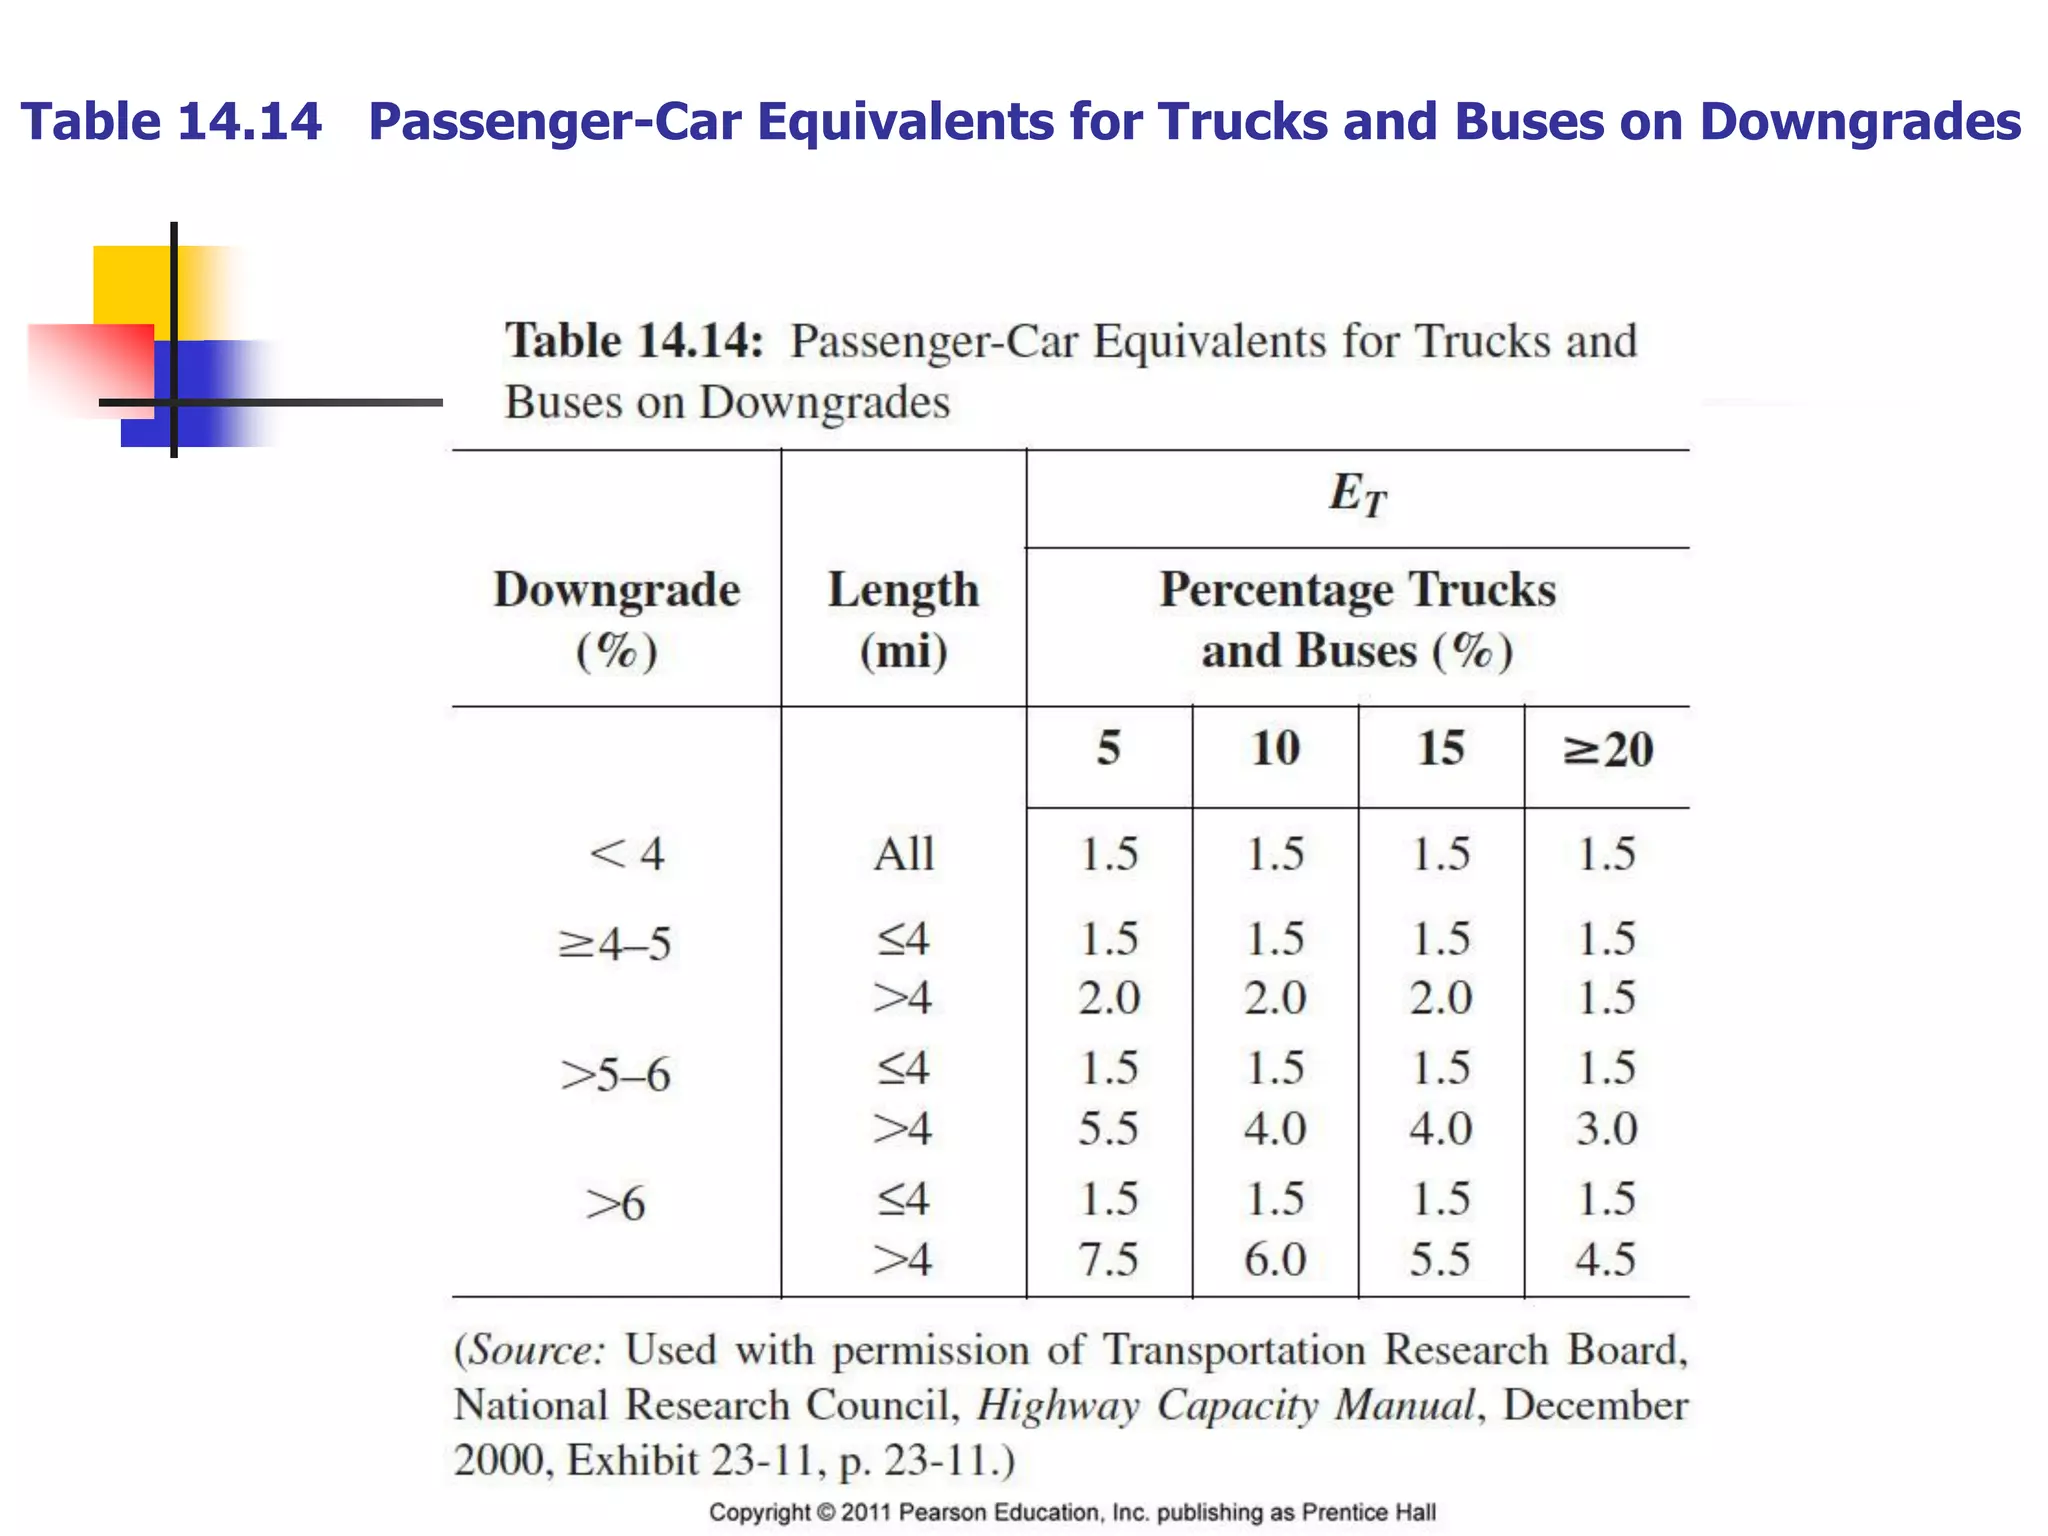
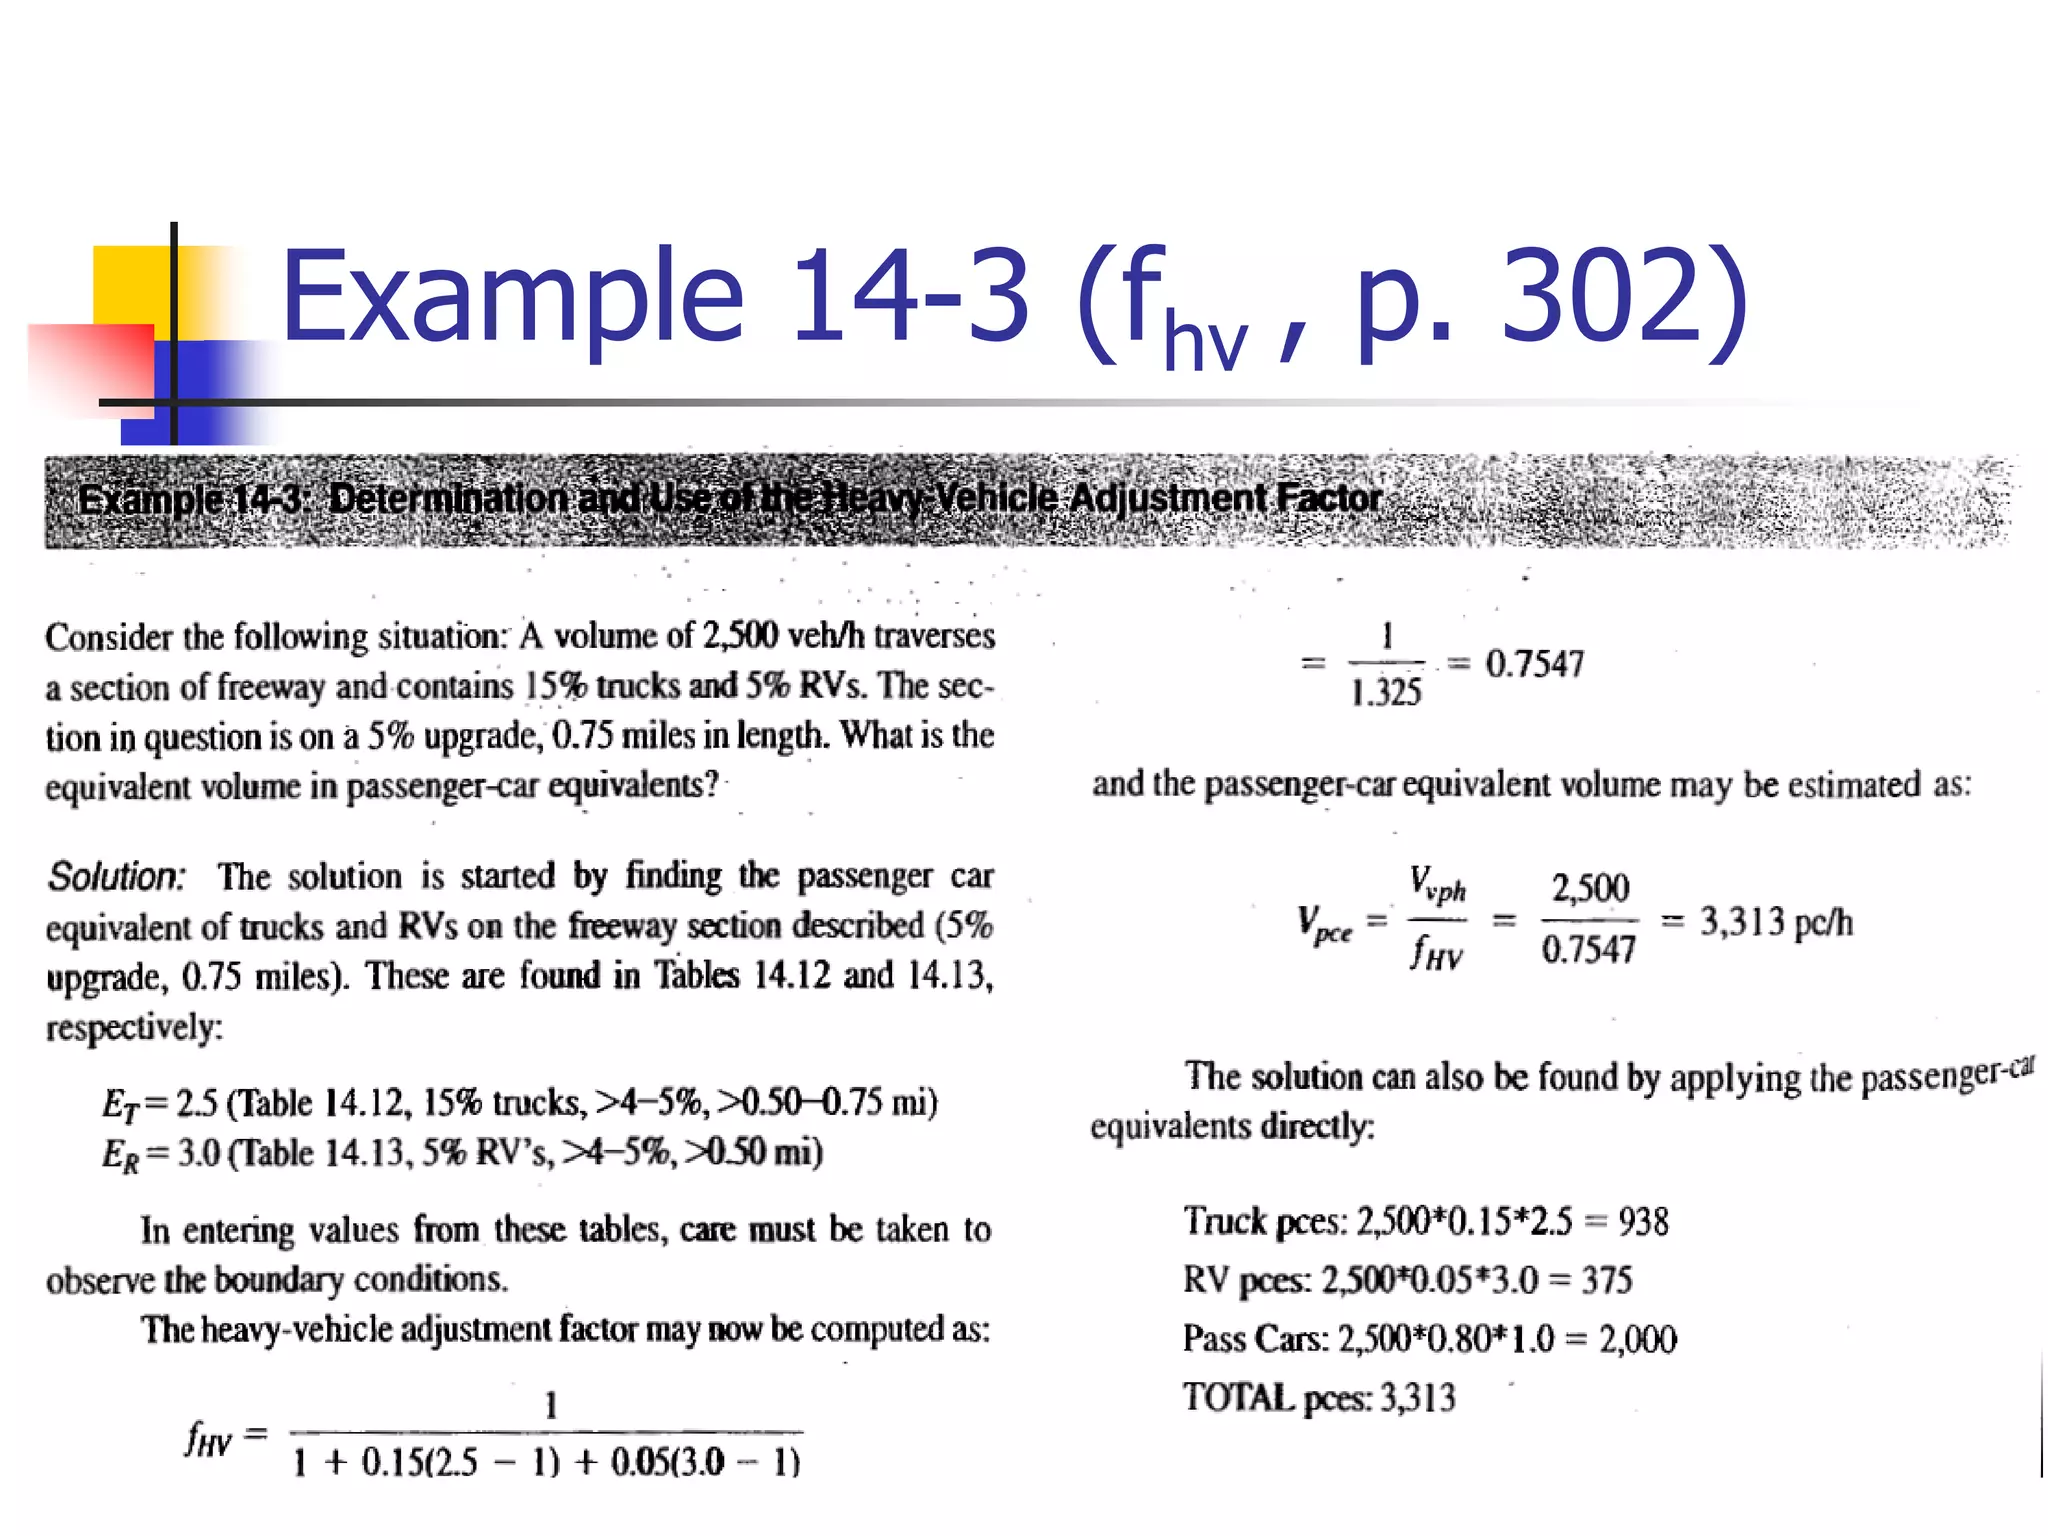
Tables presenting passenger-car equivalents for trucks, buses, and RVs on upgrades and downgrades.
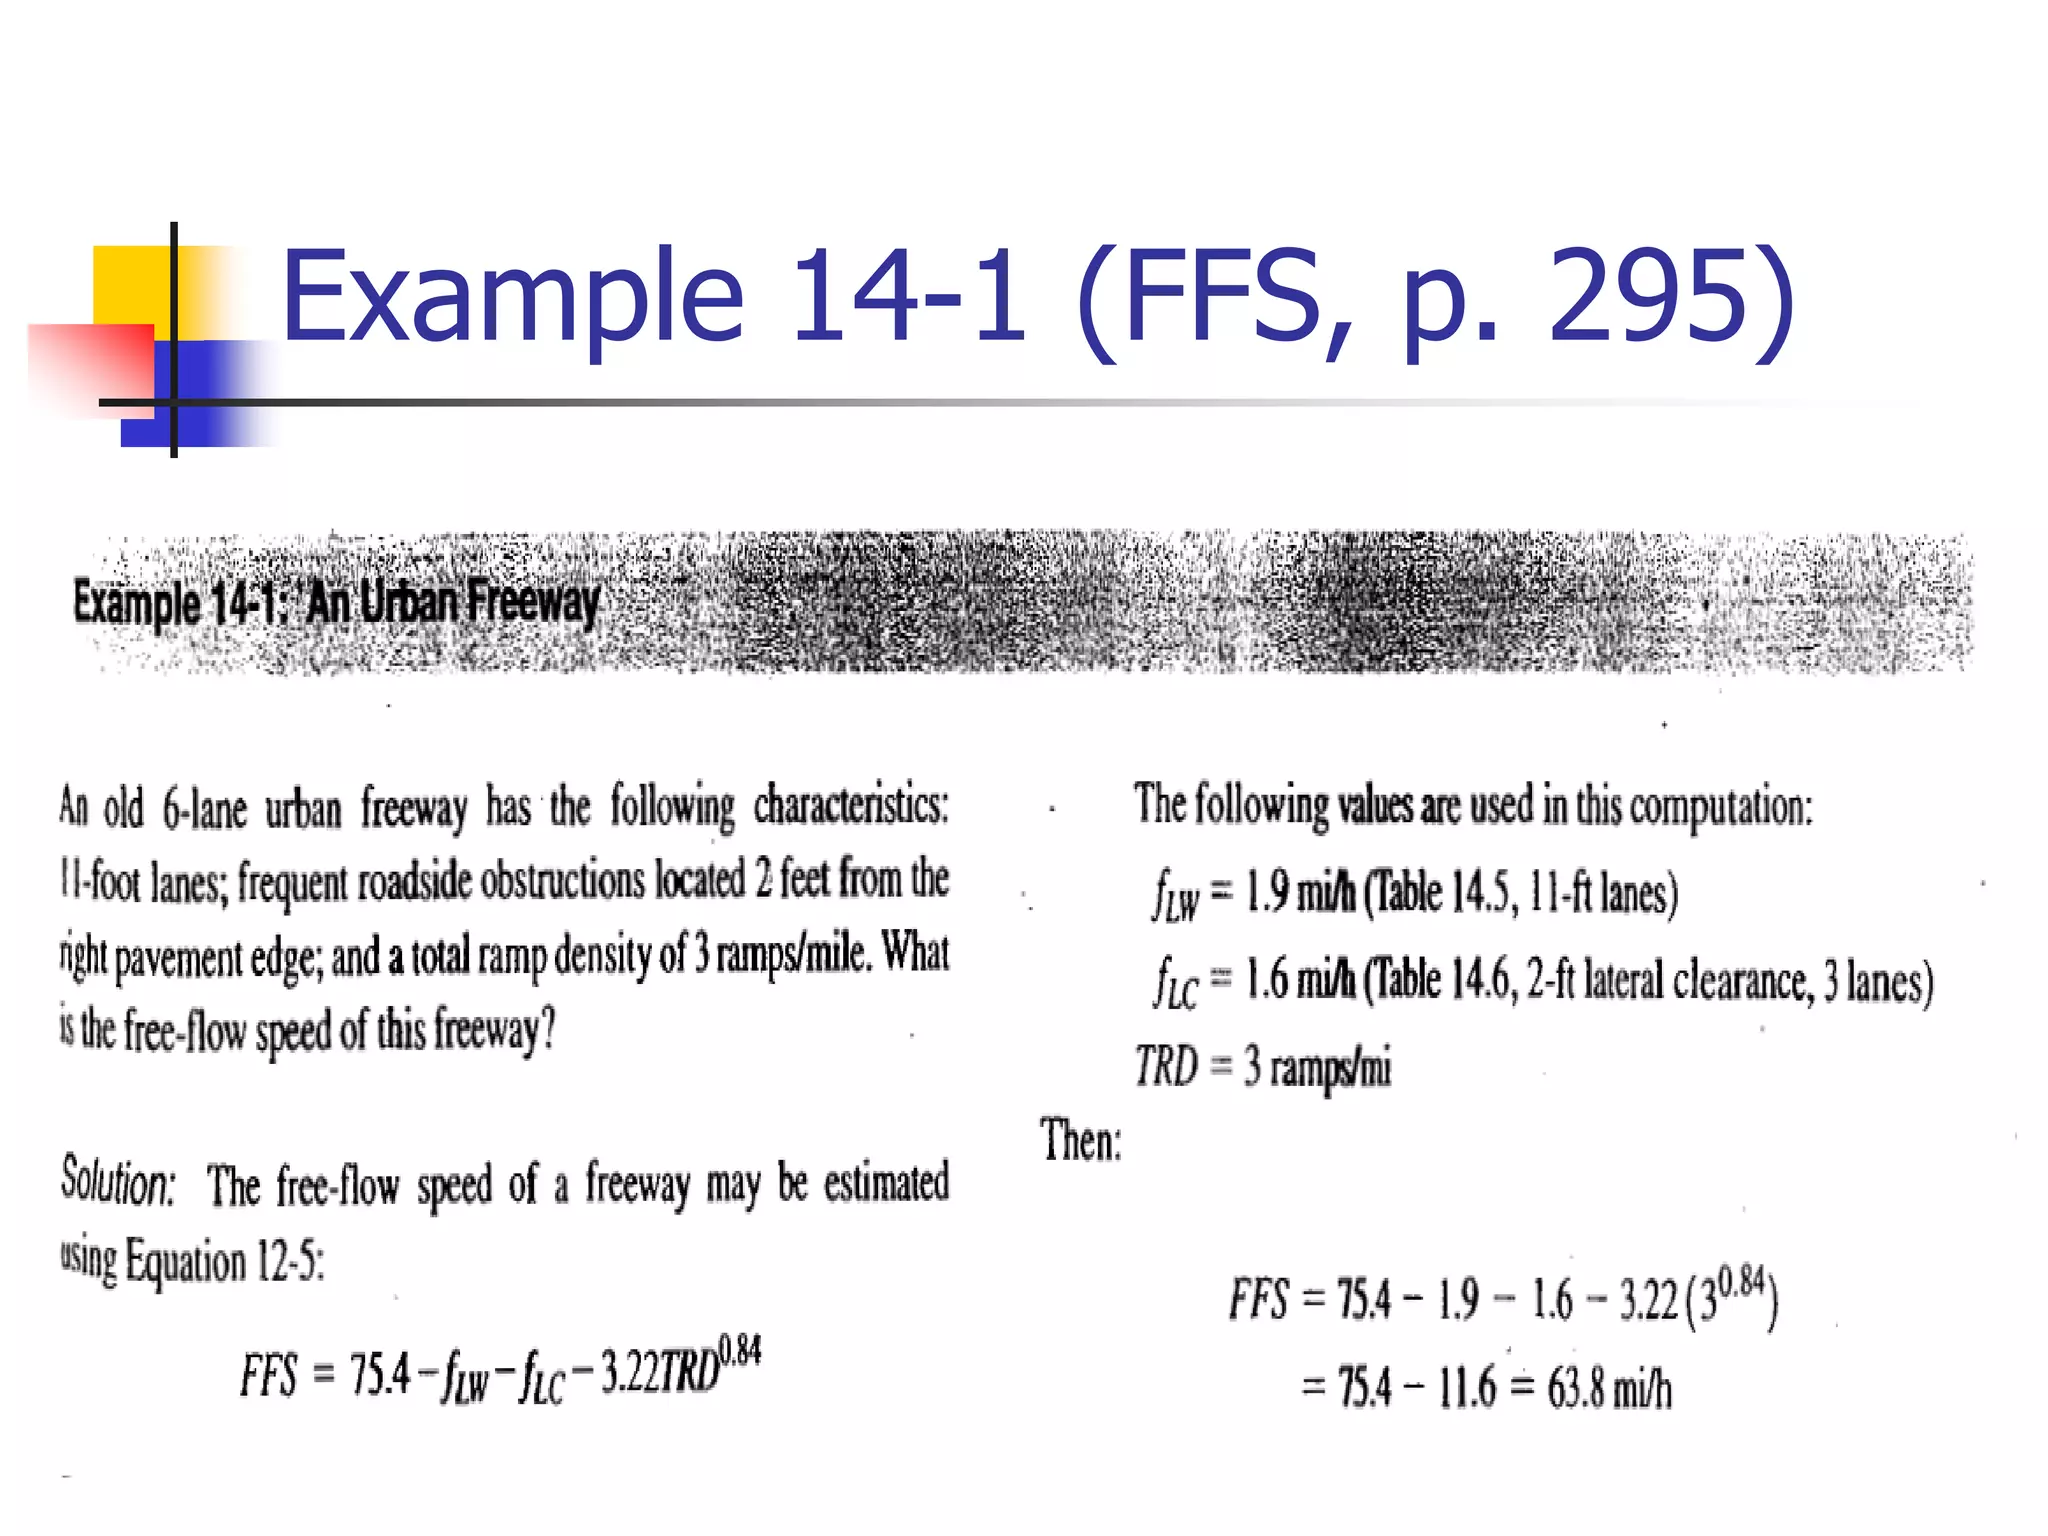
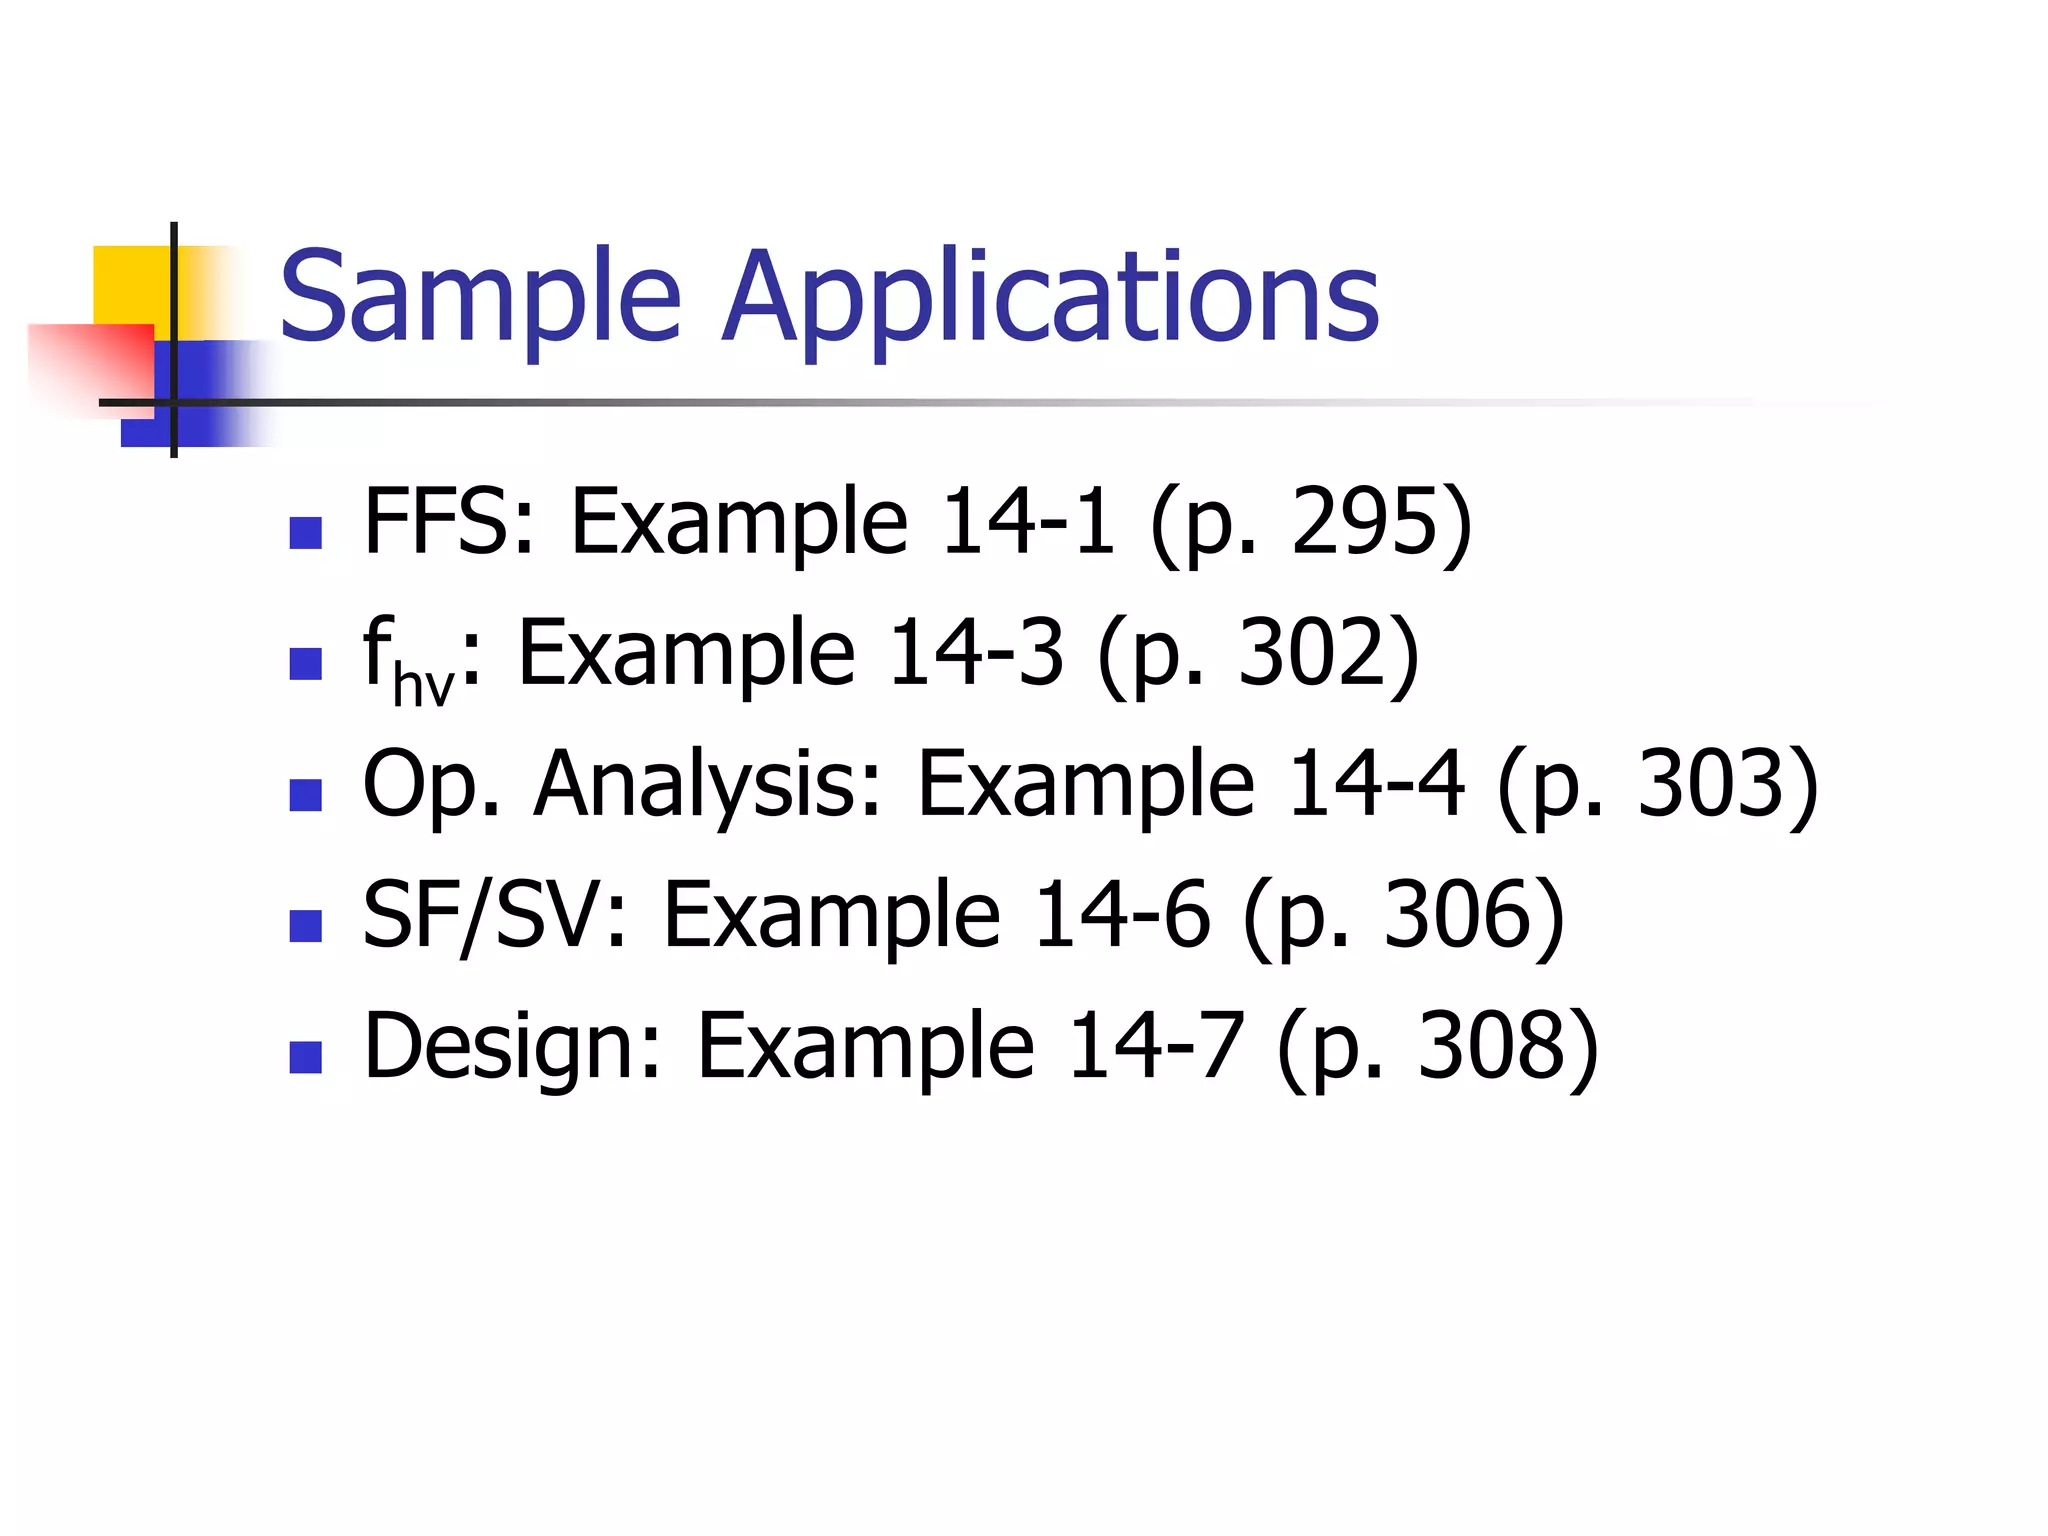
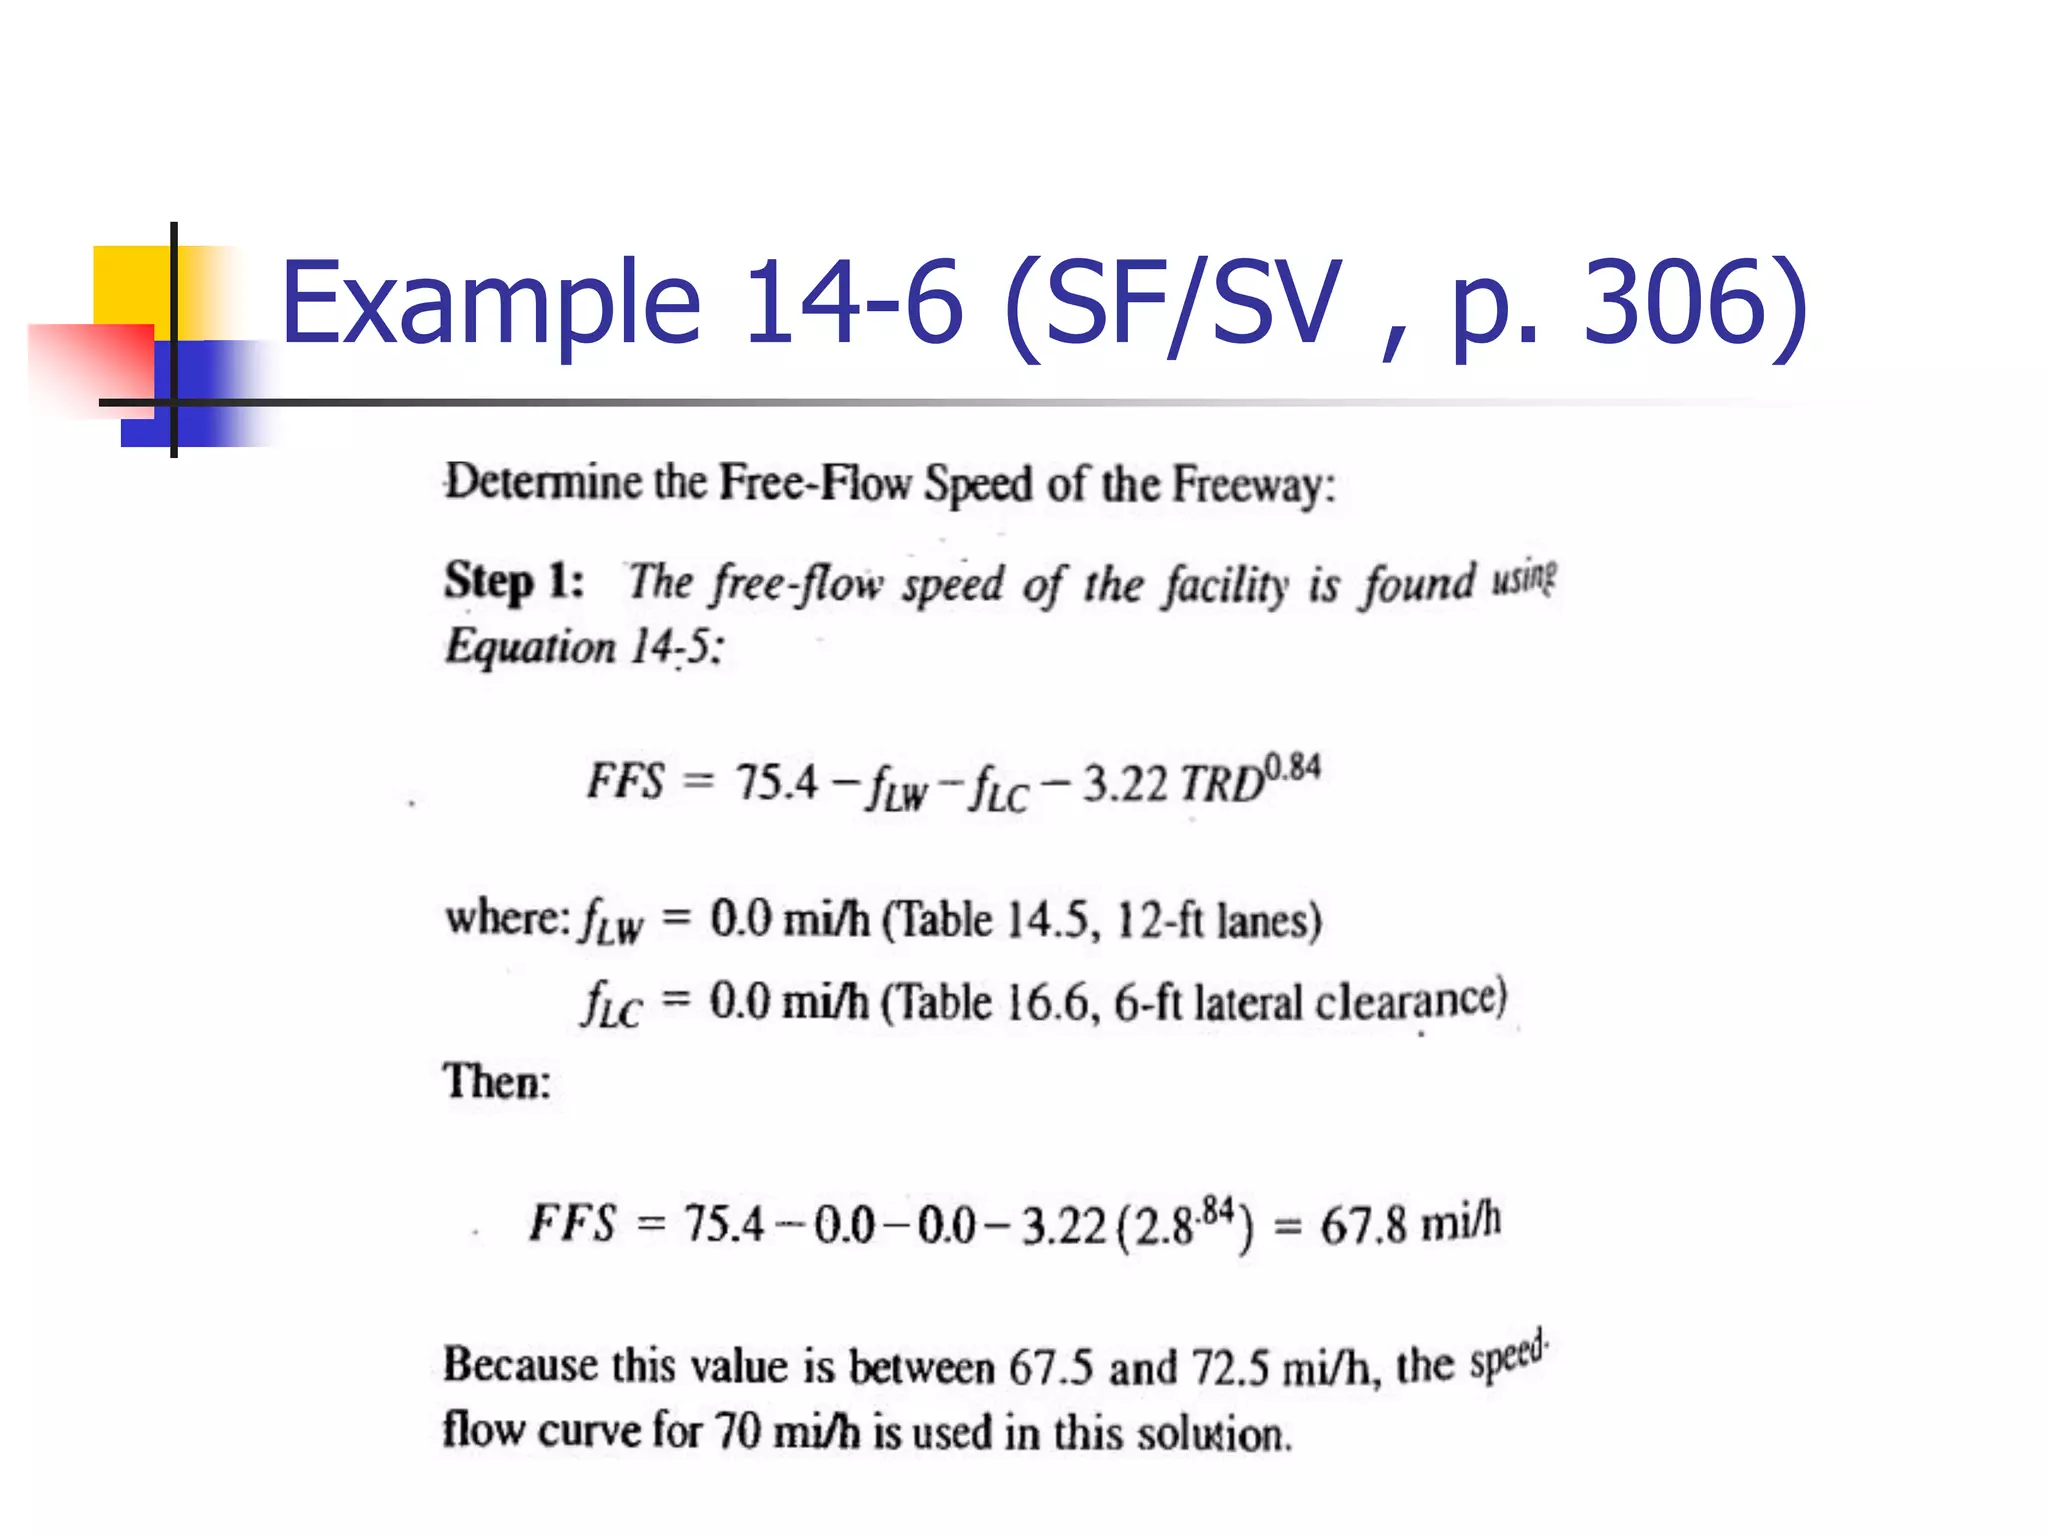
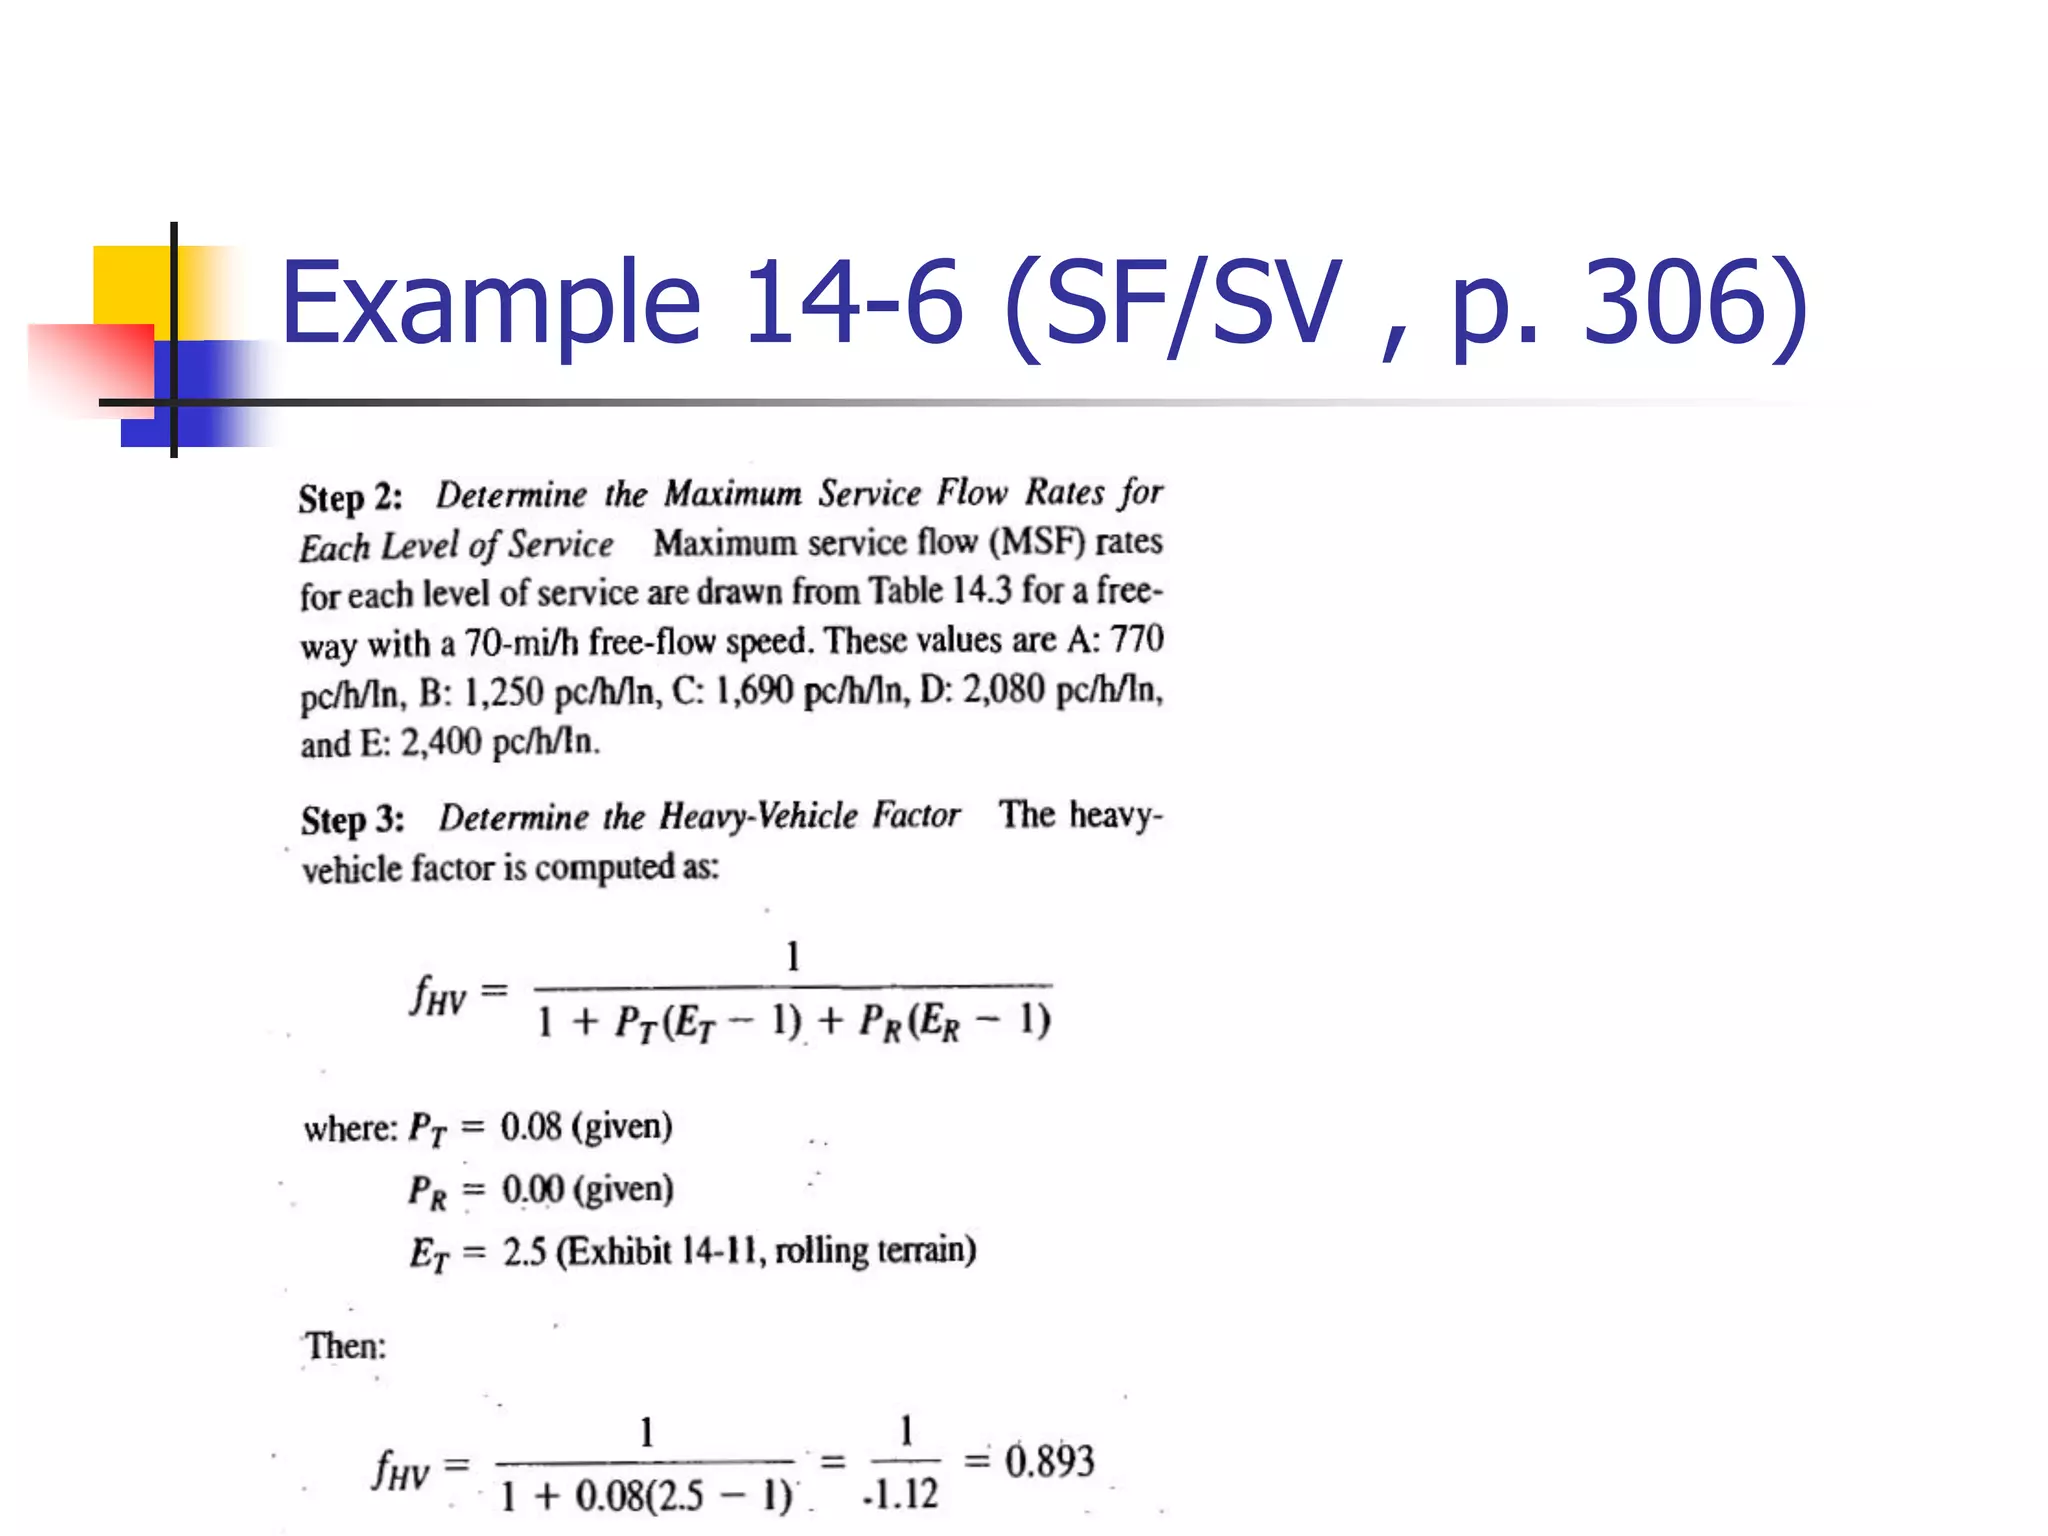
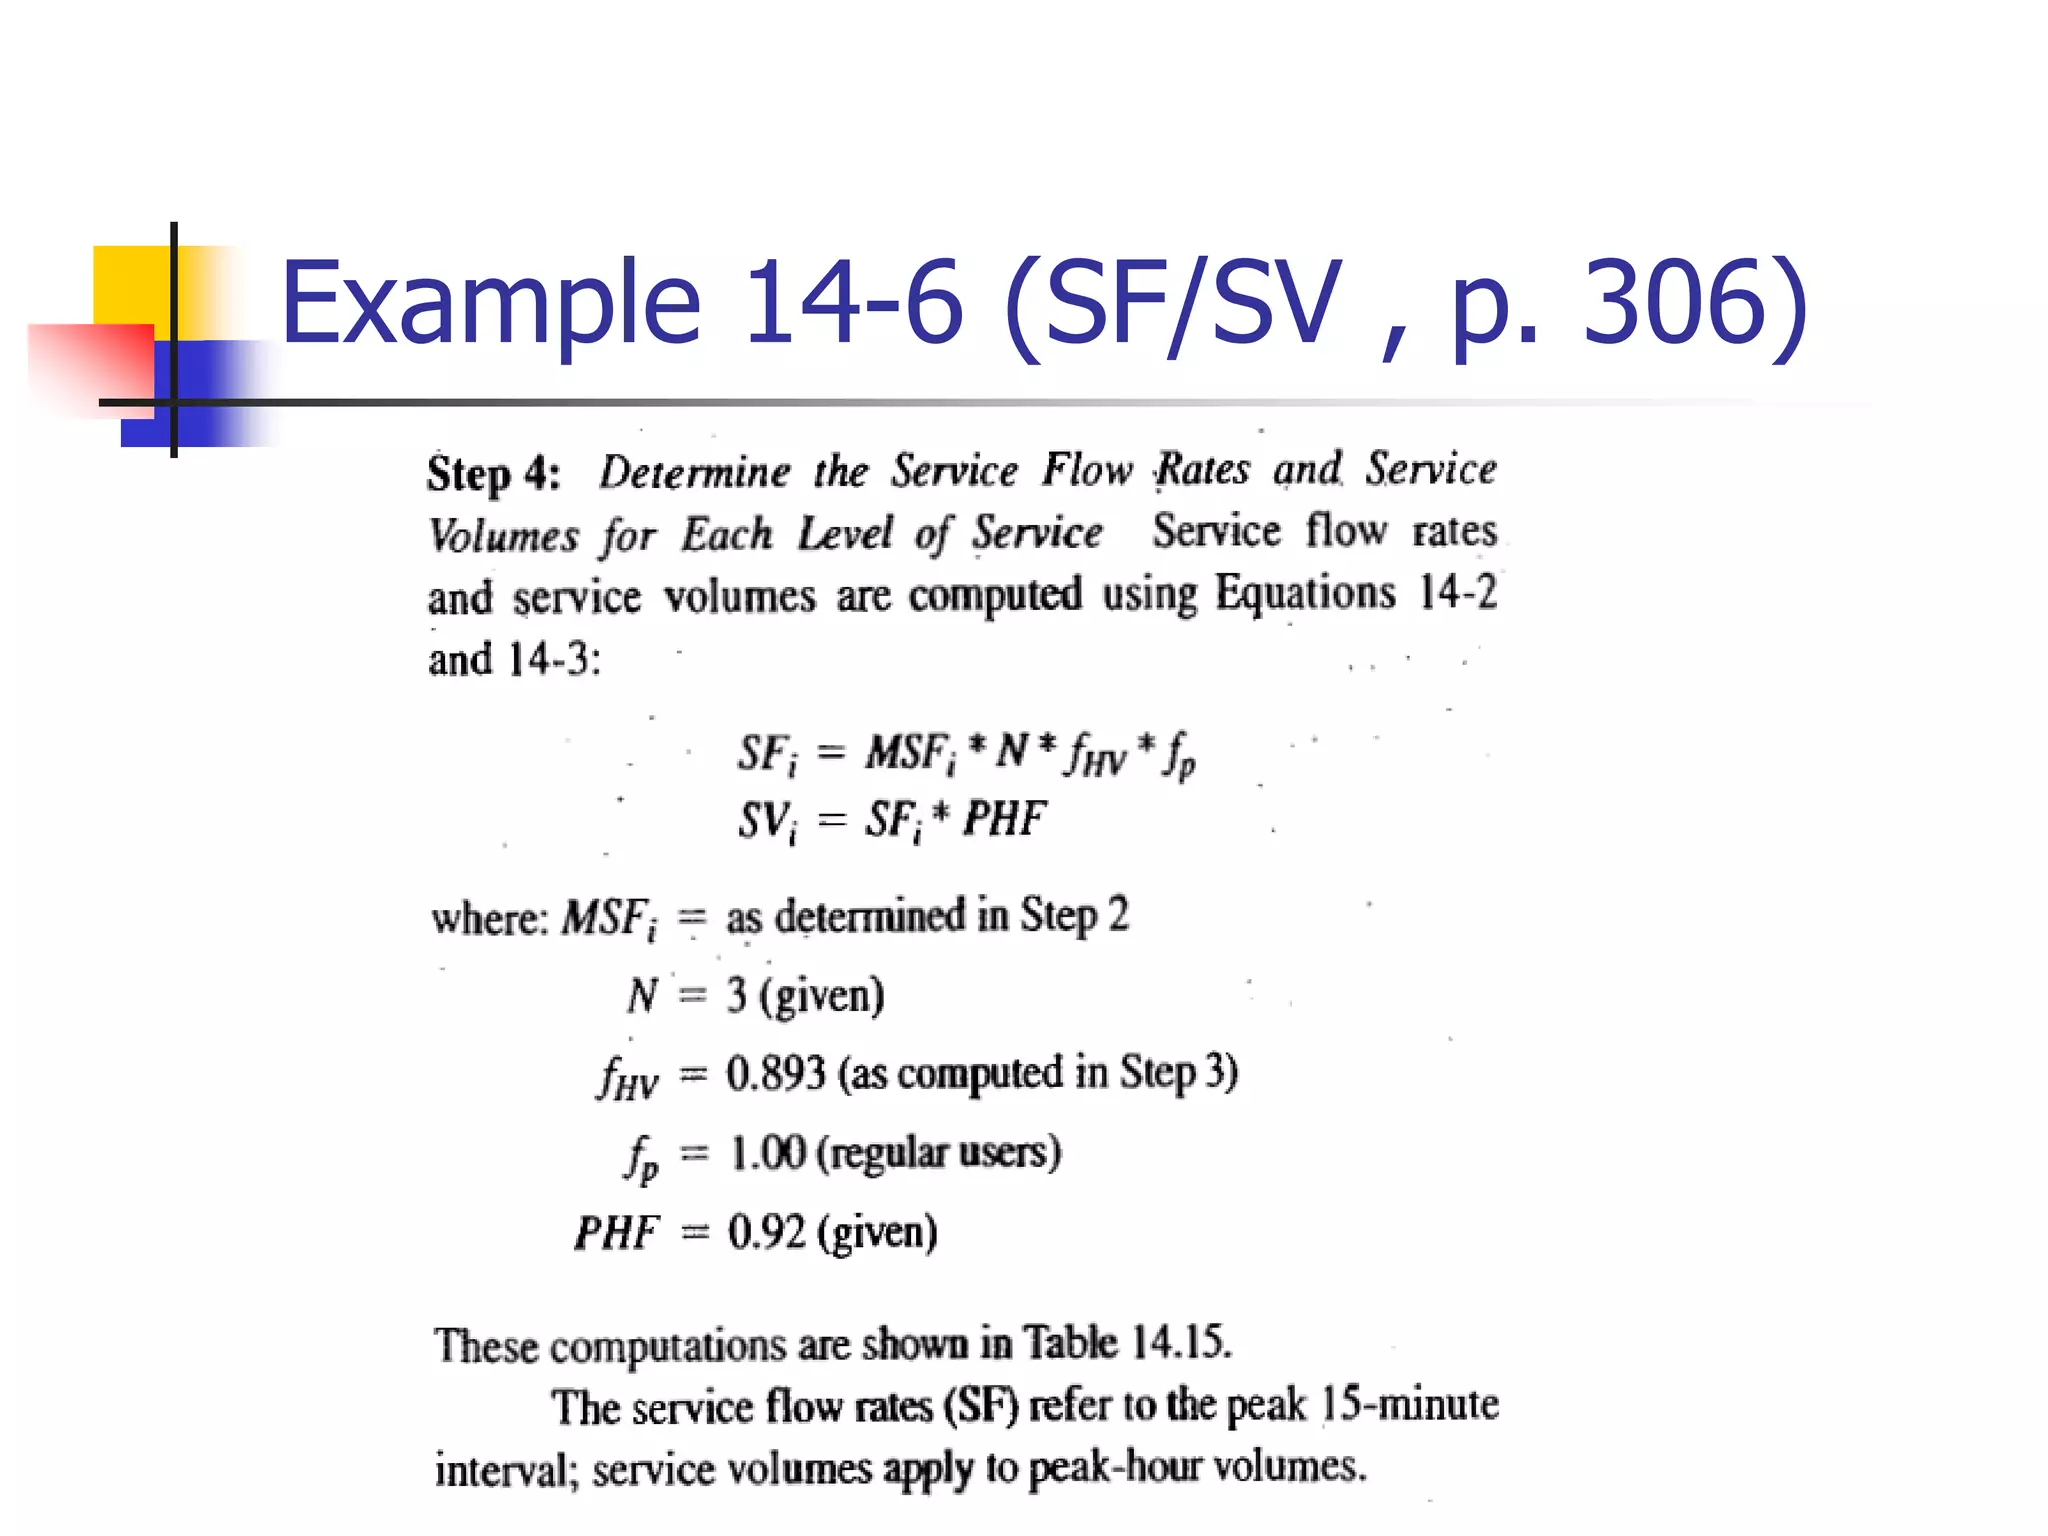
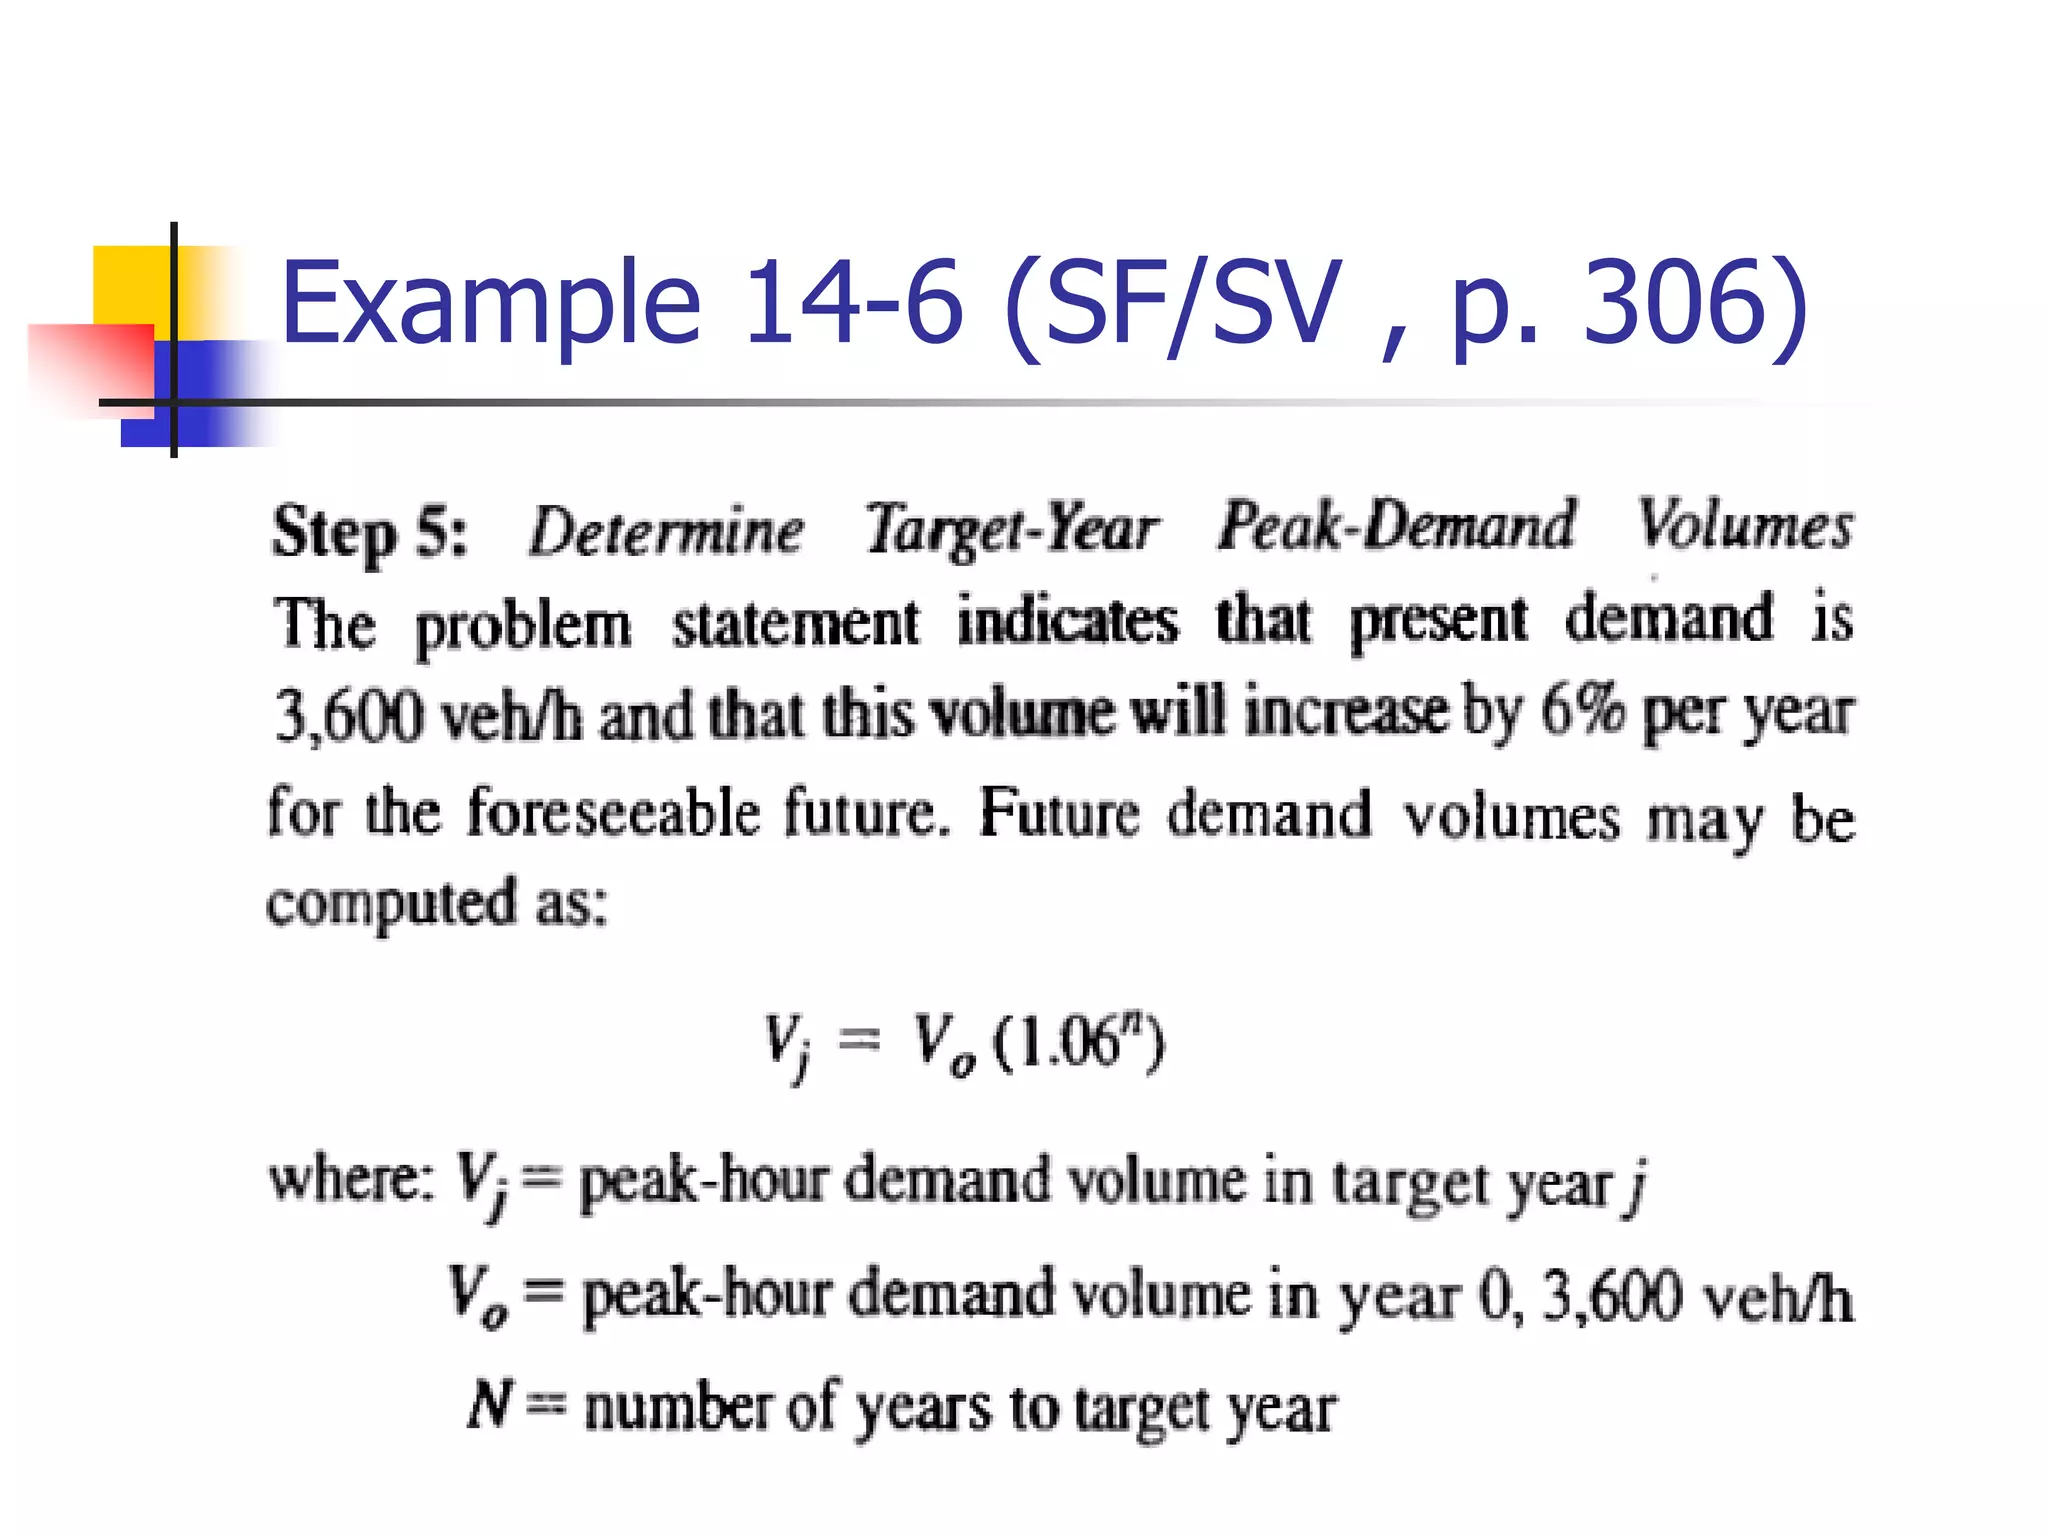
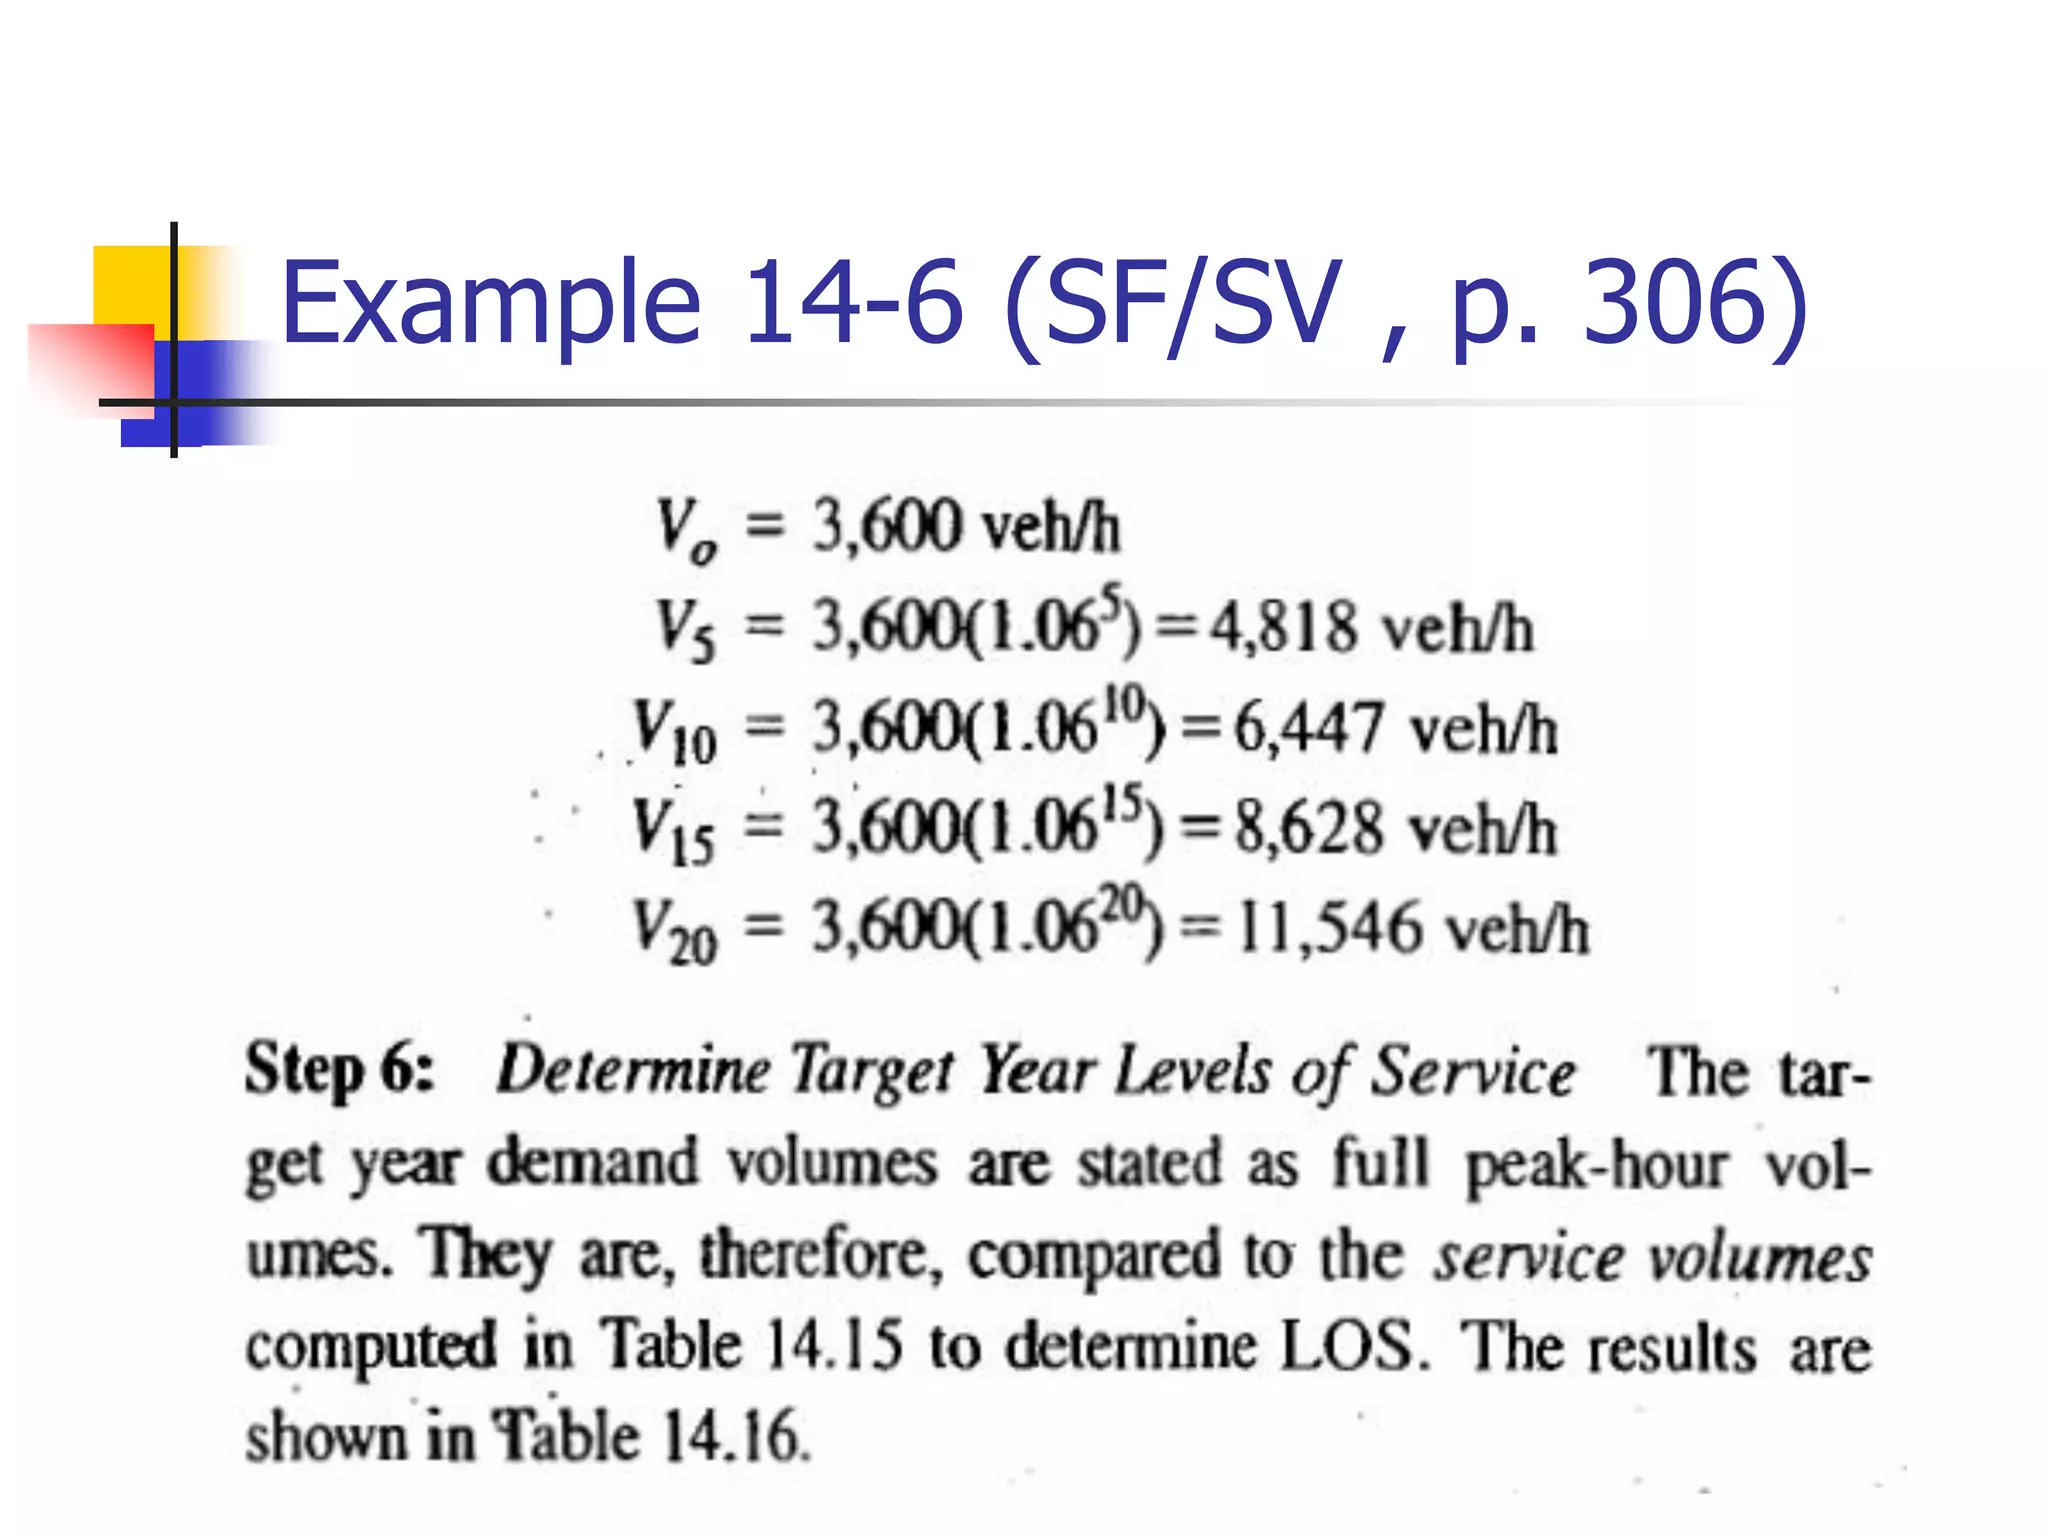
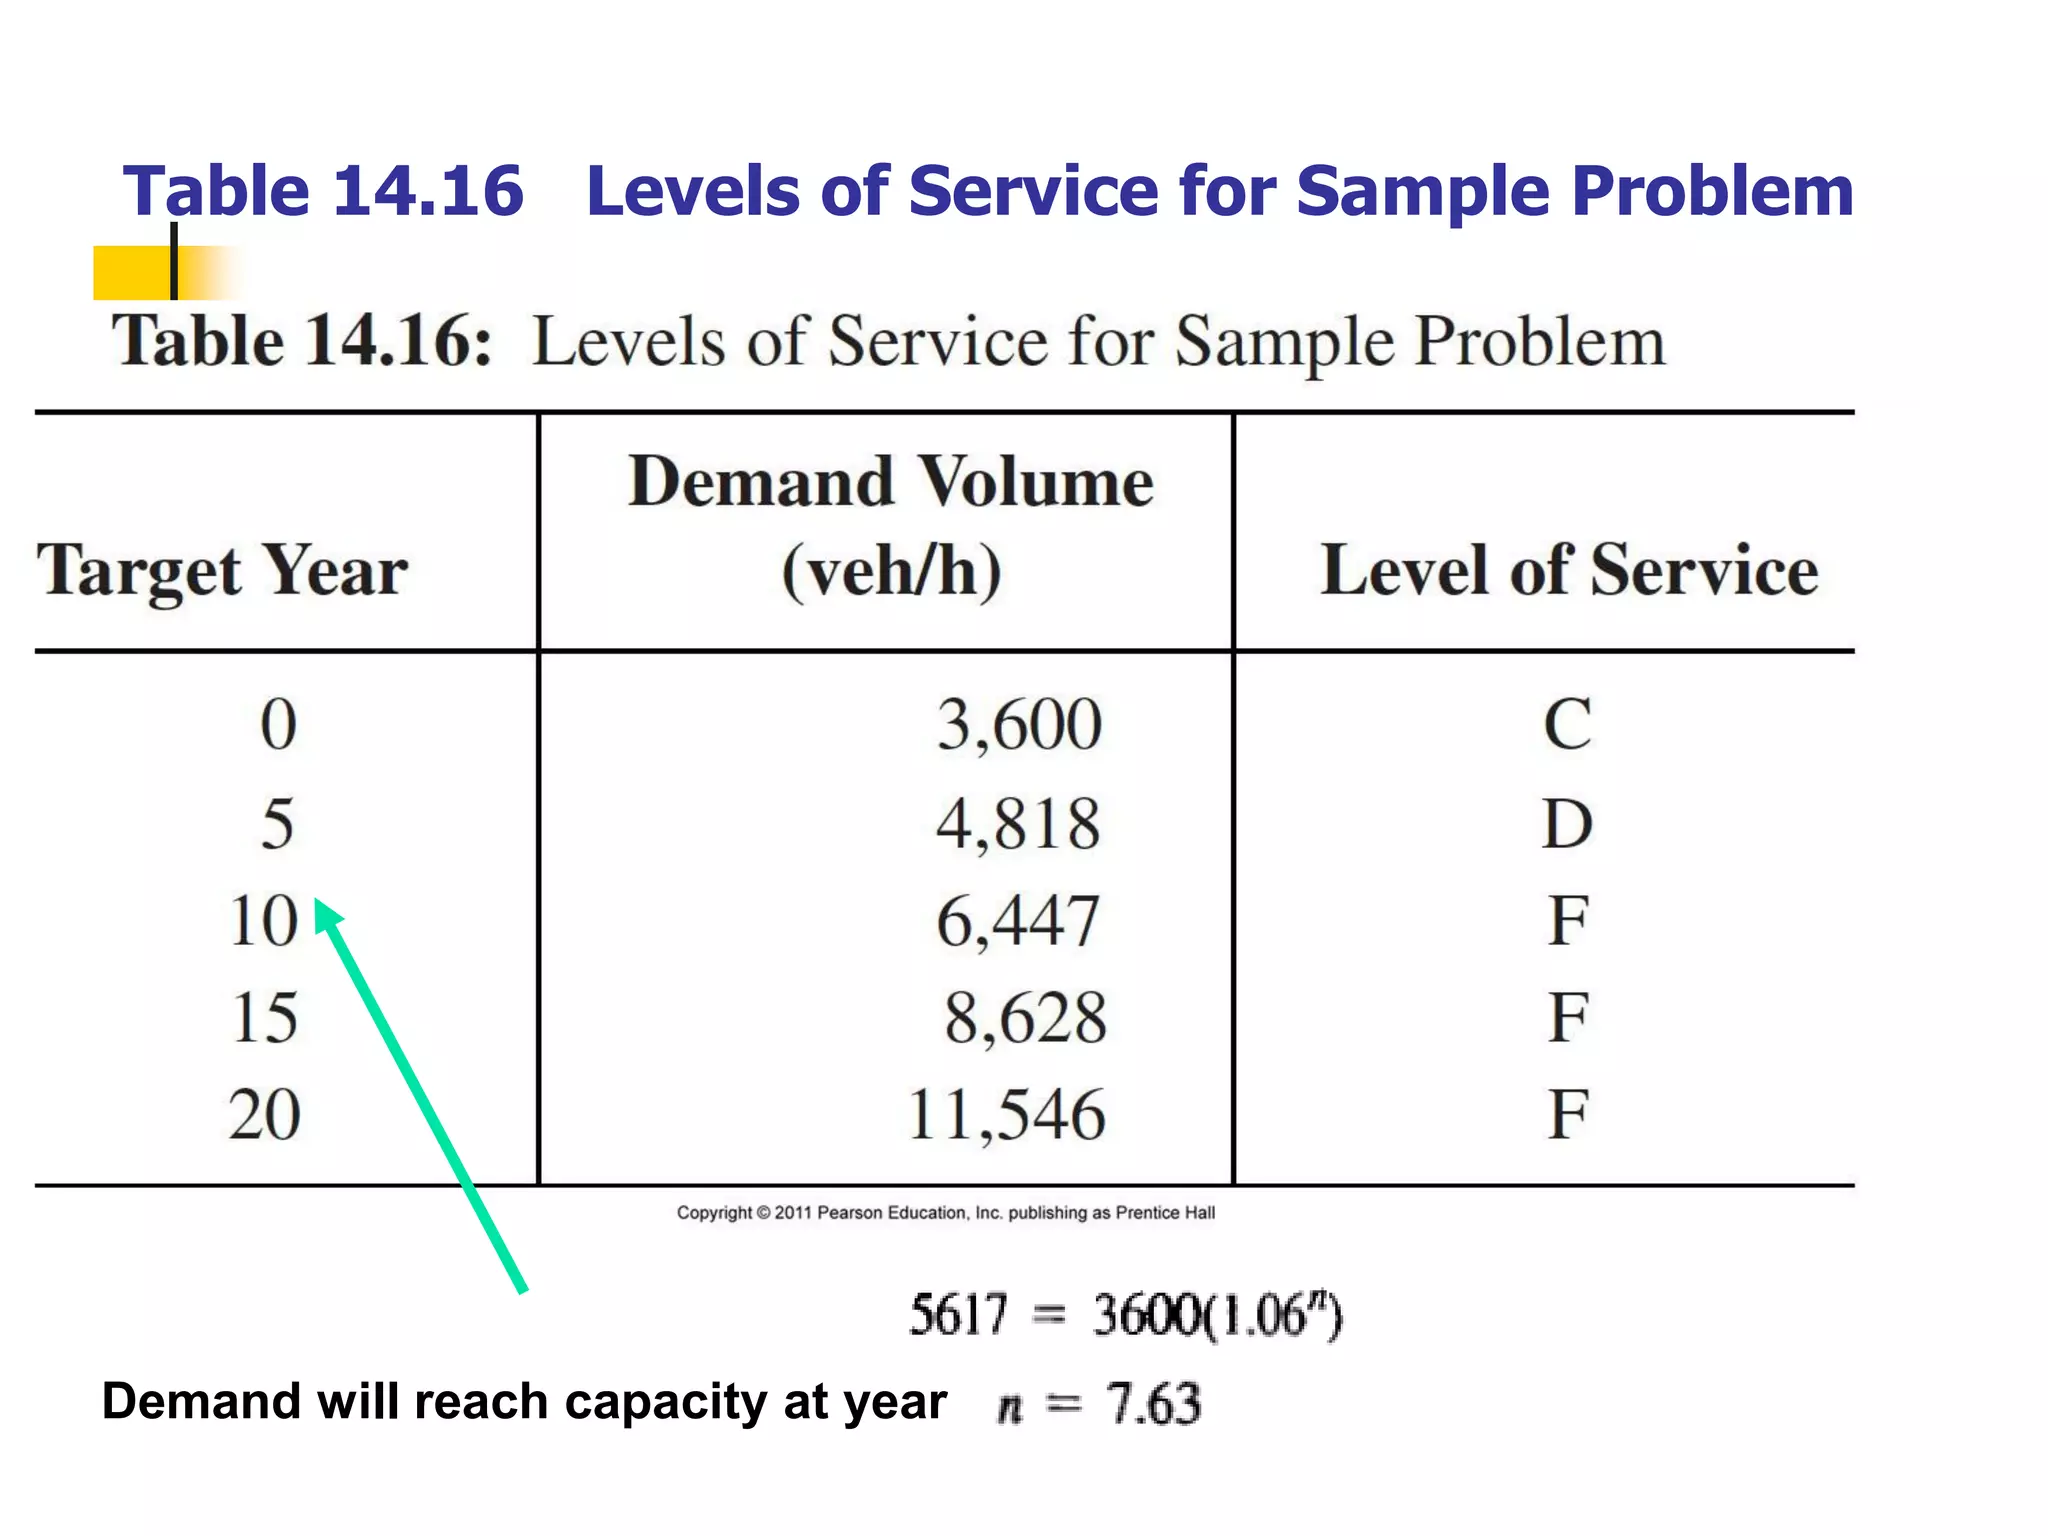
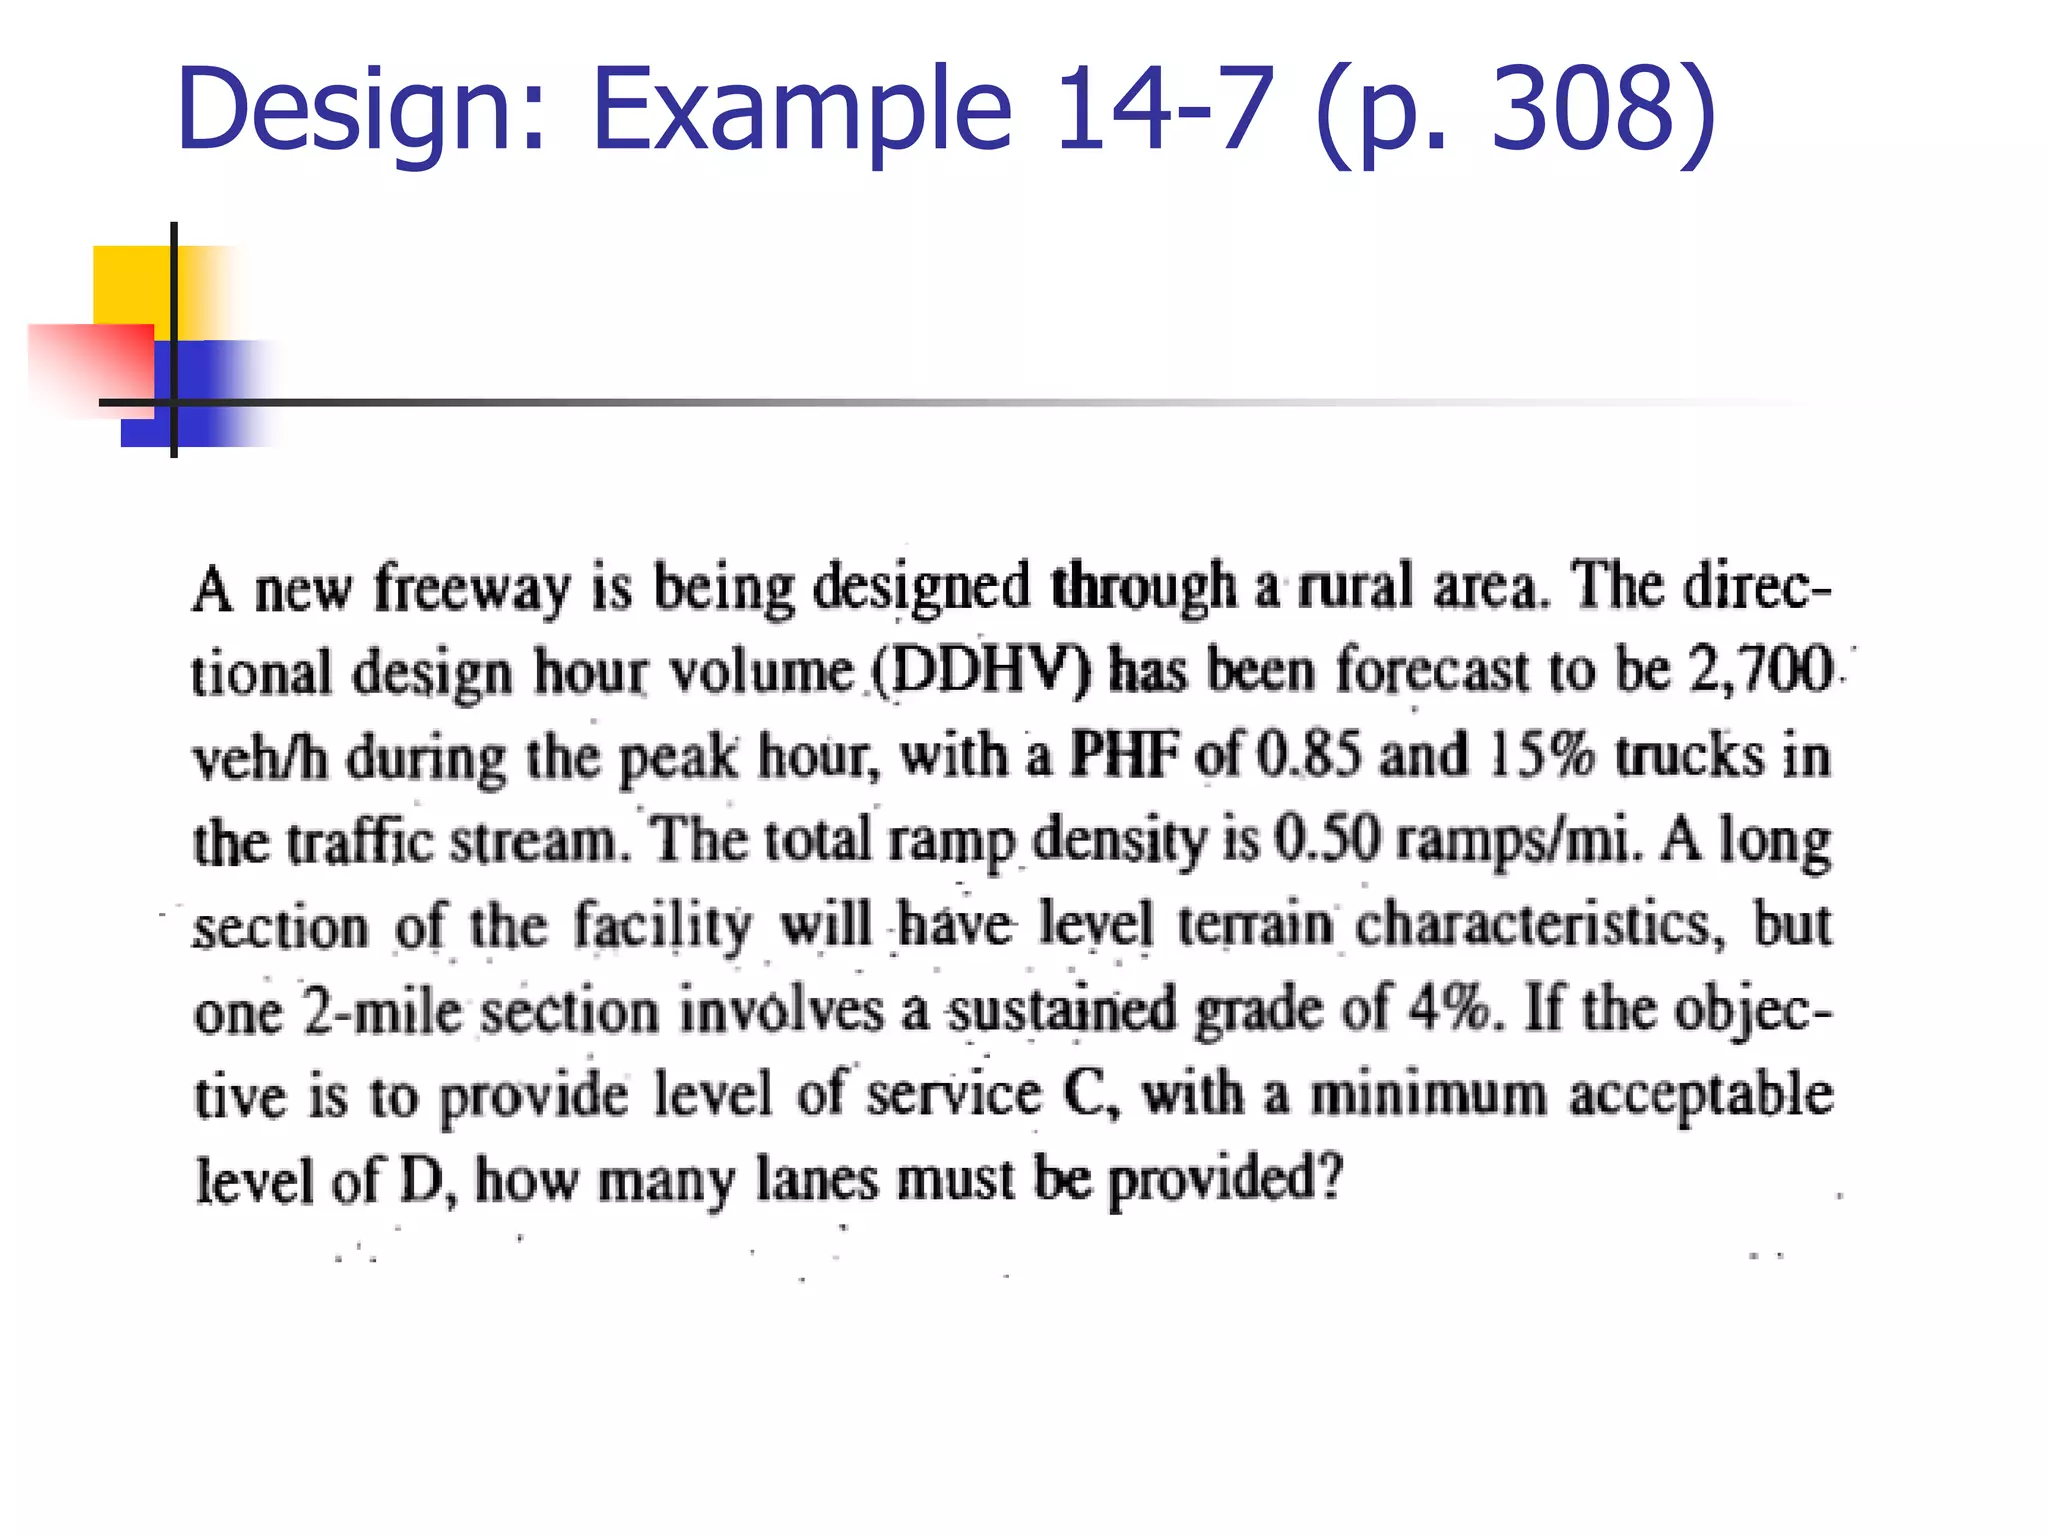
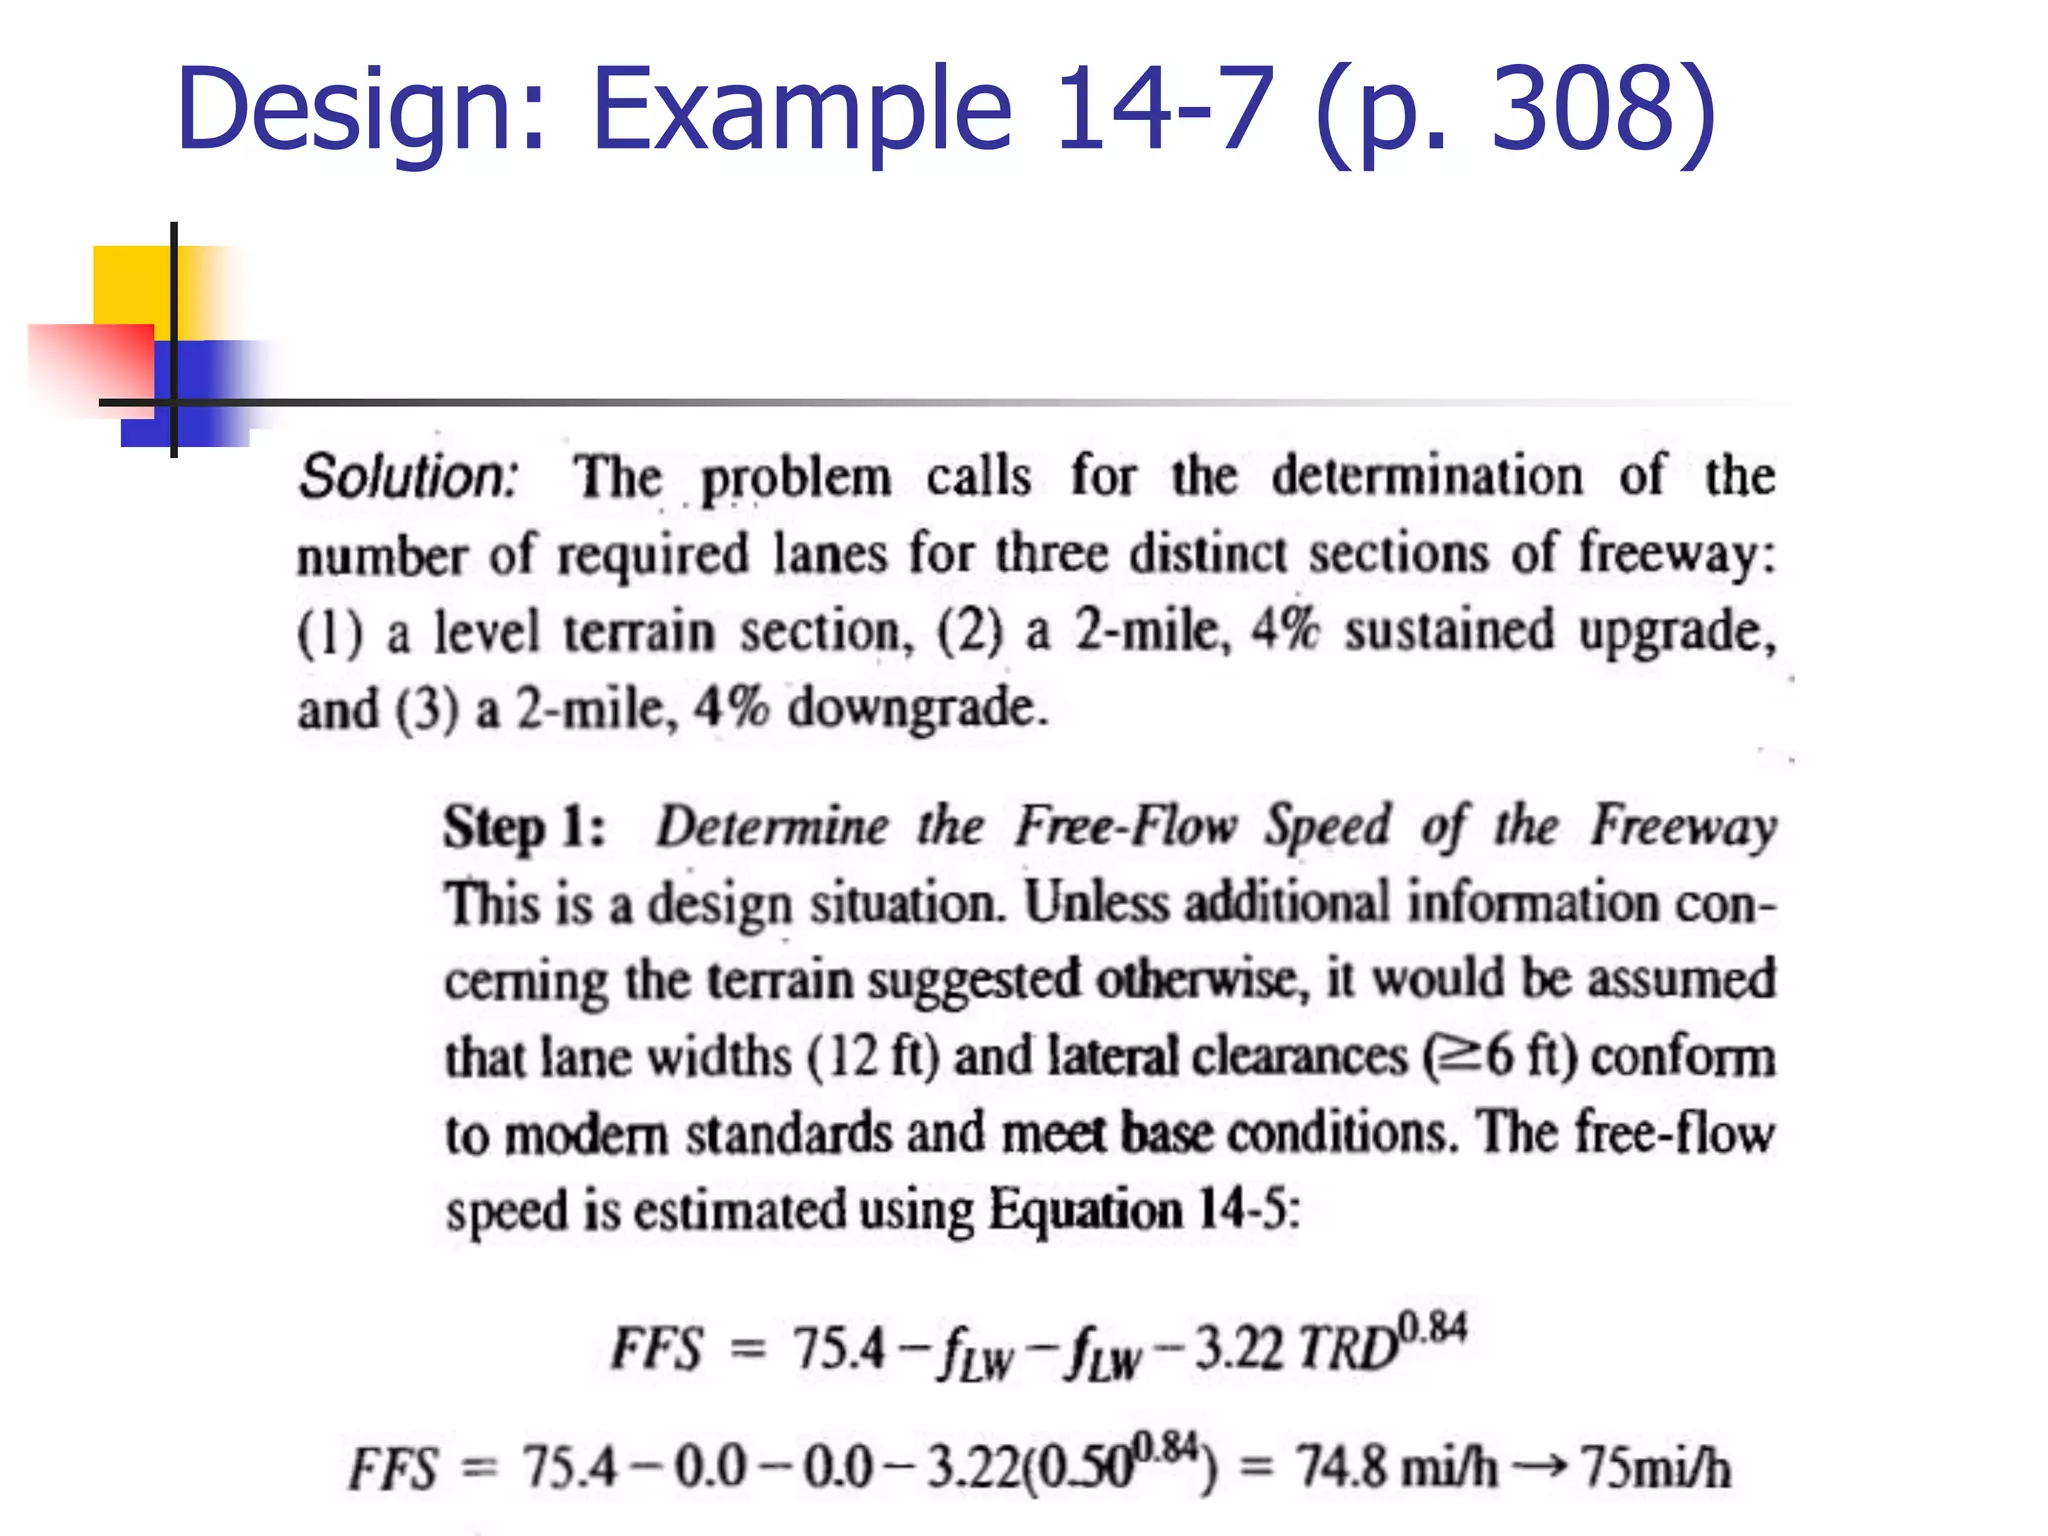
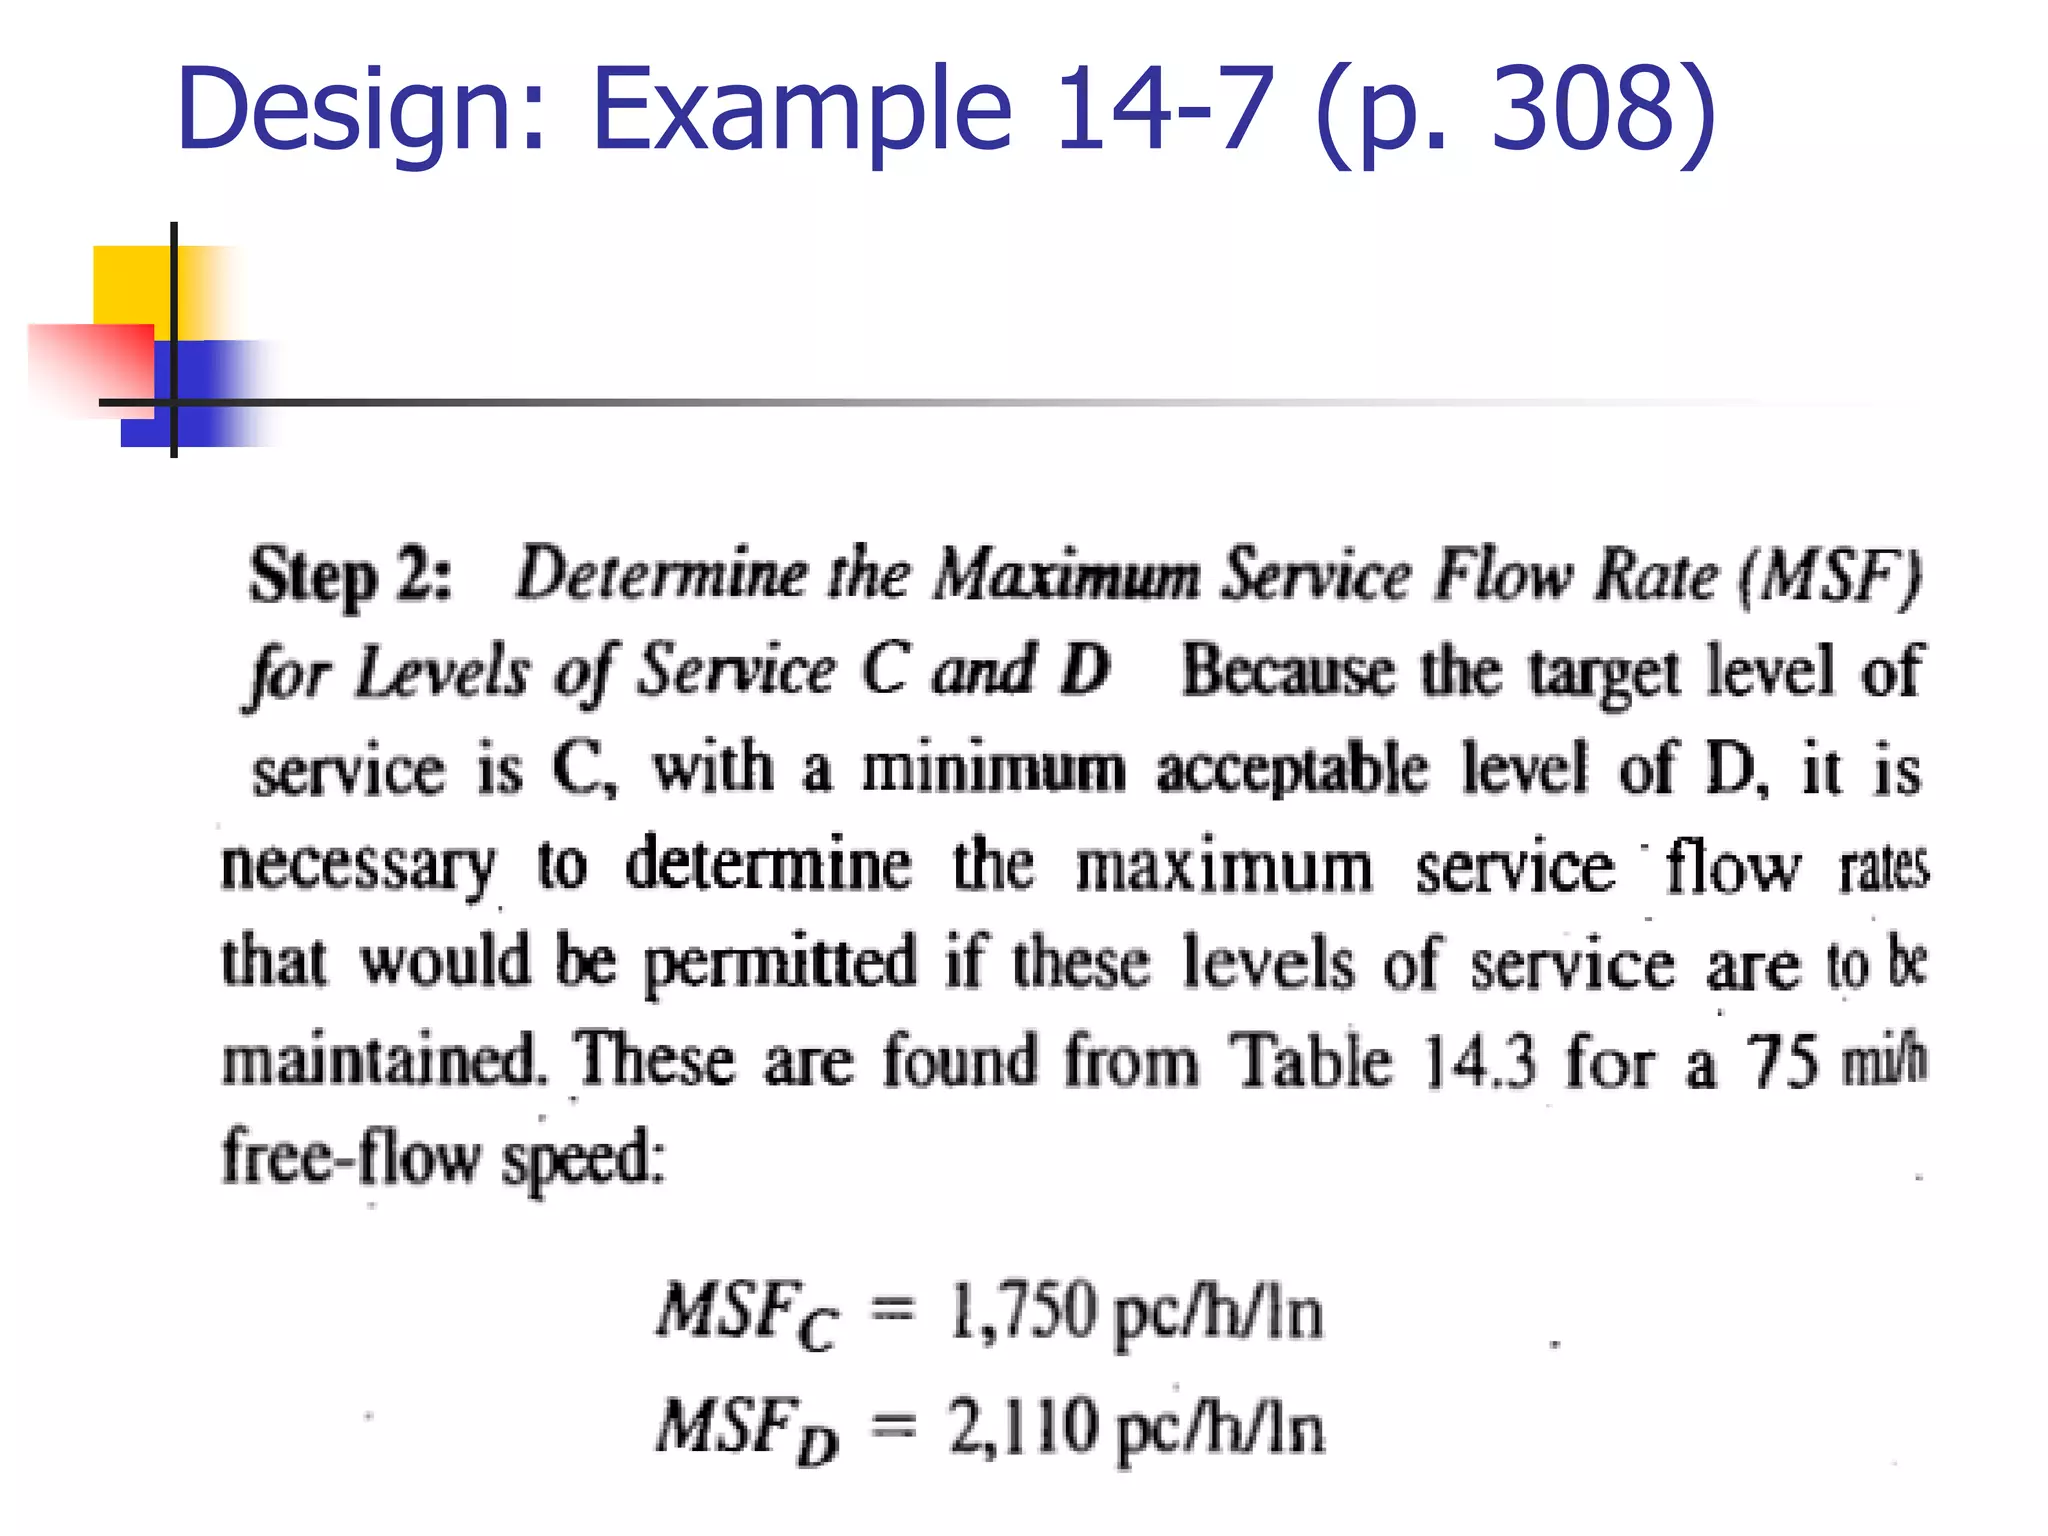
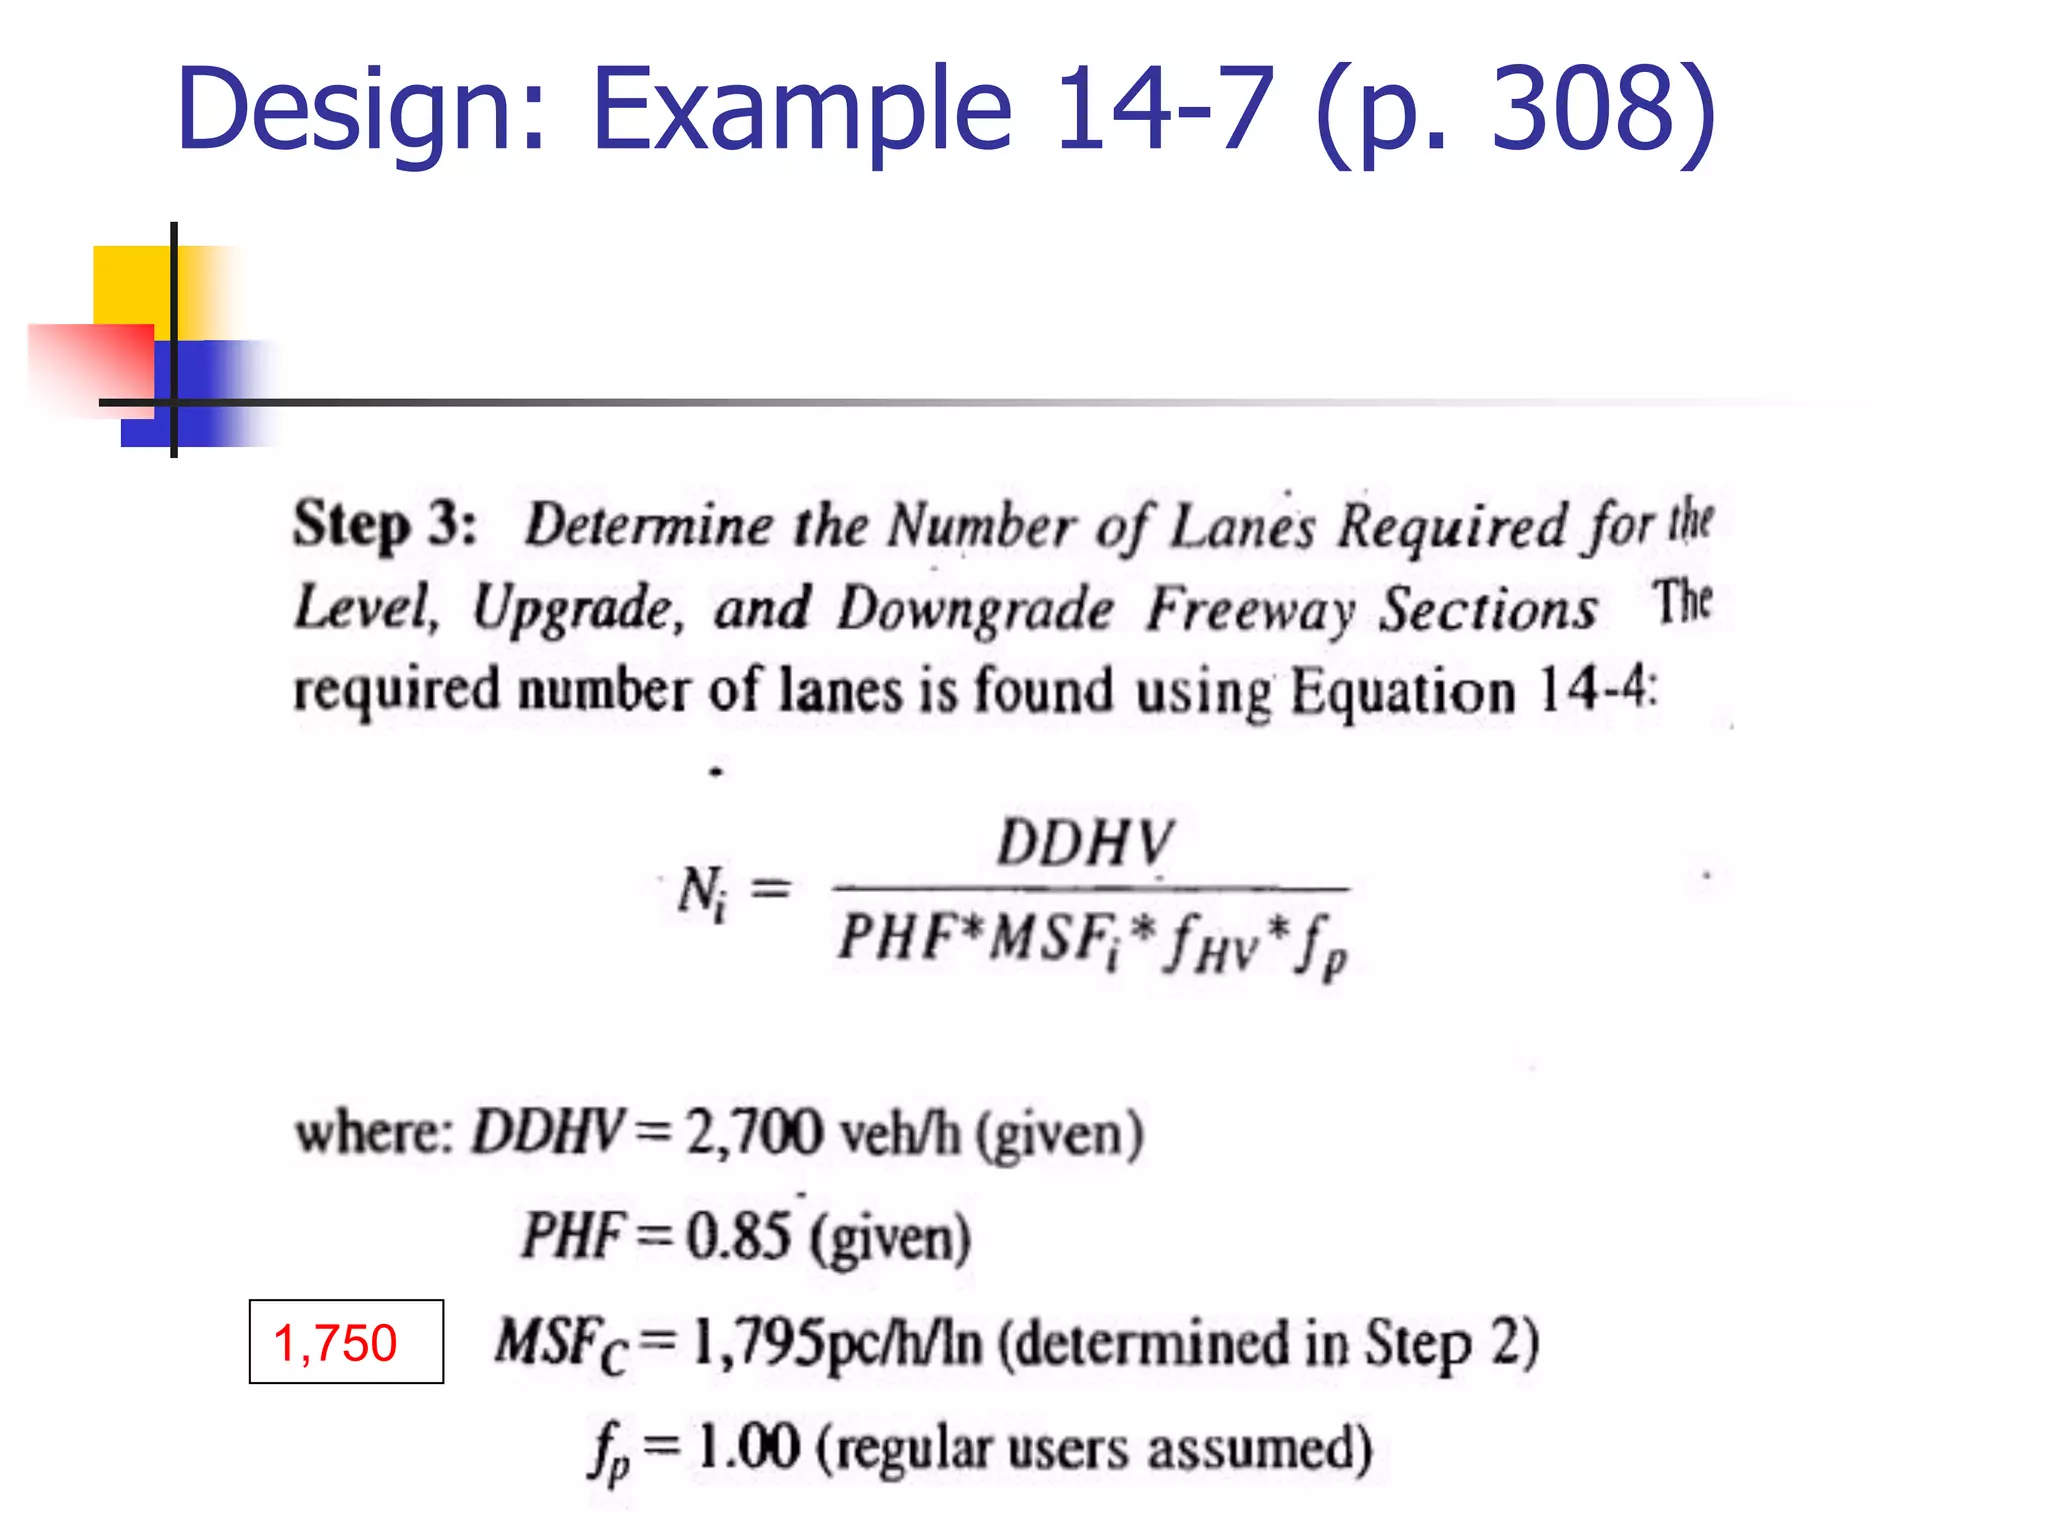
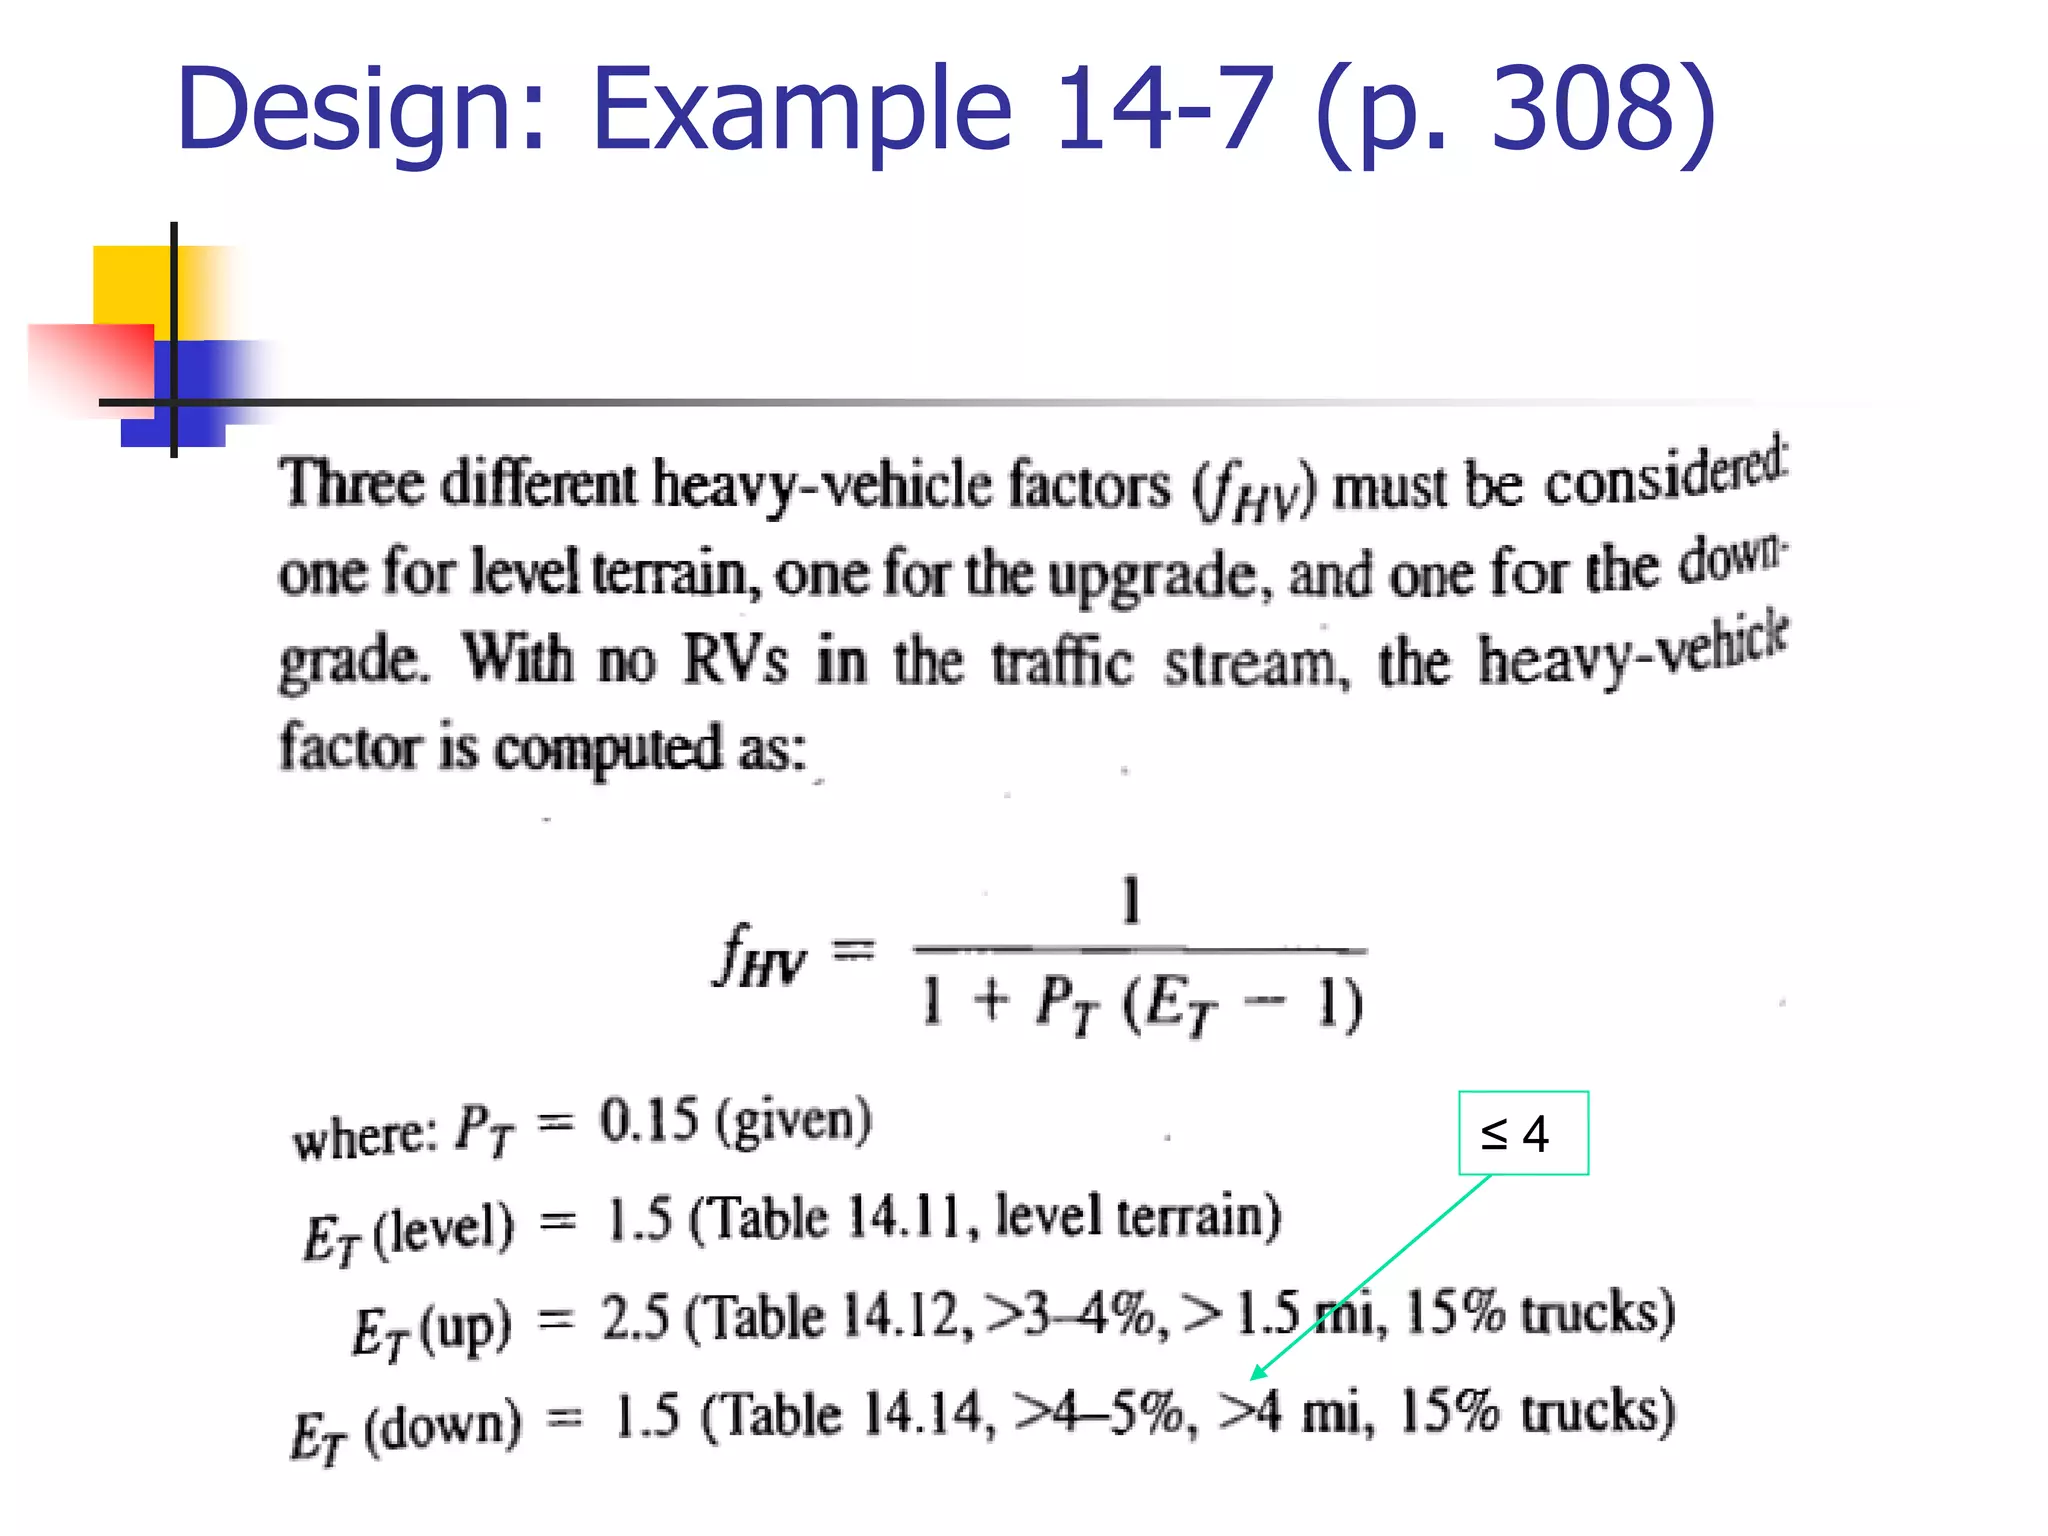
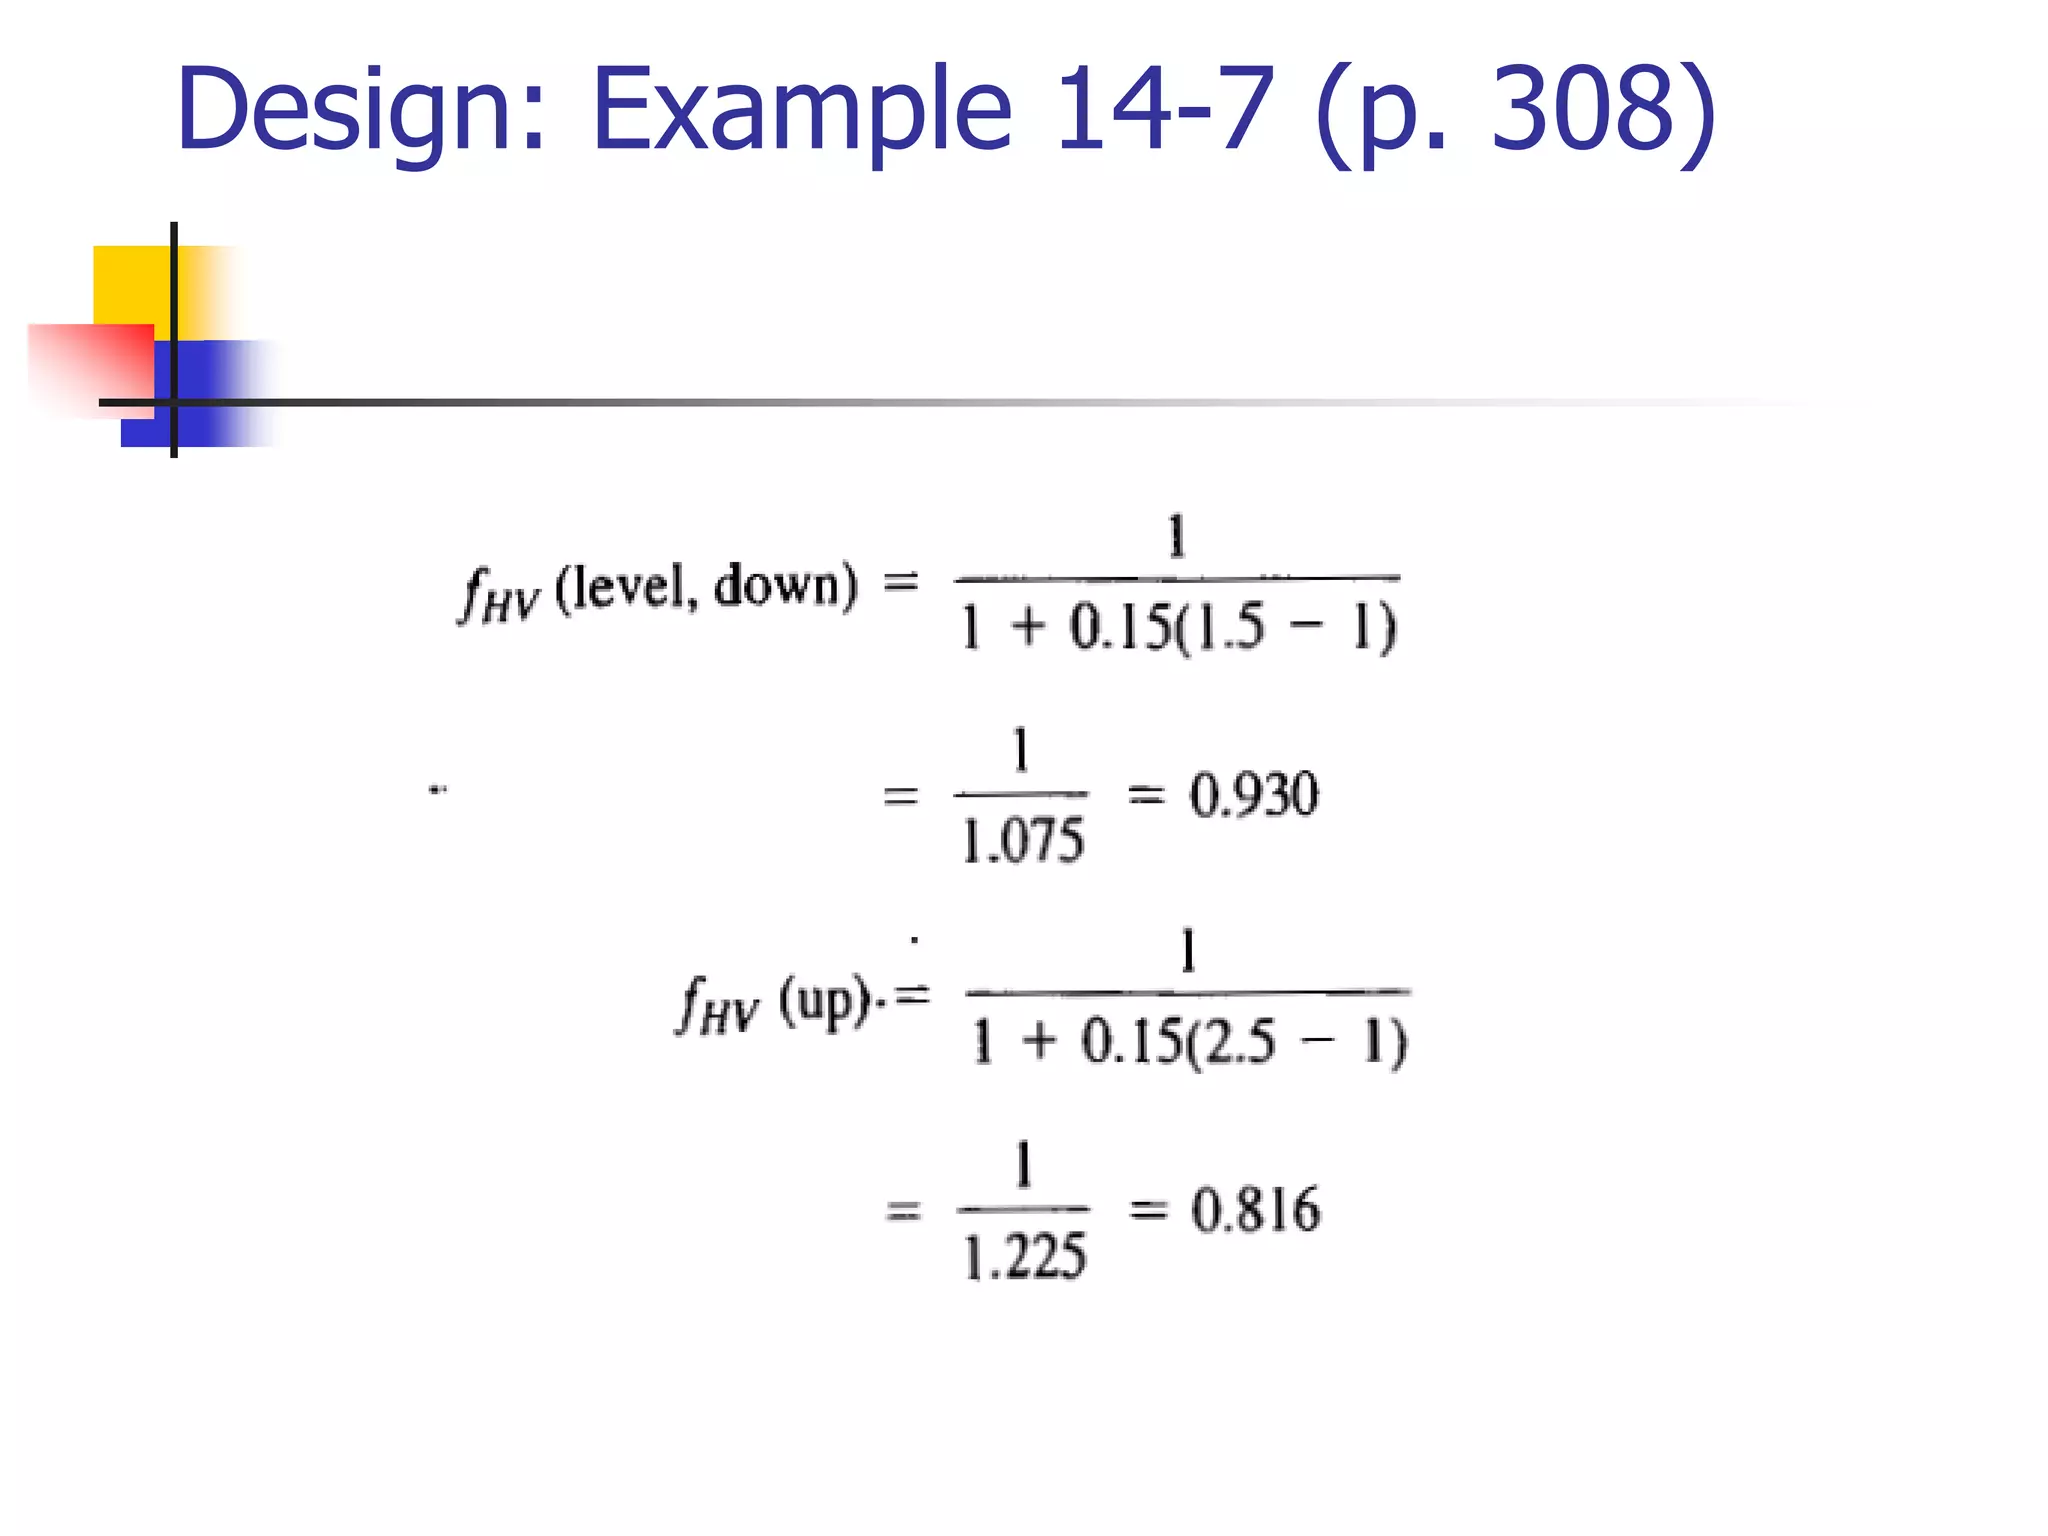
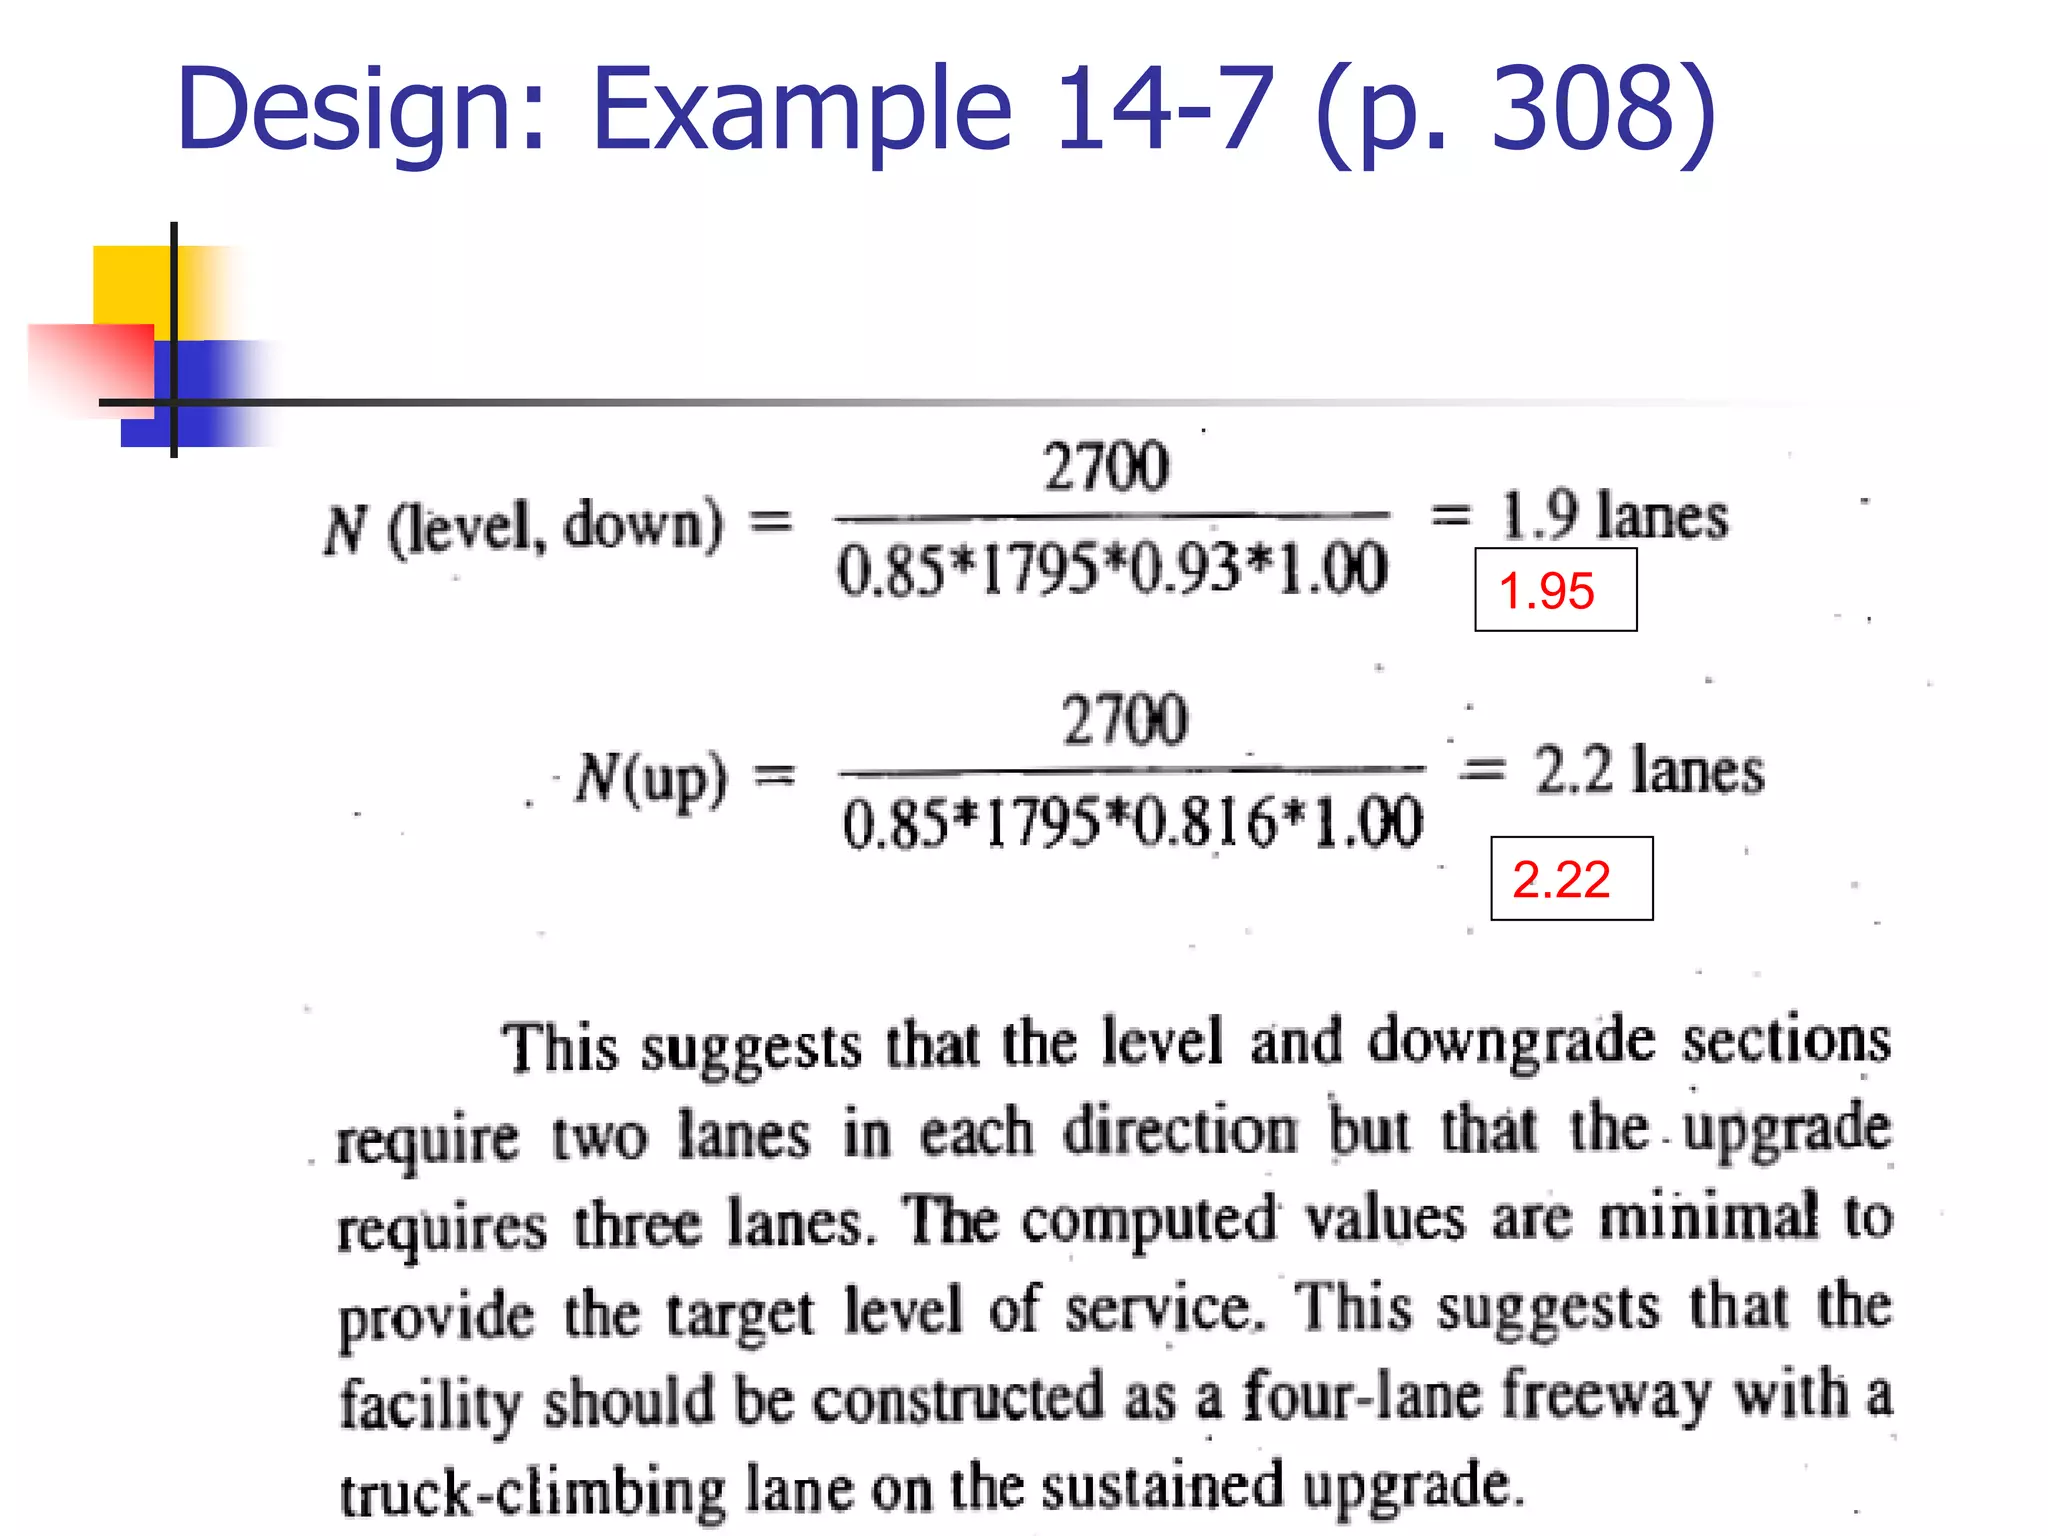
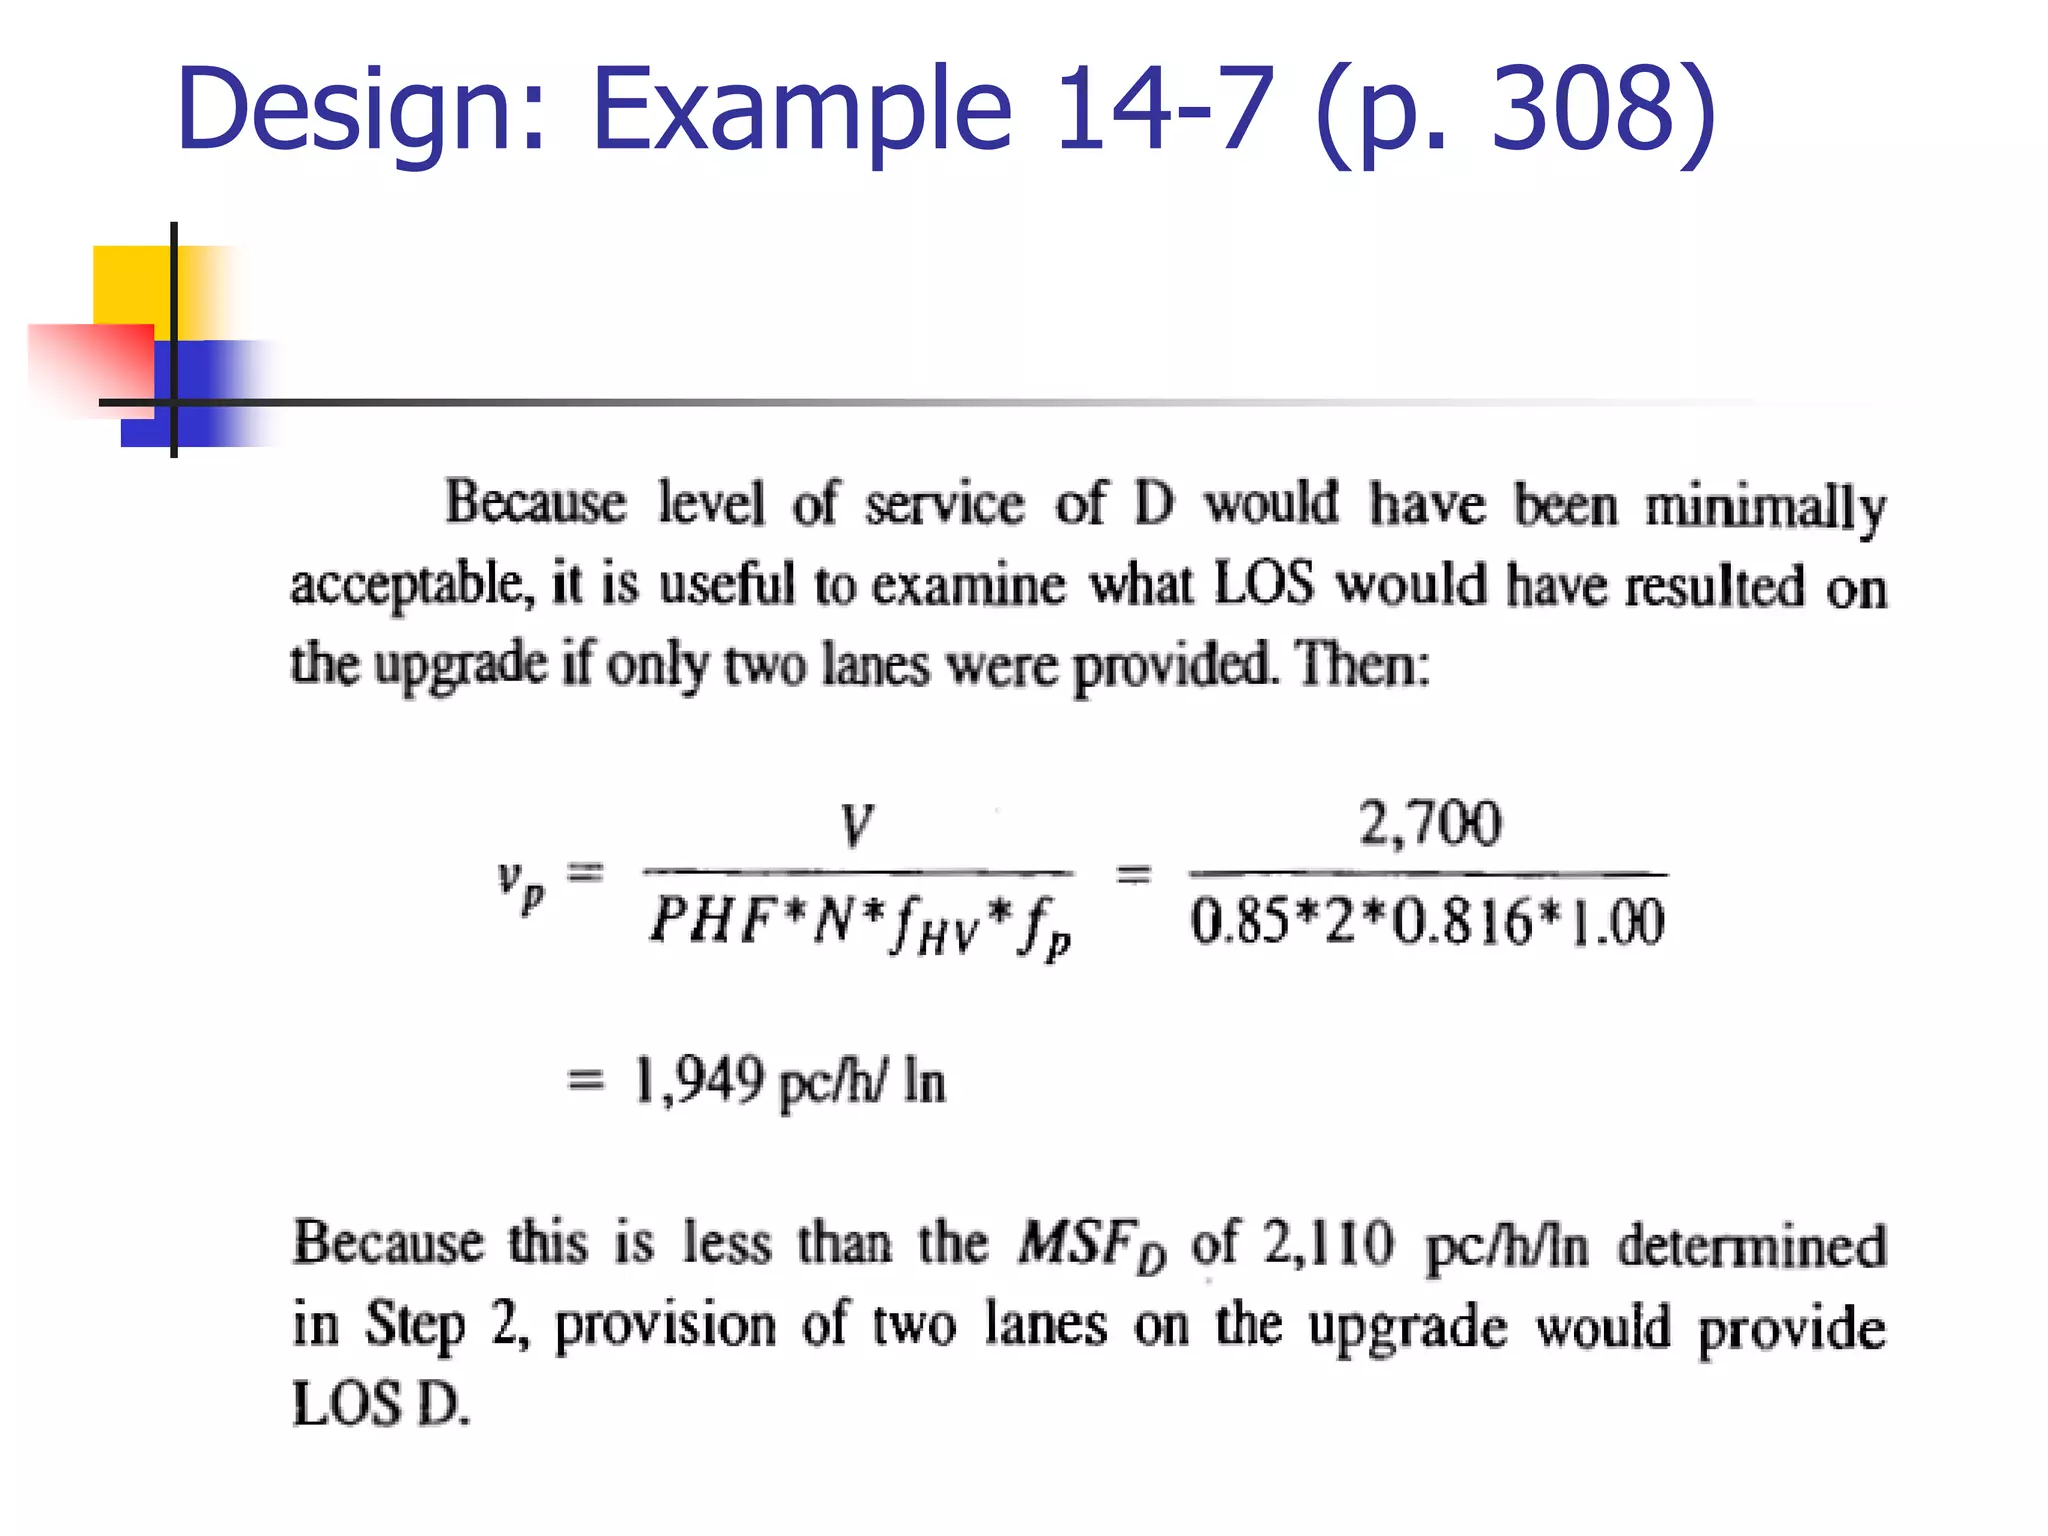
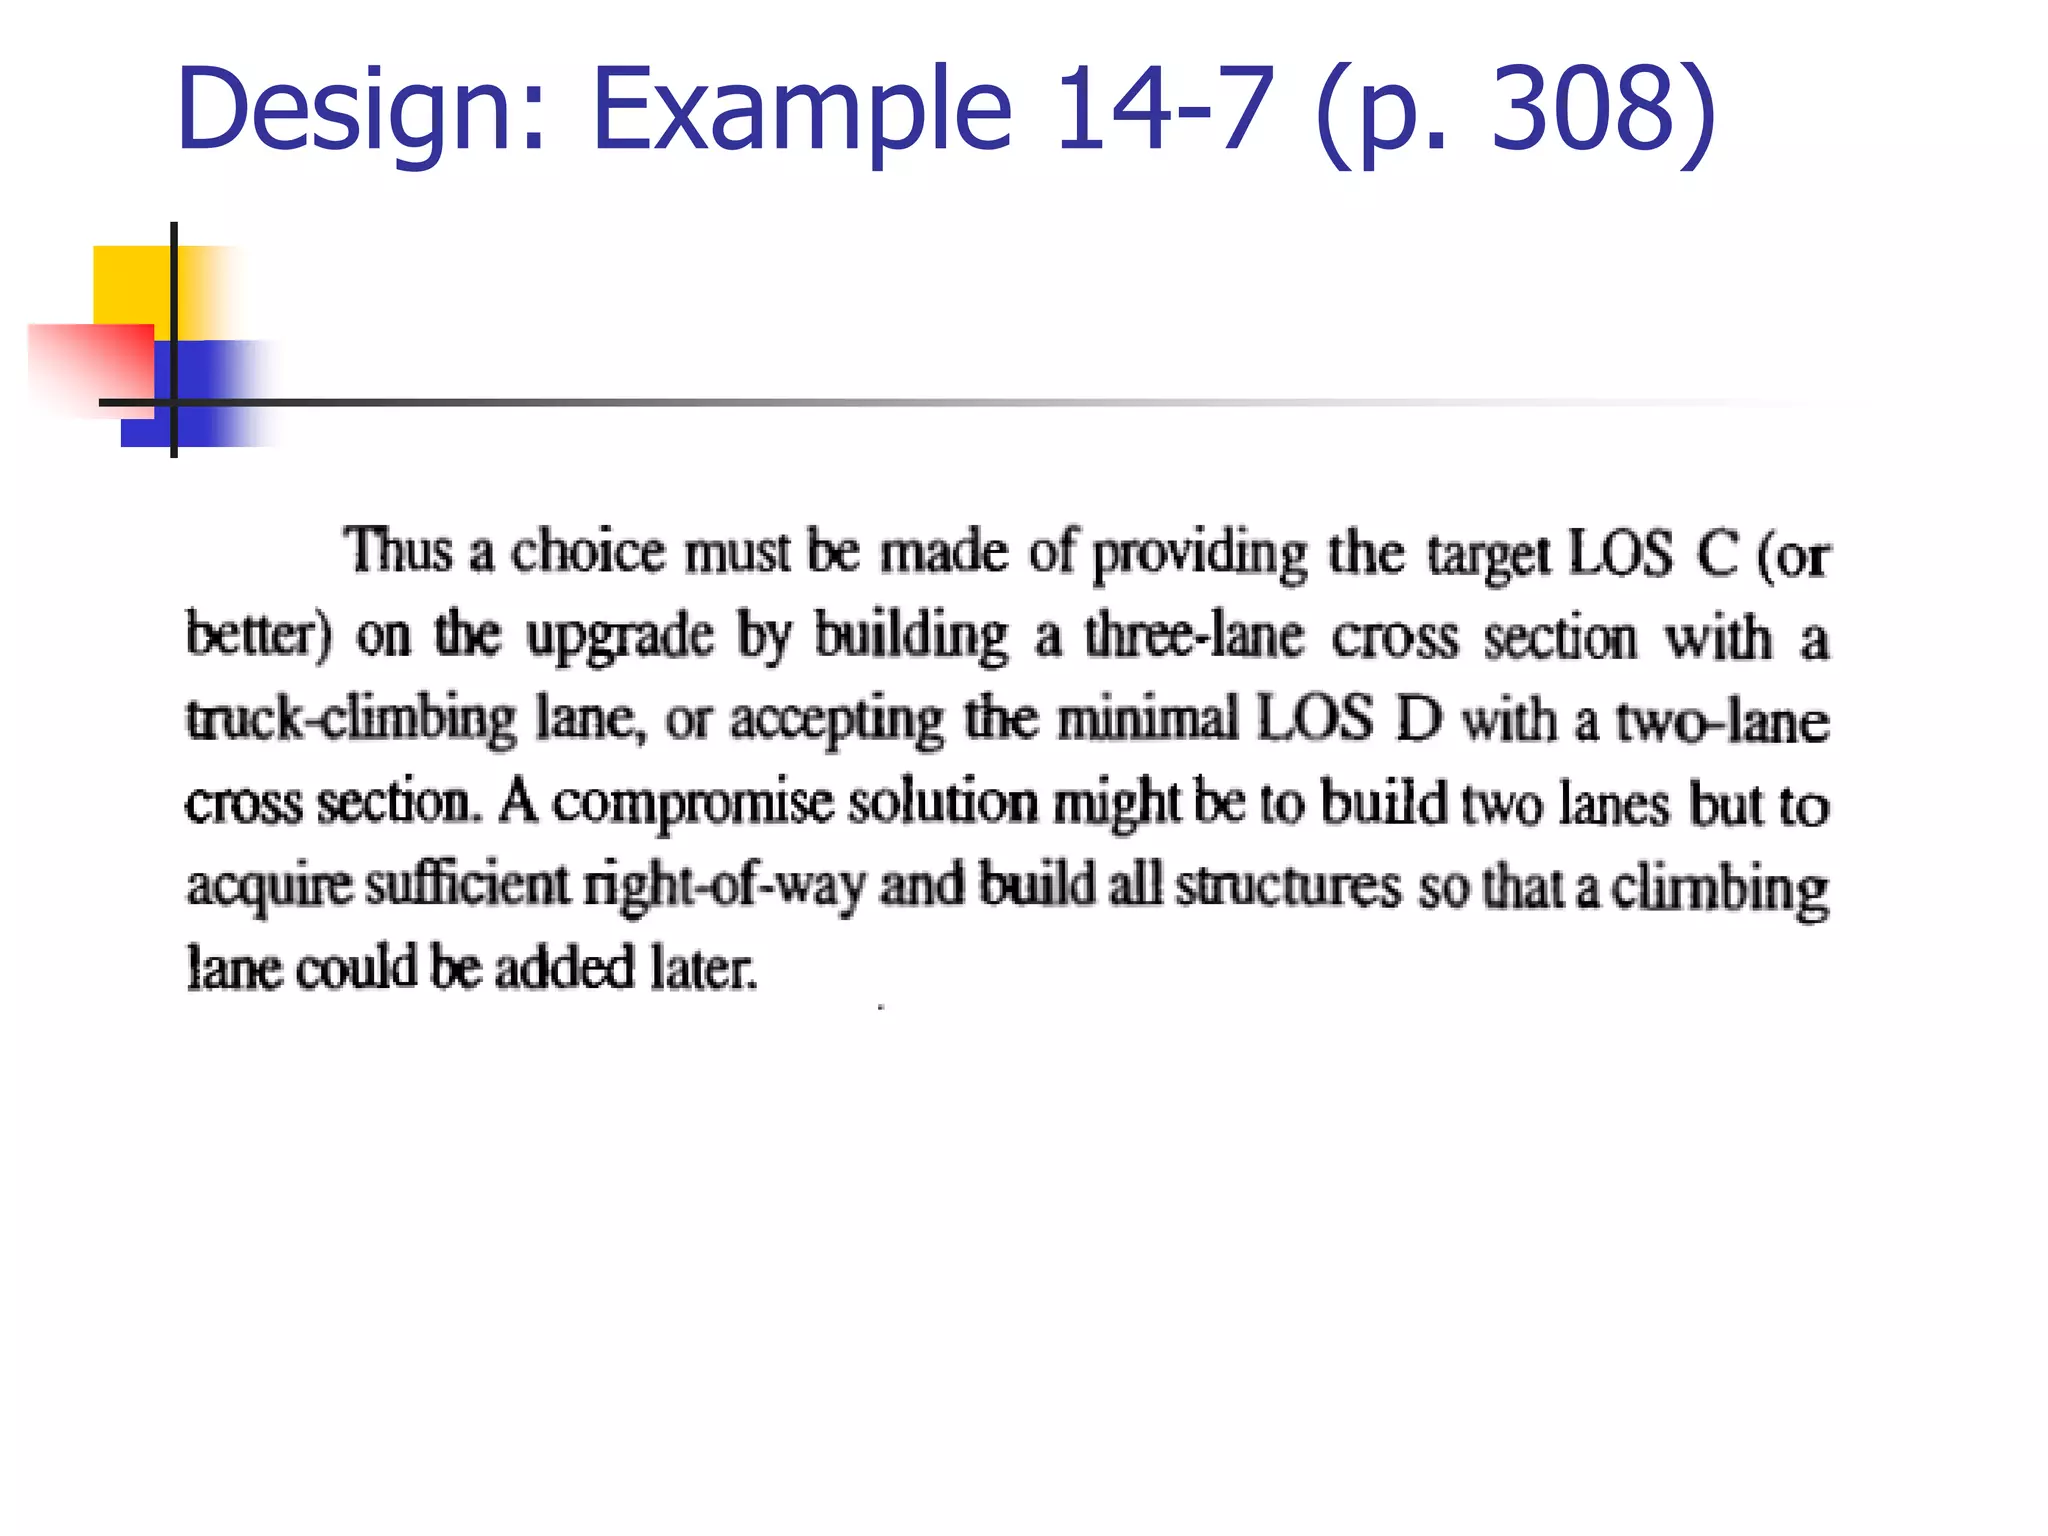
Various practical examples illustrating operational analysis, service flow rate, and design analysis in traffic engineering.
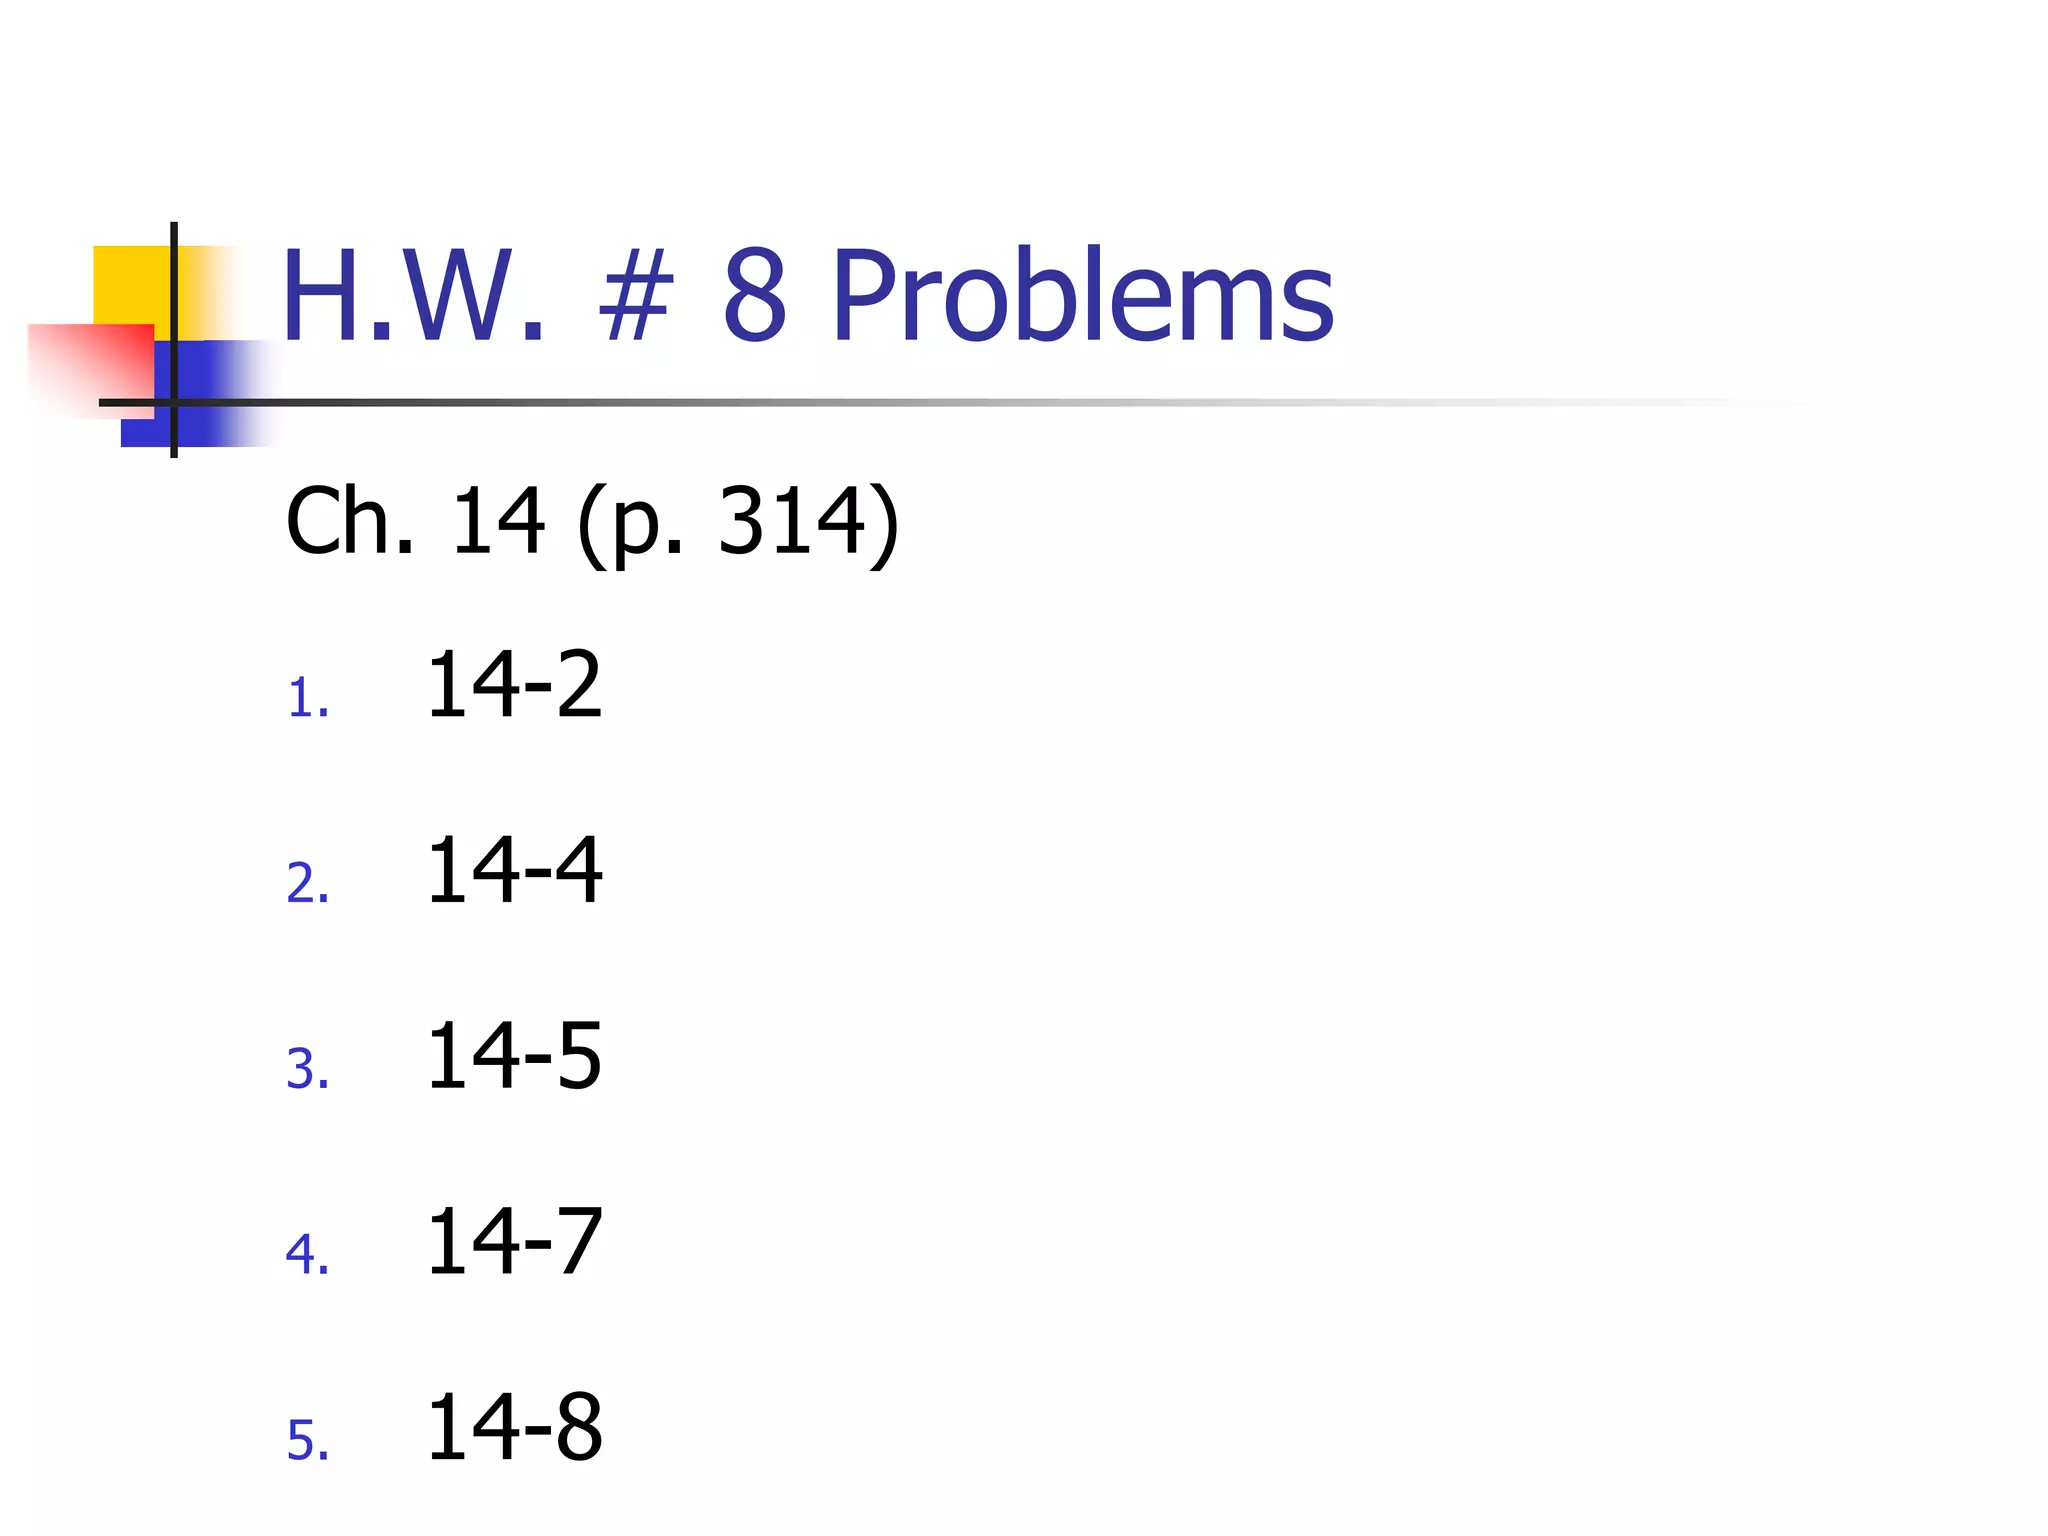
Assignment details featuring problems related to Chapter 14 for further practice in traffic engineering.


![10 Geometric Design of Railway Track [Horizontal Alignment] (Railway Engineer...](https://cdn.slidesharecdn.com/ss_thumbnails/geometricdesignofrailwaytrack-i-200415171932-thumbnail.jpg?width=640&height=640&fit=bounds)

![11 Geometric Design of Railway Track [Vertical Alignment] (Railway Engineerin...](https://cdn.slidesharecdn.com/ss_thumbnails/geometricdesignofrailwaytrack-ii-200415172410-thumbnail.jpg?width=640&height=640&fit=bounds)


