Download to read offline
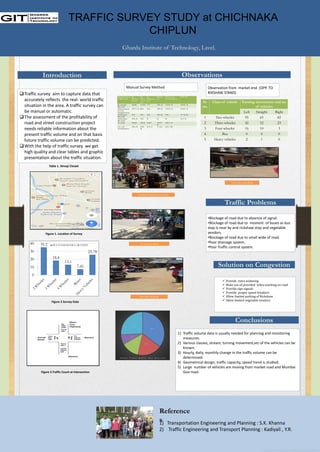
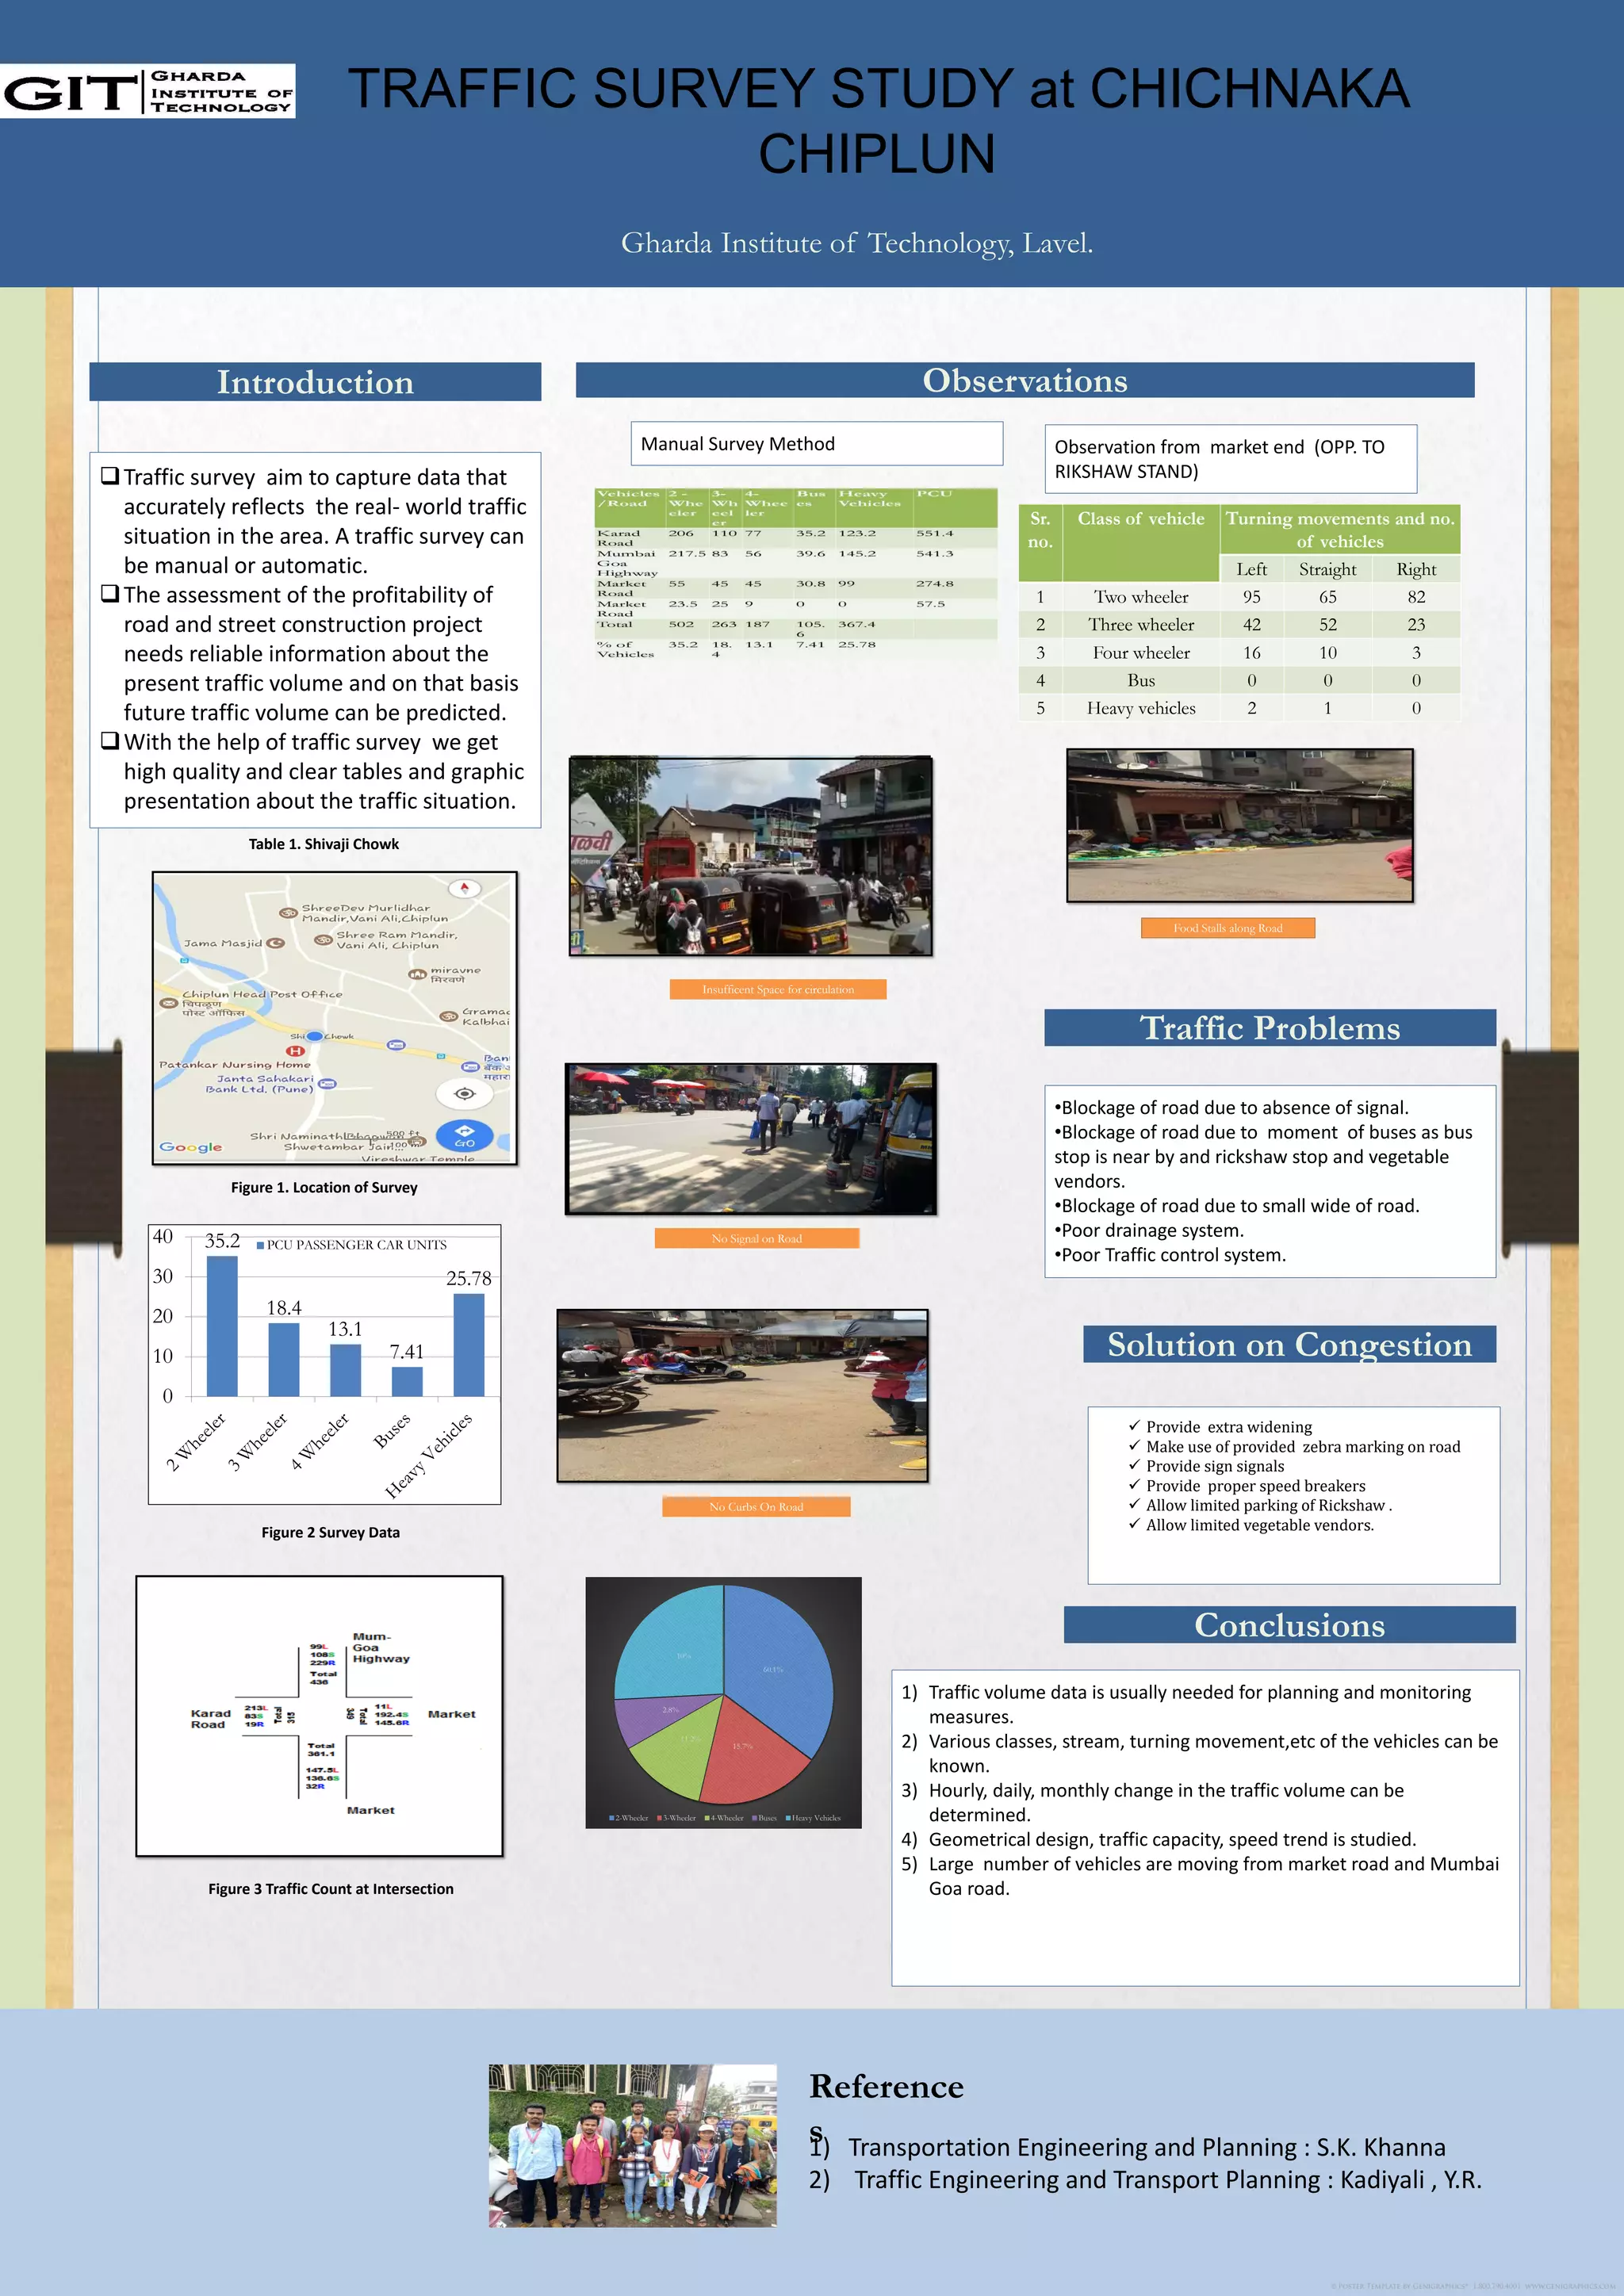
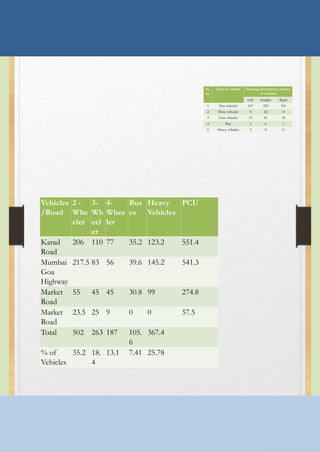

The traffic survey at Chichnaka, Chiplun, highlights issues such as road blockage due to bus stops, narrow roads, and a poor drainage system. Solutions proposed include extra road widening, appropriate traffic signals, and better traffic control. The survey aims to provide accurate data for traffic volume and patterns to inform future transportation planning and construction projects.