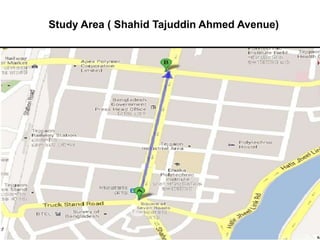
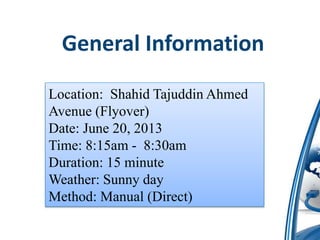
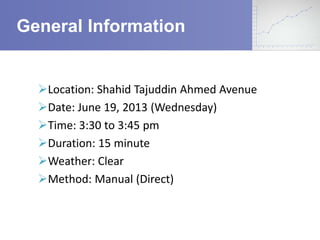
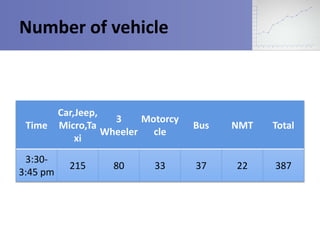
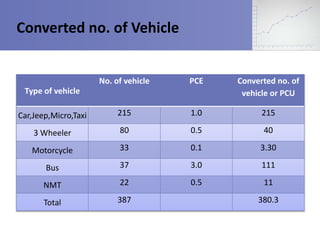
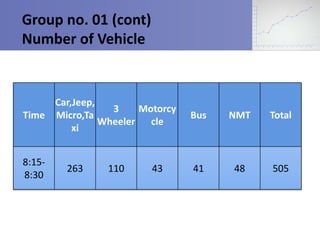
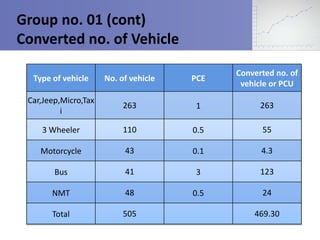
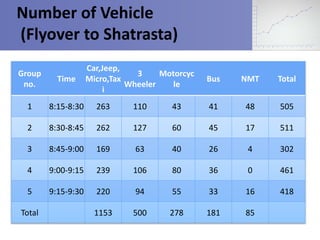
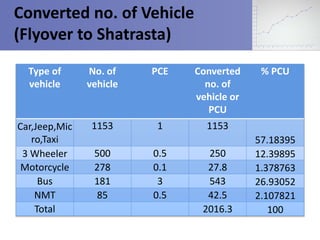
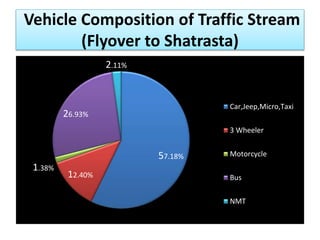
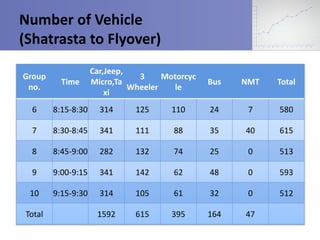
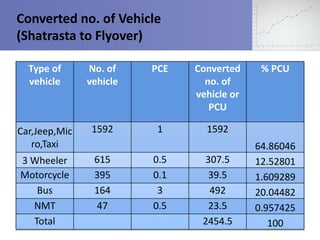
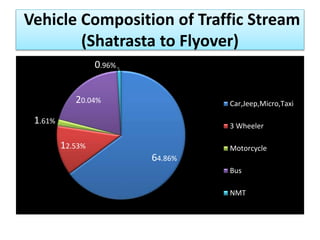
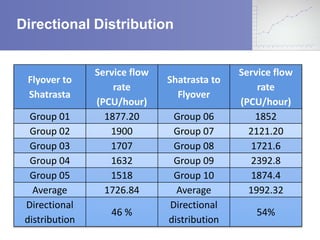
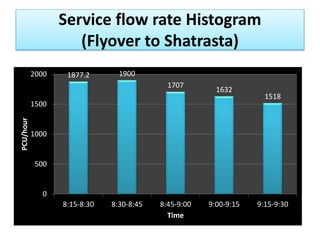
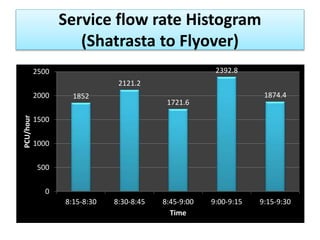
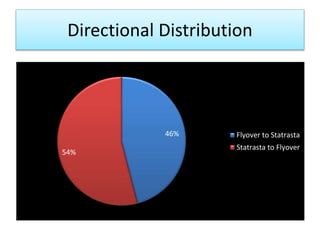
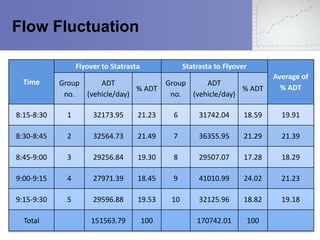
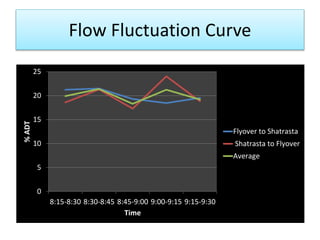
Ahsanullah University of 
Science & Technology 
Department of Civil Engineering 
Transportation Engineering Lab 
4th Year; 2nd Semester 
Sec : A
Presented By 
Group-1 
Md. Abu Sayeed 09.02.03.001 
Maksudul Alim 09.02.03.003 
Abontee Barua 09.02.03.005 
K.M. Tawrat 09.02.03.006 
Wasim Ather 09.02.03.008 
Rezwana Binte Hafiz 09.02.03.053 
Here comes your footer
What is Traffic Study???..... 
Traffic studies may be grouped 
into three main categories: 
(1) Inventories, 
(2) Administrative studies, and 
(3) Dynamic studies.
Traffic Engineering Studies 
– Volume studies 
– Speed studies 
– Travel time studies 
– Delay studies 
– Density studies 
– Accident studies 
– Parking studies 
– Goods movement and transit studies 
– Pedestrian studies 
– Calibration studies 
– Observation studies
Volume Study 
Traffic volume is defined as the number of vehicles 
crossing a section of road per unit time at any 
selected period. Traffic volume studies are 
conducted to collect data on the number of vehicles 
and/or pedestrians that pass a point on a highway 
facility during a specified time period. 
This time period varies from as little as 15 min to 
as much as a year, depending on the anticipated use 
of the data.
To determine of vehicle composition in traffic 
stream. 
To determine the service flow rate in PCU/PCE unit. 
To estimate of ADT based on expansion factor. 
To determine the directional distribution(DD). 
To draw flow fluctuation curves
Effectiveness of a traffic control 
measure 
To check existing, operating service 
condition of a roadway section 
Planning traffic operation and control of 
existing facility 
To design intersection, signal timings, 
channelization 
Structural design of pavements, 
geometric design and road way capacity
Volume Study 
Traffic volume studies are usually 
conducted when certain volume 
characteristics are needed, some of 
which follow: 
oAverage Annual Daily Traffic (AADT) 
oAverage Daily Traffic (ADT) 
oPeak Hour Volume (PHV) 
oVehicle Classification (VC) 
oVehicle Miles of Travel (VMT)
DEFINITIONS AND USEFUL 
PARAMETRS
Definitions & Useful 
Parameters 
• Volume: 
Volume on a road is the number of vehicles passing the 
measurement point during a specified time interval. 
• Demand: 
is a measure of the number of vehicles (or passengers, or 
persons) waiting for service in the given time period. 
• Capacity: 
is the maximum number that can reasonable be expected to 
be served in the given time period.
Definitions & Useful Parameters 
• PCE: 
Passenger Car Equivalent is essentially the 
impact that a mode of transport has on traffic 
variables (such as headway, speed, density) 
compared to a single car 
• PCU: 
It is a vehicle unit used for expressing highway 
capacity unit
Definitions & Useful 
Parameters 
• Daily Volumes: 
A common time interval for volumes is a day. 
• Daily volumes are frequently used as the basis 
for highway planning and general observations 
of trends.
Daily Volume 
commonly used daily volume parameters 
Average Annual Daily Traffic (AADT) 
the average of 24-hour counts collected every day 
of the year. 
Average Daily Traffic (ADT) 
the average of 24-hour counts collected over a 
number of days greater than one but less than a 
year.
Peak Hour Volume (PHV) 
the maximum number of vehicles that pas a point 
on a highway during a period of 60 consecutive 
minutes. 
Vehicle Classification (VC) with respect to the type of 
vehicles for cars, two-axle trucks, or three-axle 
trucks. 
Here comes your footer 
Flow Rate 
Vehicles/ 15 min expanded to 1 hour
Factors 
 Hourly expansion factors (HEFs) are determined 
by the formula 
 Daily expansion factors (DEFs) are computed 
as
Definitions (cont…) 
• Directional Distribution 
Directional Distribution is the predominant 
one-way traffic volume expressed as a 
percentage of two-way traffic
Methods of counting volume 
PowerPlugs 
Templates for PowerPoint
The two basic methods of 
counting traffic are: 
 Manual observation 
 Automatic recording
Manual observation…… 
Most applications of manual counts require 
small samples of data at any given location. 
Manual counts are 
sometimes used when the effort and expense 
of automated equipment are not justified
Mechanical count 
board 
Electronic count 
board
Manual observation…… 
Tally Sheets 
Recording data onto tally sheets is the simplest means of 
conducting manual counts. The data can be recorded 
with a tick mark on a pre-prepared field form. A watch or 
stopwatch is necessary to measure the desired count 
interval
Automatic recording 
Methods of counting volume… 
Permanent Counters 
Portable Counters
Video Recording 
Automatic counting
Types of Volume Counts 
Cordon Counts 
Screen Line Counts 
Intersection Counts
Types of Volume Counts 
Pedestrian Volume counts 
Periodic Volume counts
Cordon 
Counts
Screen 
Line 
Counts
Inters 
ection 
Count 
s
Study Area ( Shahid Tajuddin Ahmed Avenue)
General Information 
Location: Shahid Tajuddin Ahmed 
Avenue (Flyover) 
Date: June 20, 2013 
Time: 8:15am - 8:30am 
Duration: 15 minute 
Weather: Sunny day 
Method: Manual (Direct)
Car 
Bus 
Motorbike 
CNG 
Microbus/ 
Pajero
DATA COLLECTION AND 
ANALYSIS
RECONNAISSANCE SURVEY
General Information 
Location: Shahid Tajuddin Ahmed Avenue 
Date: June 19, 2013 (Wednesday) 
Time: 3:30 to 3:45 pm 
Duration: 15 minute 
Weather: Clear 
Method: Manual (Direct)
Number of vehicle 
Time 
Car,Jeep, 
Micro,Ta 
xi 
3 
Wheeler 
Motorcy 
cle 
Bus NMT Total 
3:30- 
3:45 pm 
215 80 33 37 22 387
Converted no. of Vehicle 
Type of vehicle 
No. of vehicle PCE Converted no. of 
vehicle or PCU 
Car,Jeep,Micro,Taxi 215 1.0 215 
3 Wheeler 80 0.5 40 
Motorcycle 33 0.1 3.30 
Bus 37 3.0 111 
NMT 22 0.5 11 
Total 387 380.3
 Rate of Flow = 380.30 vehicle/15 
min 
 Service flow rate of Reconnaissance 
survey 
= 380.30*4 
= 1521.20 vehicle/hour
FINAL SURVEY
Field activities and Time distribution
General Information 
Group no. 01 
 Location: Shahid Tajuddin Ahmed Avenue 
Date: June 20, 2013 (Thursday) 
 Time: 8:15 to 8:30 am 
Duration: 15 minute 
 Weather: Clear 
 Method: Manual (Direct)
Group no. 01 (cont) 
Number of Vehicle 
Time 
Car,Jeep, 
Micro,Ta 
xi 
3 
Wheeler 
Motorcy 
cle 
Bus NMT Total 
8:15- 
8:30 
263 110 43 41 48 505
Group no. 01 (cont) 
Converted no. of Vehicle 
Type of vehicle No. of vehicle PCE 
Converted no. of 
vehicle or PCU 
Car,Jeep,Micro,Tax 
i 
263 1 263 
3 Wheeler 110 0.5 55 
Motorcycle 43 0.1 4.3 
Bus 41 3 123 
NMT 48 0.5 24 
Total 505 469.30
Group no. 01 (cont) 
 Rate of Flow = 469.30 vehicle/15 min 
 Service flow rate = Rate of Flow * 4 
= 469.3*4 
= 1877.20 vehicle/hour
Group no. 01 (cont) 
 Hourly expansion factor, HEF = 17.11 
 Daily volume of traffic 
= Service flow rate*HEF 
= 1877.20*17.11 
= 32118.892 vehicle/day
Group no. 01 (cont) 
 Daily expansion factor, DEF = 7.012 
 Weekly volume of traffic 
= Daily volume of traffic*DEF 
= 32118.892*7.012m 
= 225217.67 vehicle/week
Group no. 01 (cont) 
 Average daily traffic, ADT 
= Weekly volume of traffic/7 
= 225217.67/7 
= 32173.95 vehicle/day
Group no. 01 (cont) 
 Annual average daily traffic 
= ADT*1.395 
= 32173.95*1.395 
= 44882.66 vehicle/day
Number of Vehicle 
(Flyover to Shatrasta) 
Group 
no. 
Time 
Car,Jeep, 
Micro,Tax 
i 
3 
Wheeler 
Motorcyc 
le 
Bus NMT Total 
1 8:15-8:30 263 110 43 41 48 505 
2 8:30-8:45 262 127 60 45 17 511 
3 8:45-9:00 169 63 40 26 4 302 
4 9:00-9:15 239 106 80 36 0 461 
5 9:15-9:30 220 94 55 33 16 418 
Total 1153 500 278 181 85
Converted no. of Vehicle 
(Flyover to Shatrasta) 
Type of 
vehicle 
No. of 
vehicle 
PCE Converted 
no. of 
vehicle or 
PCU 
% PCU 
Car,Jeep,Mic 
ro,Taxi 
1153 1 1153 
57.18395 
3 Wheeler 500 0.5 250 12.39895 
Motorcycle 278 0.1 27.8 1.378763 
Bus 181 3 543 26.93052 
NMT 85 0.5 42.5 2.107821 
Total 2016.3 100
Vehicle Composition of Traffic Stream 
(Flyover to Shatrasta) 
57.18% 
12.40% 
1.38% 
26.93% 
2.11% 
Car,Jeep,Micro,Taxi 
3 Wheeler 
Motorcycle 
Bus 
NMT
Number of Vehicle 
(Shatrasta to Flyover) 
Group 
no. 
Time 
Car,Jeep, 
Micro,Ta 
xi 
3 
Wheeler 
Motorcyc 
le 
Bus NMT Total 
6 8:15-8:30 314 125 110 24 7 580 
7 8:30-8:45 341 111 88 35 40 615 
8 8:45-9:00 282 132 74 25 0 513 
9 9:00-9:15 341 142 62 48 0 593 
10 9:15-9:30 314 105 61 32 0 512 
Total 1592 615 395 164 47
Converted no. of Vehicle 
(Shatrasta to Flyover) 
Type of 
vehicle 
No. of 
vehicle 
PCE Converted 
no. of 
vehicle or 
PCU 
% PCU 
Car,Jeep,Mic 
ro,Taxi 
1592 1 1592 
64.86046 
3 Wheeler 615 0.5 307.5 12.52801 
Motorcycle 395 0.1 39.5 1.609289 
Bus 164 3 492 20.04482 
NMT 47 0.5 23.5 0.957425 
Total 2454.5 100
Vehicle Composition of Traffic Stream 
(Shatrasta to Flyover) 
64.86% 
12.53% 
1.61% 
0.96% 
20.04% 
Car,Jeep,Micro,Taxi 
3 Wheeler 
Motorcycle 
Bus 
NMT
Flyover to 
Shatrasta 
Service flow 
rate 
(PCU/hour) 
Shatrasta to 
Flyover 
Service flow 
rate 
(PCU/hour) 
Group 01 1877.20 Group 06 1852 
Group 02 1900 Group 07 2121.20 
Group 03 1707 Group 08 1721.6 
Group 04 1632 Group 09 2392.8 
Group 05 1518 Group 10 1874.4 
Average 1726.84 Average 1992.32 
Directional 
Directional 
46 % 
54% 
distribution 
distribution 
Directional Distribution
Service flow rate Histogram 
(Flyover to Shatrasta) 
1877.2 1900 
1707 
1632 
1518 
2000 
1500 
1000 
500 
0 
8:15-8:30 8:30-8:45 8:45-9:00 9:00-9:15 9:15-9:30 
PCU/hour 
Time
Service flow rate Histogram 
(Shatrasta to Flyover) 
1852 
2121.2 
1721.6 
2392.8 
1874.4 
2500 
2000 
1500 
1000 
500 
0 
8:15-8:30 8:30-8:45 8:45-9:00 9:00-9:15 9:15-9:30 
PCU/hour 
Time
Directional Distribution 
46% 
54% 
Flyover to Statrasta 
Statrasta to Flyover
Flow Fluctuation 
Time 
Flyover to Statrasta Statrasta to Flyover 
Average of 
% ADT 
Group 
no. 
ADT 
(vehicle/day) 
% ADT 
Group 
no. 
ADT 
(vehicle/day) 
% ADT 
8:15-8:30 1 32173.95 21.23 6 31742.04 18.59 19.91 
8:30-8:45 2 32564.73 21.49 7 36355.95 21.29 21.39 
8:45-9:00 3 29256.84 19.30 8 29507.07 17.28 18.29 
9:00-9:15 4 27971.39 18.45 9 41010.99 24.02 21.23 
9:15-9:30 5 29596.88 19.53 10 32125.96 18.82 19.18 
Total 151563.79 100 170742.01 100
Flow Fluctuation Curve 
25 
20 
15 
10 
5 
0 
8:15-8:30 8:30-8:45 8:45-9:00 9:00-9:15 9:15-9:30 
% ADT 
Time 
Flyover to Shatrasta 
Shatrasta to Flyover 
Average
Recommendations 
Only 26% of total vehicles were Buses. 
Public transport should be increased and improved.
Recommendations 
5% of total vehicles were Non-motorized vehicles. 
A dedicated lane should be provided to facilitate non-motorized 
vehicle.
Recommendations 
39% of total vehicles were private cars. To reduce the number 
of private cars two steps can be taken- 
• Introducing TollsHOTCongestion pricing along some specific 
urban roadways. 
• Introducing parking permits and restricting parking space.
Recommendations 
In order to pick up and drop off passengers, bus-lay-by 
should be provided.
Operated manual counting without a single Hand 
Counter. 
No provision for cross check in the manual 
method. 
No vantage location from where video method 
could be used to collect data.
Thank 
You…….

road widening

  • 1.
    Ahsanullah University of Science & Technology Department of Civil Engineering Transportation Engineering Lab 4th Year; 2nd Semester Sec : A
  • 2.
    Presented By Group-1 Md. Abu Sayeed 09.02.03.001 Maksudul Alim 09.02.03.003 Abontee Barua 09.02.03.005 K.M. Tawrat 09.02.03.006 Wasim Ather 09.02.03.008 Rezwana Binte Hafiz 09.02.03.053 Here comes your footer
  • 4.
    What is TrafficStudy???..... Traffic studies may be grouped into three main categories: (1) Inventories, (2) Administrative studies, and (3) Dynamic studies.
  • 5.
    Traffic Engineering Studies – Volume studies – Speed studies – Travel time studies – Delay studies – Density studies – Accident studies – Parking studies – Goods movement and transit studies – Pedestrian studies – Calibration studies – Observation studies
  • 6.
    Volume Study Trafficvolume is defined as the number of vehicles crossing a section of road per unit time at any selected period. Traffic volume studies are conducted to collect data on the number of vehicles and/or pedestrians that pass a point on a highway facility during a specified time period. This time period varies from as little as 15 min to as much as a year, depending on the anticipated use of the data.
  • 7.
    To determine ofvehicle composition in traffic stream. To determine the service flow rate in PCU/PCE unit. To estimate of ADT based on expansion factor. To determine the directional distribution(DD). To draw flow fluctuation curves
  • 8.
    Effectiveness of atraffic control measure To check existing, operating service condition of a roadway section Planning traffic operation and control of existing facility To design intersection, signal timings, channelization Structural design of pavements, geometric design and road way capacity
  • 9.
    Volume Study Trafficvolume studies are usually conducted when certain volume characteristics are needed, some of which follow: oAverage Annual Daily Traffic (AADT) oAverage Daily Traffic (ADT) oPeak Hour Volume (PHV) oVehicle Classification (VC) oVehicle Miles of Travel (VMT)
  • 10.
  • 11.
    Definitions & Useful Parameters • Volume: Volume on a road is the number of vehicles passing the measurement point during a specified time interval. • Demand: is a measure of the number of vehicles (or passengers, or persons) waiting for service in the given time period. • Capacity: is the maximum number that can reasonable be expected to be served in the given time period.
  • 12.
    Definitions & UsefulParameters • PCE: Passenger Car Equivalent is essentially the impact that a mode of transport has on traffic variables (such as headway, speed, density) compared to a single car • PCU: It is a vehicle unit used for expressing highway capacity unit
  • 13.
    Definitions & Useful Parameters • Daily Volumes: A common time interval for volumes is a day. • Daily volumes are frequently used as the basis for highway planning and general observations of trends.
  • 14.
    Daily Volume commonlyused daily volume parameters Average Annual Daily Traffic (AADT) the average of 24-hour counts collected every day of the year. Average Daily Traffic (ADT) the average of 24-hour counts collected over a number of days greater than one but less than a year.
  • 15.
    Peak Hour Volume(PHV) the maximum number of vehicles that pas a point on a highway during a period of 60 consecutive minutes. Vehicle Classification (VC) with respect to the type of vehicles for cars, two-axle trucks, or three-axle trucks. Here comes your footer Flow Rate Vehicles/ 15 min expanded to 1 hour
  • 16.
    Factors  Hourlyexpansion factors (HEFs) are determined by the formula  Daily expansion factors (DEFs) are computed as
  • 17.
    Definitions (cont…) •Directional Distribution Directional Distribution is the predominant one-way traffic volume expressed as a percentage of two-way traffic
  • 18.
    Methods of countingvolume PowerPlugs Templates for PowerPoint
  • 19.
    The two basicmethods of counting traffic are:  Manual observation  Automatic recording
  • 20.
    Manual observation…… Mostapplications of manual counts require small samples of data at any given location. Manual counts are sometimes used when the effort and expense of automated equipment are not justified
  • 21.
    Mechanical count board Electronic count board
  • 22.
    Manual observation…… TallySheets Recording data onto tally sheets is the simplest means of conducting manual counts. The data can be recorded with a tick mark on a pre-prepared field form. A watch or stopwatch is necessary to measure the desired count interval
  • 23.
    Automatic recording Methodsof counting volume… Permanent Counters Portable Counters
  • 24.
  • 25.
    Types of VolumeCounts Cordon Counts Screen Line Counts Intersection Counts
  • 26.
    Types of VolumeCounts Pedestrian Volume counts Periodic Volume counts
  • 27.
  • 28.
  • 29.
  • 31.
    Study Area (Shahid Tajuddin Ahmed Avenue)
  • 33.
    General Information Location:Shahid Tajuddin Ahmed Avenue (Flyover) Date: June 20, 2013 Time: 8:15am - 8:30am Duration: 15 minute Weather: Sunny day Method: Manual (Direct)
  • 34.
    Car Bus Motorbike CNG Microbus/ Pajero
  • 35.
  • 36.
  • 37.
    General Information Location:Shahid Tajuddin Ahmed Avenue Date: June 19, 2013 (Wednesday) Time: 3:30 to 3:45 pm Duration: 15 minute Weather: Clear Method: Manual (Direct)
  • 38.
    Number of vehicle Time Car,Jeep, Micro,Ta xi 3 Wheeler Motorcy cle Bus NMT Total 3:30- 3:45 pm 215 80 33 37 22 387
  • 39.
    Converted no. ofVehicle Type of vehicle No. of vehicle PCE Converted no. of vehicle or PCU Car,Jeep,Micro,Taxi 215 1.0 215 3 Wheeler 80 0.5 40 Motorcycle 33 0.1 3.30 Bus 37 3.0 111 NMT 22 0.5 11 Total 387 380.3
  • 40.
     Rate ofFlow = 380.30 vehicle/15 min  Service flow rate of Reconnaissance survey = 380.30*4 = 1521.20 vehicle/hour
  • 41.
  • 42.
    Field activities andTime distribution
  • 43.
    General Information Groupno. 01  Location: Shahid Tajuddin Ahmed Avenue Date: June 20, 2013 (Thursday)  Time: 8:15 to 8:30 am Duration: 15 minute  Weather: Clear  Method: Manual (Direct)
  • 44.
    Group no. 01(cont) Number of Vehicle Time Car,Jeep, Micro,Ta xi 3 Wheeler Motorcy cle Bus NMT Total 8:15- 8:30 263 110 43 41 48 505
  • 45.
    Group no. 01(cont) Converted no. of Vehicle Type of vehicle No. of vehicle PCE Converted no. of vehicle or PCU Car,Jeep,Micro,Tax i 263 1 263 3 Wheeler 110 0.5 55 Motorcycle 43 0.1 4.3 Bus 41 3 123 NMT 48 0.5 24 Total 505 469.30
  • 46.
    Group no. 01(cont)  Rate of Flow = 469.30 vehicle/15 min  Service flow rate = Rate of Flow * 4 = 469.3*4 = 1877.20 vehicle/hour
  • 47.
    Group no. 01(cont)  Hourly expansion factor, HEF = 17.11  Daily volume of traffic = Service flow rate*HEF = 1877.20*17.11 = 32118.892 vehicle/day
  • 48.
    Group no. 01(cont)  Daily expansion factor, DEF = 7.012  Weekly volume of traffic = Daily volume of traffic*DEF = 32118.892*7.012m = 225217.67 vehicle/week
  • 49.
    Group no. 01(cont)  Average daily traffic, ADT = Weekly volume of traffic/7 = 225217.67/7 = 32173.95 vehicle/day
  • 50.
    Group no. 01(cont)  Annual average daily traffic = ADT*1.395 = 32173.95*1.395 = 44882.66 vehicle/day
  • 51.
    Number of Vehicle (Flyover to Shatrasta) Group no. Time Car,Jeep, Micro,Tax i 3 Wheeler Motorcyc le Bus NMT Total 1 8:15-8:30 263 110 43 41 48 505 2 8:30-8:45 262 127 60 45 17 511 3 8:45-9:00 169 63 40 26 4 302 4 9:00-9:15 239 106 80 36 0 461 5 9:15-9:30 220 94 55 33 16 418 Total 1153 500 278 181 85
  • 52.
    Converted no. ofVehicle (Flyover to Shatrasta) Type of vehicle No. of vehicle PCE Converted no. of vehicle or PCU % PCU Car,Jeep,Mic ro,Taxi 1153 1 1153 57.18395 3 Wheeler 500 0.5 250 12.39895 Motorcycle 278 0.1 27.8 1.378763 Bus 181 3 543 26.93052 NMT 85 0.5 42.5 2.107821 Total 2016.3 100
  • 53.
    Vehicle Composition ofTraffic Stream (Flyover to Shatrasta) 57.18% 12.40% 1.38% 26.93% 2.11% Car,Jeep,Micro,Taxi 3 Wheeler Motorcycle Bus NMT
  • 54.
    Number of Vehicle (Shatrasta to Flyover) Group no. Time Car,Jeep, Micro,Ta xi 3 Wheeler Motorcyc le Bus NMT Total 6 8:15-8:30 314 125 110 24 7 580 7 8:30-8:45 341 111 88 35 40 615 8 8:45-9:00 282 132 74 25 0 513 9 9:00-9:15 341 142 62 48 0 593 10 9:15-9:30 314 105 61 32 0 512 Total 1592 615 395 164 47
  • 55.
    Converted no. ofVehicle (Shatrasta to Flyover) Type of vehicle No. of vehicle PCE Converted no. of vehicle or PCU % PCU Car,Jeep,Mic ro,Taxi 1592 1 1592 64.86046 3 Wheeler 615 0.5 307.5 12.52801 Motorcycle 395 0.1 39.5 1.609289 Bus 164 3 492 20.04482 NMT 47 0.5 23.5 0.957425 Total 2454.5 100
  • 56.
    Vehicle Composition ofTraffic Stream (Shatrasta to Flyover) 64.86% 12.53% 1.61% 0.96% 20.04% Car,Jeep,Micro,Taxi 3 Wheeler Motorcycle Bus NMT
  • 57.
    Flyover to Shatrasta Service flow rate (PCU/hour) Shatrasta to Flyover Service flow rate (PCU/hour) Group 01 1877.20 Group 06 1852 Group 02 1900 Group 07 2121.20 Group 03 1707 Group 08 1721.6 Group 04 1632 Group 09 2392.8 Group 05 1518 Group 10 1874.4 Average 1726.84 Average 1992.32 Directional Directional 46 % 54% distribution distribution Directional Distribution
  • 58.
    Service flow rateHistogram (Flyover to Shatrasta) 1877.2 1900 1707 1632 1518 2000 1500 1000 500 0 8:15-8:30 8:30-8:45 8:45-9:00 9:00-9:15 9:15-9:30 PCU/hour Time
  • 59.
    Service flow rateHistogram (Shatrasta to Flyover) 1852 2121.2 1721.6 2392.8 1874.4 2500 2000 1500 1000 500 0 8:15-8:30 8:30-8:45 8:45-9:00 9:00-9:15 9:15-9:30 PCU/hour Time
  • 60.
    Directional Distribution 46% 54% Flyover to Statrasta Statrasta to Flyover
  • 61.
    Flow Fluctuation Time Flyover to Statrasta Statrasta to Flyover Average of % ADT Group no. ADT (vehicle/day) % ADT Group no. ADT (vehicle/day) % ADT 8:15-8:30 1 32173.95 21.23 6 31742.04 18.59 19.91 8:30-8:45 2 32564.73 21.49 7 36355.95 21.29 21.39 8:45-9:00 3 29256.84 19.30 8 29507.07 17.28 18.29 9:00-9:15 4 27971.39 18.45 9 41010.99 24.02 21.23 9:15-9:30 5 29596.88 19.53 10 32125.96 18.82 19.18 Total 151563.79 100 170742.01 100
  • 62.
    Flow Fluctuation Curve 25 20 15 10 5 0 8:15-8:30 8:30-8:45 8:45-9:00 9:00-9:15 9:15-9:30 % ADT Time Flyover to Shatrasta Shatrasta to Flyover Average
  • 63.
    Recommendations Only 26%of total vehicles were Buses. Public transport should be increased and improved.
  • 64.
    Recommendations 5% oftotal vehicles were Non-motorized vehicles. A dedicated lane should be provided to facilitate non-motorized vehicle.
  • 65.
    Recommendations 39% oftotal vehicles were private cars. To reduce the number of private cars two steps can be taken- • Introducing TollsHOTCongestion pricing along some specific urban roadways. • Introducing parking permits and restricting parking space.
  • 66.
    Recommendations In orderto pick up and drop off passengers, bus-lay-by should be provided.
  • 67.
    Operated manual countingwithout a single Hand Counter. No provision for cross check in the manual method. No vantage location from where video method could be used to collect data.
  • 68.