Download as PDF, PPTX
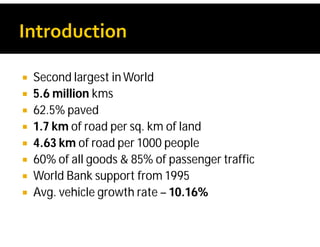
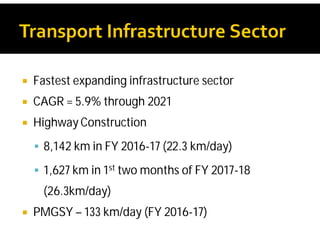

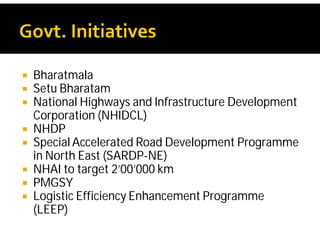
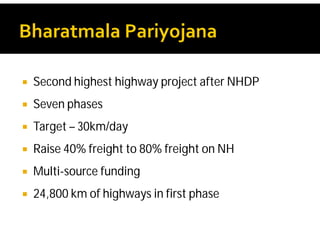
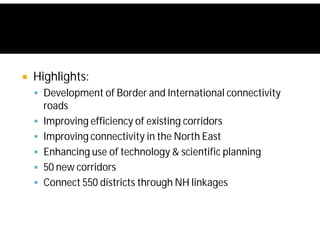
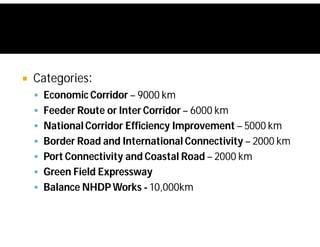
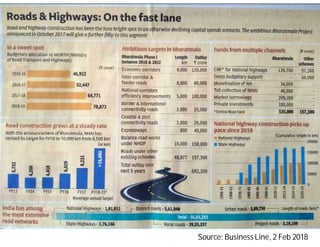

India possesses the second largest road network globally, covering 5.6 million kilometers, with a significant portion paved and a high percentage of goods and passenger traffic. Key developments include highway constructions, various road classifications managed by different authorities, and initiatives like PMGSY for rural road development. The Bharatmala project aims to enhance connectivity and logistics efficiency, with targets to improve existing corridors and connect more districts through national highways.