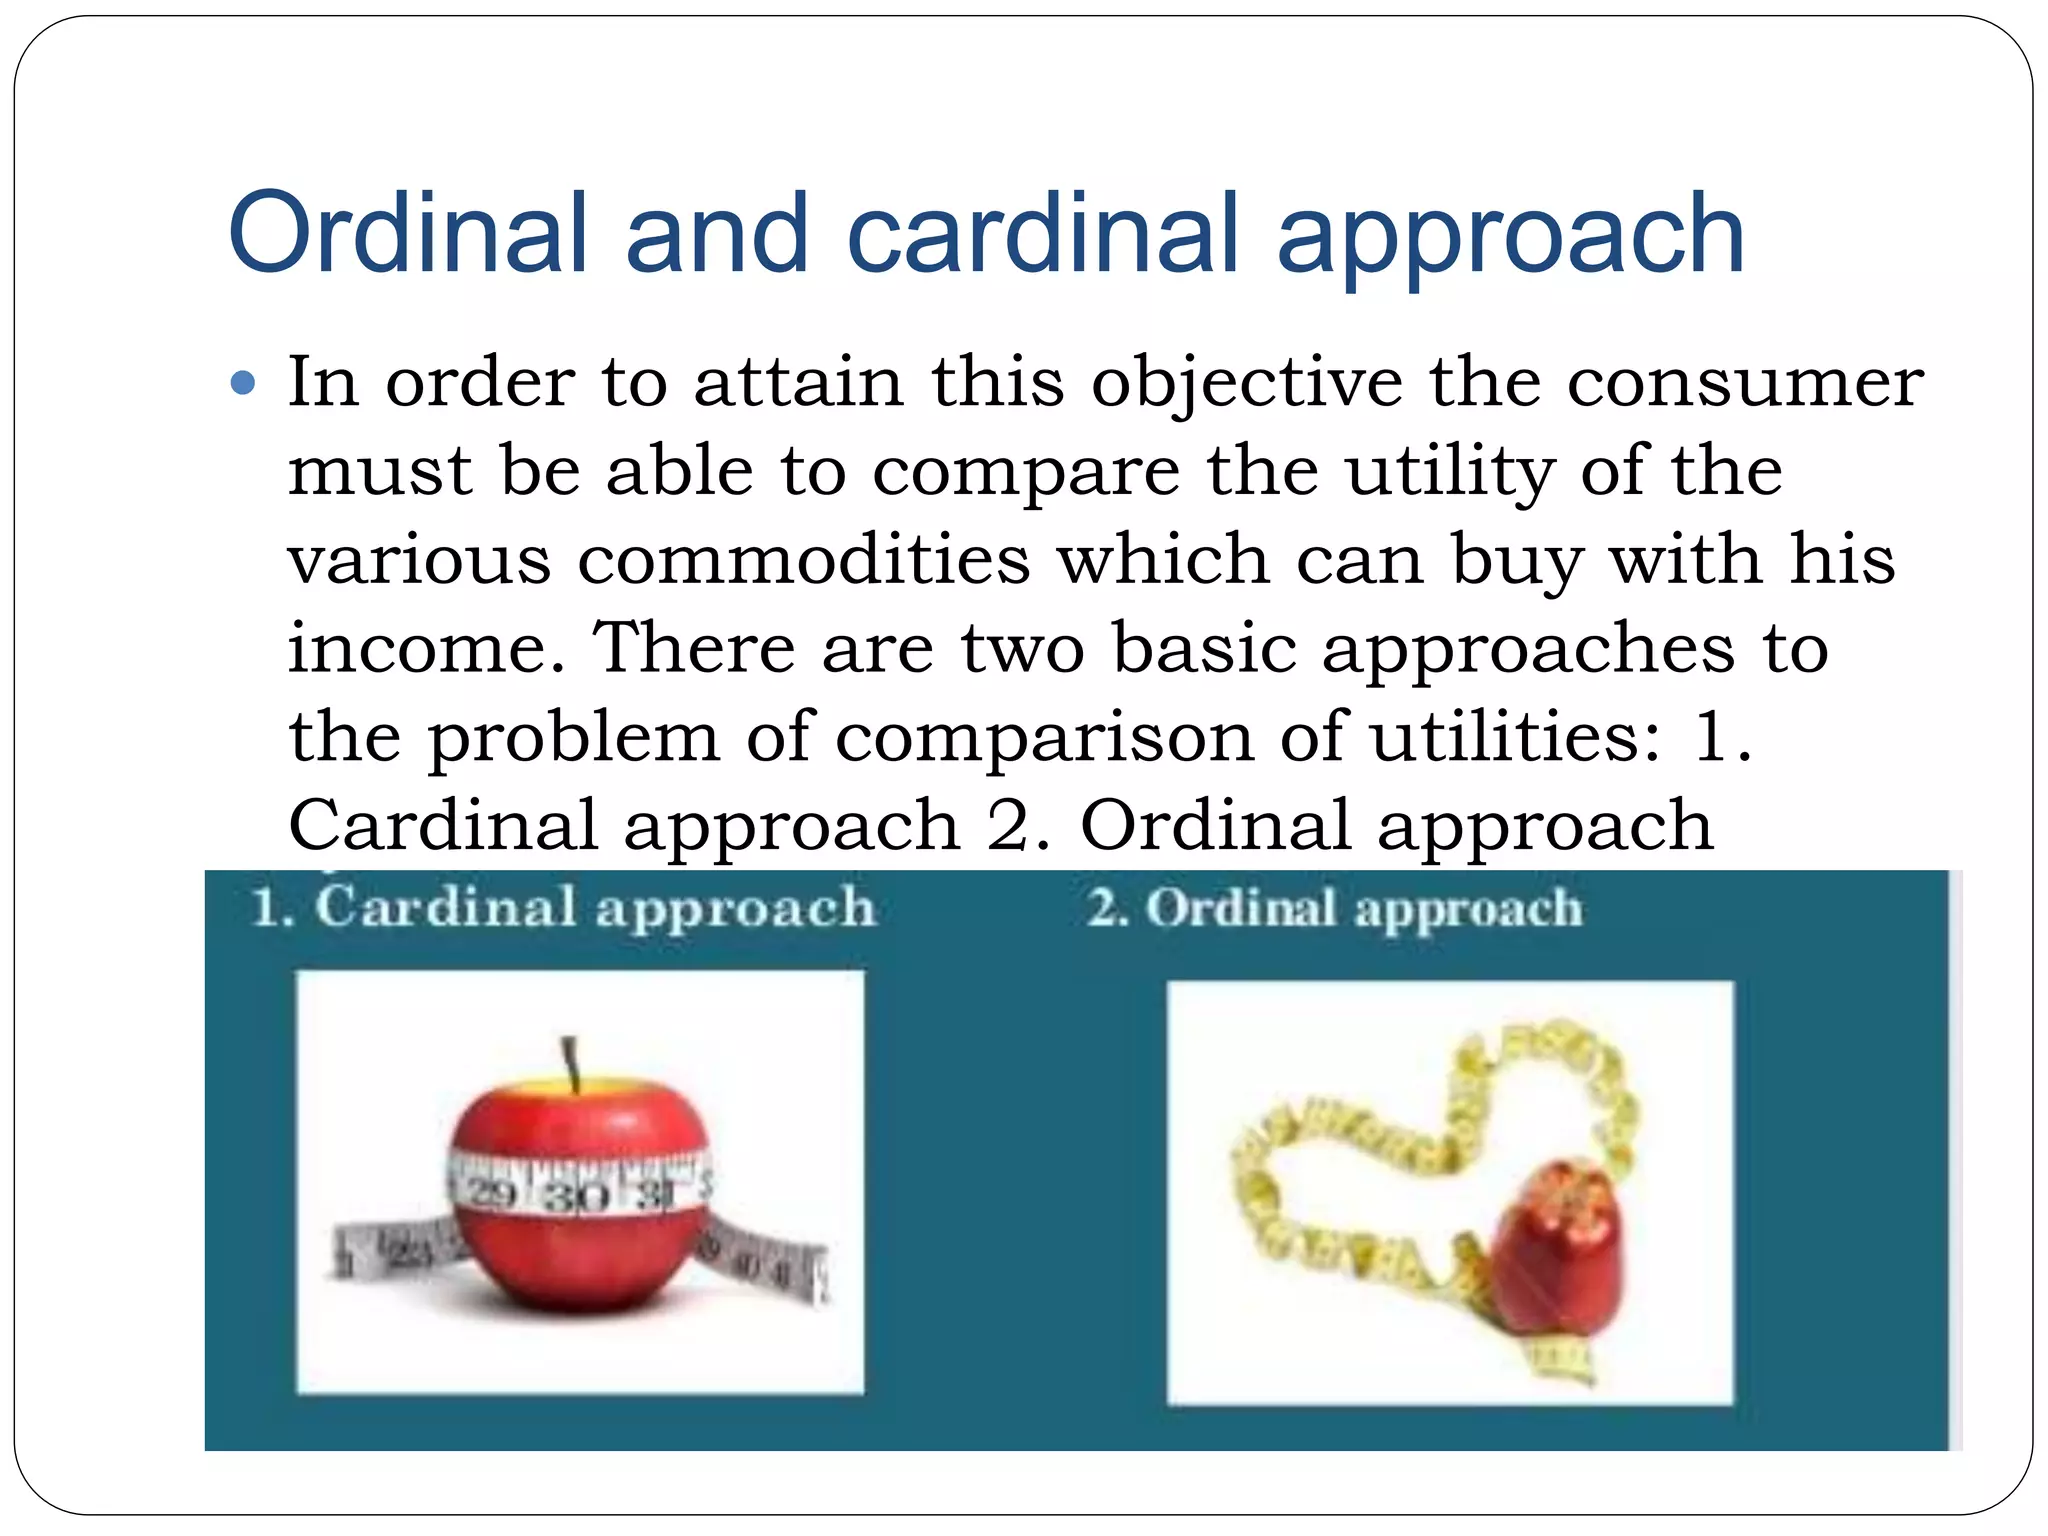
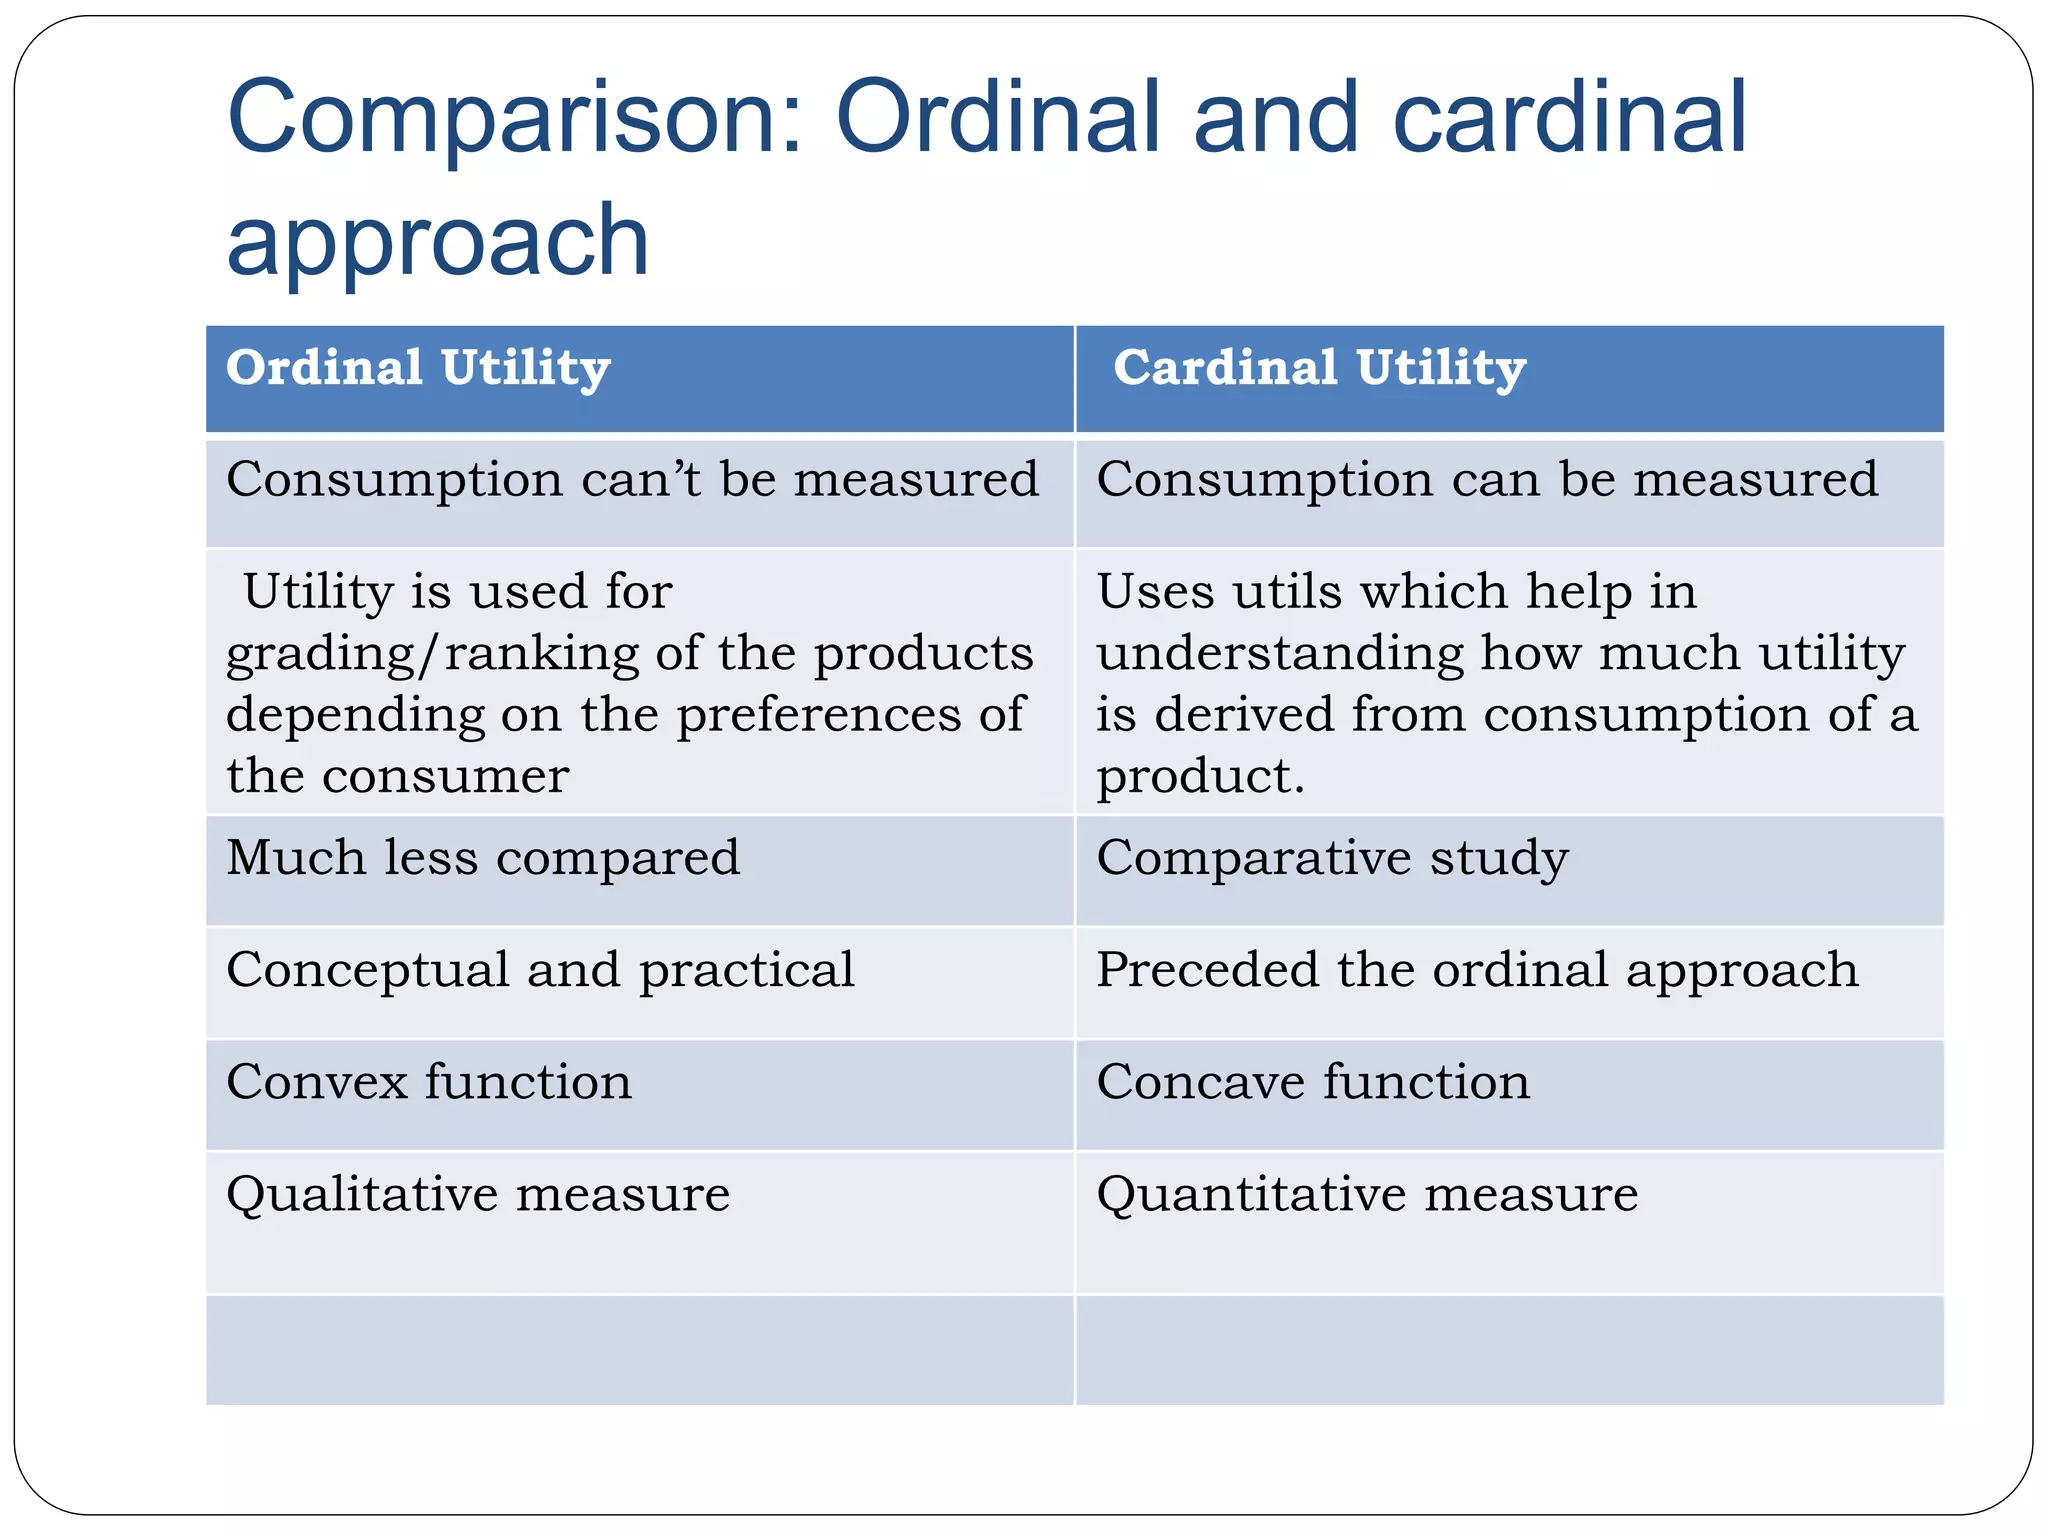
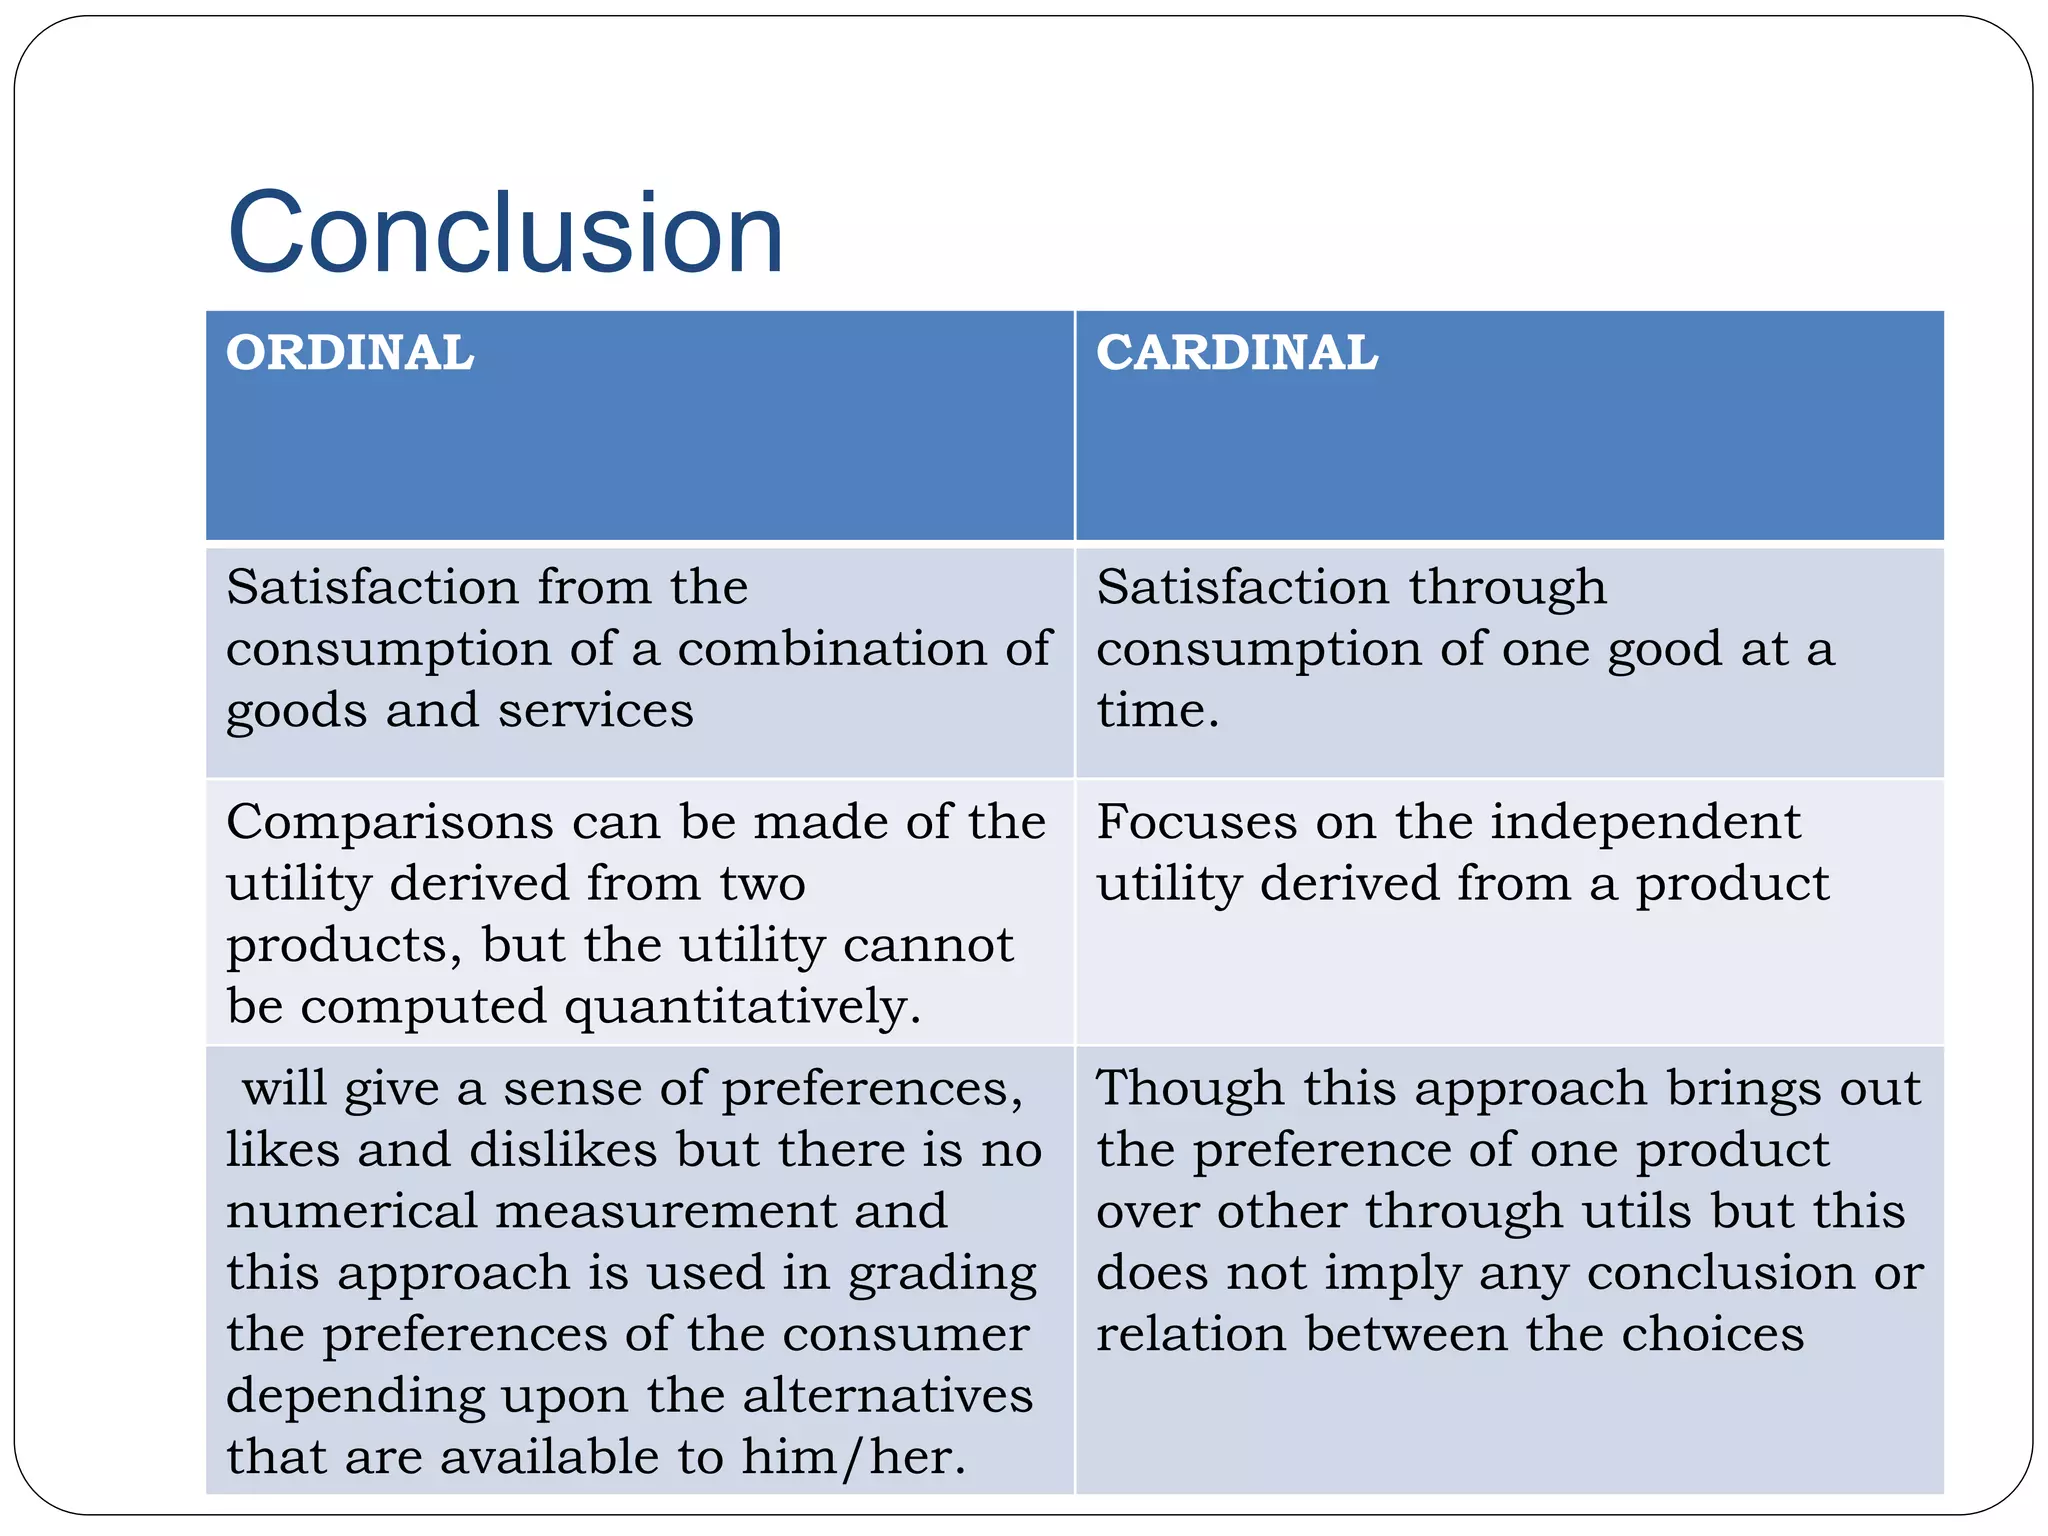
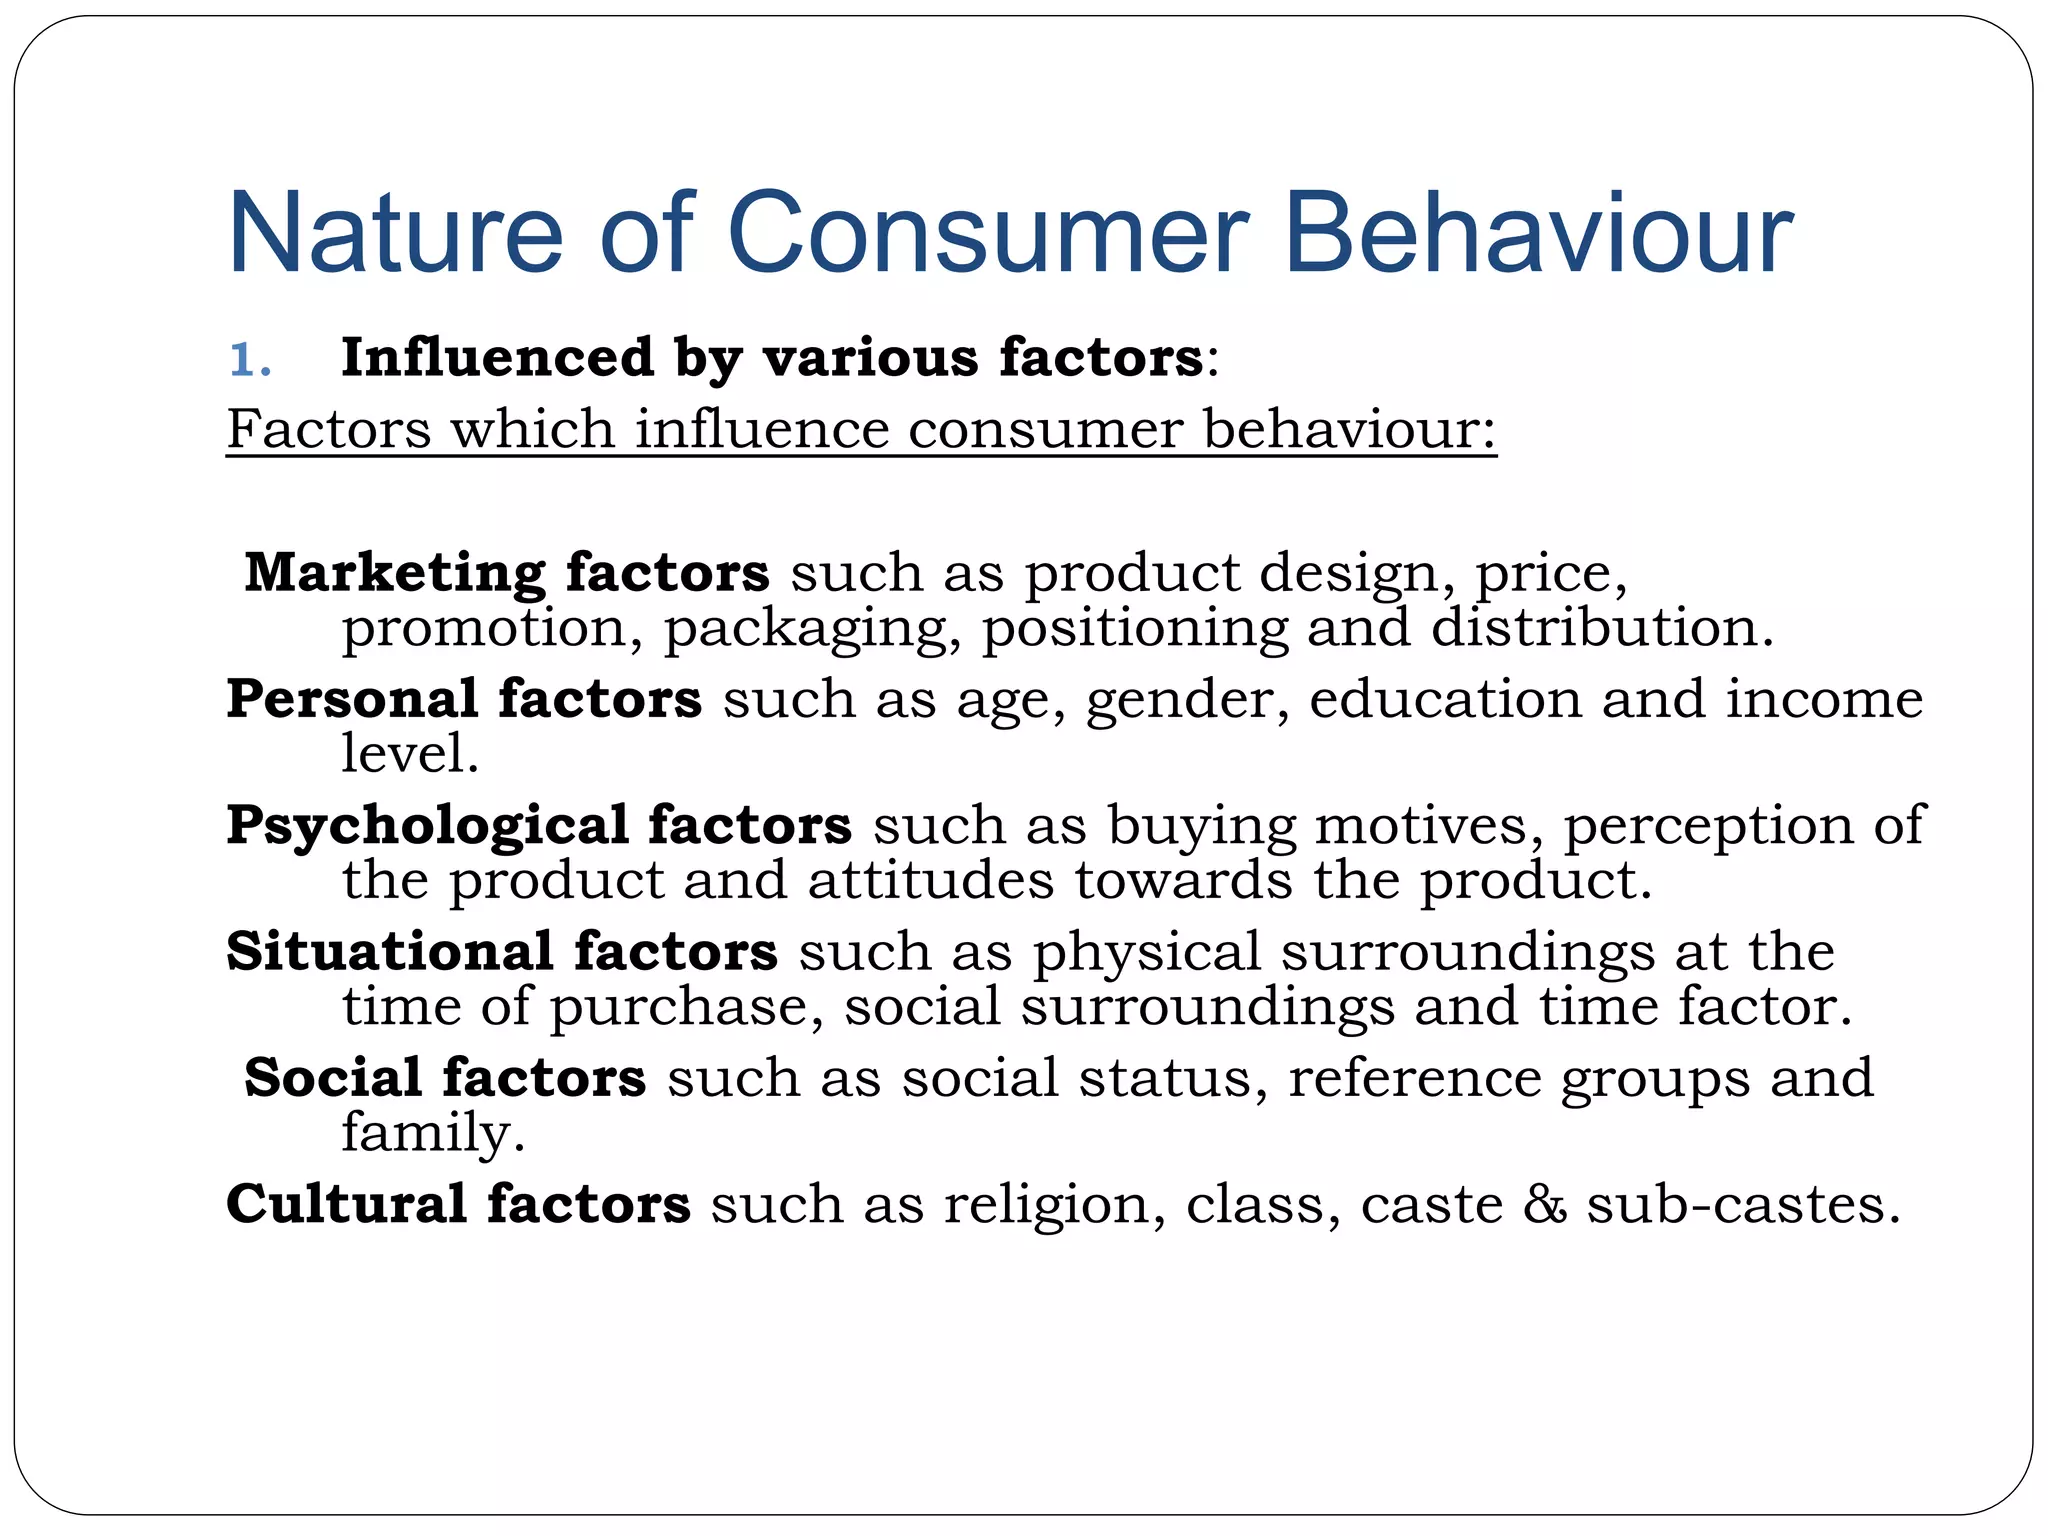
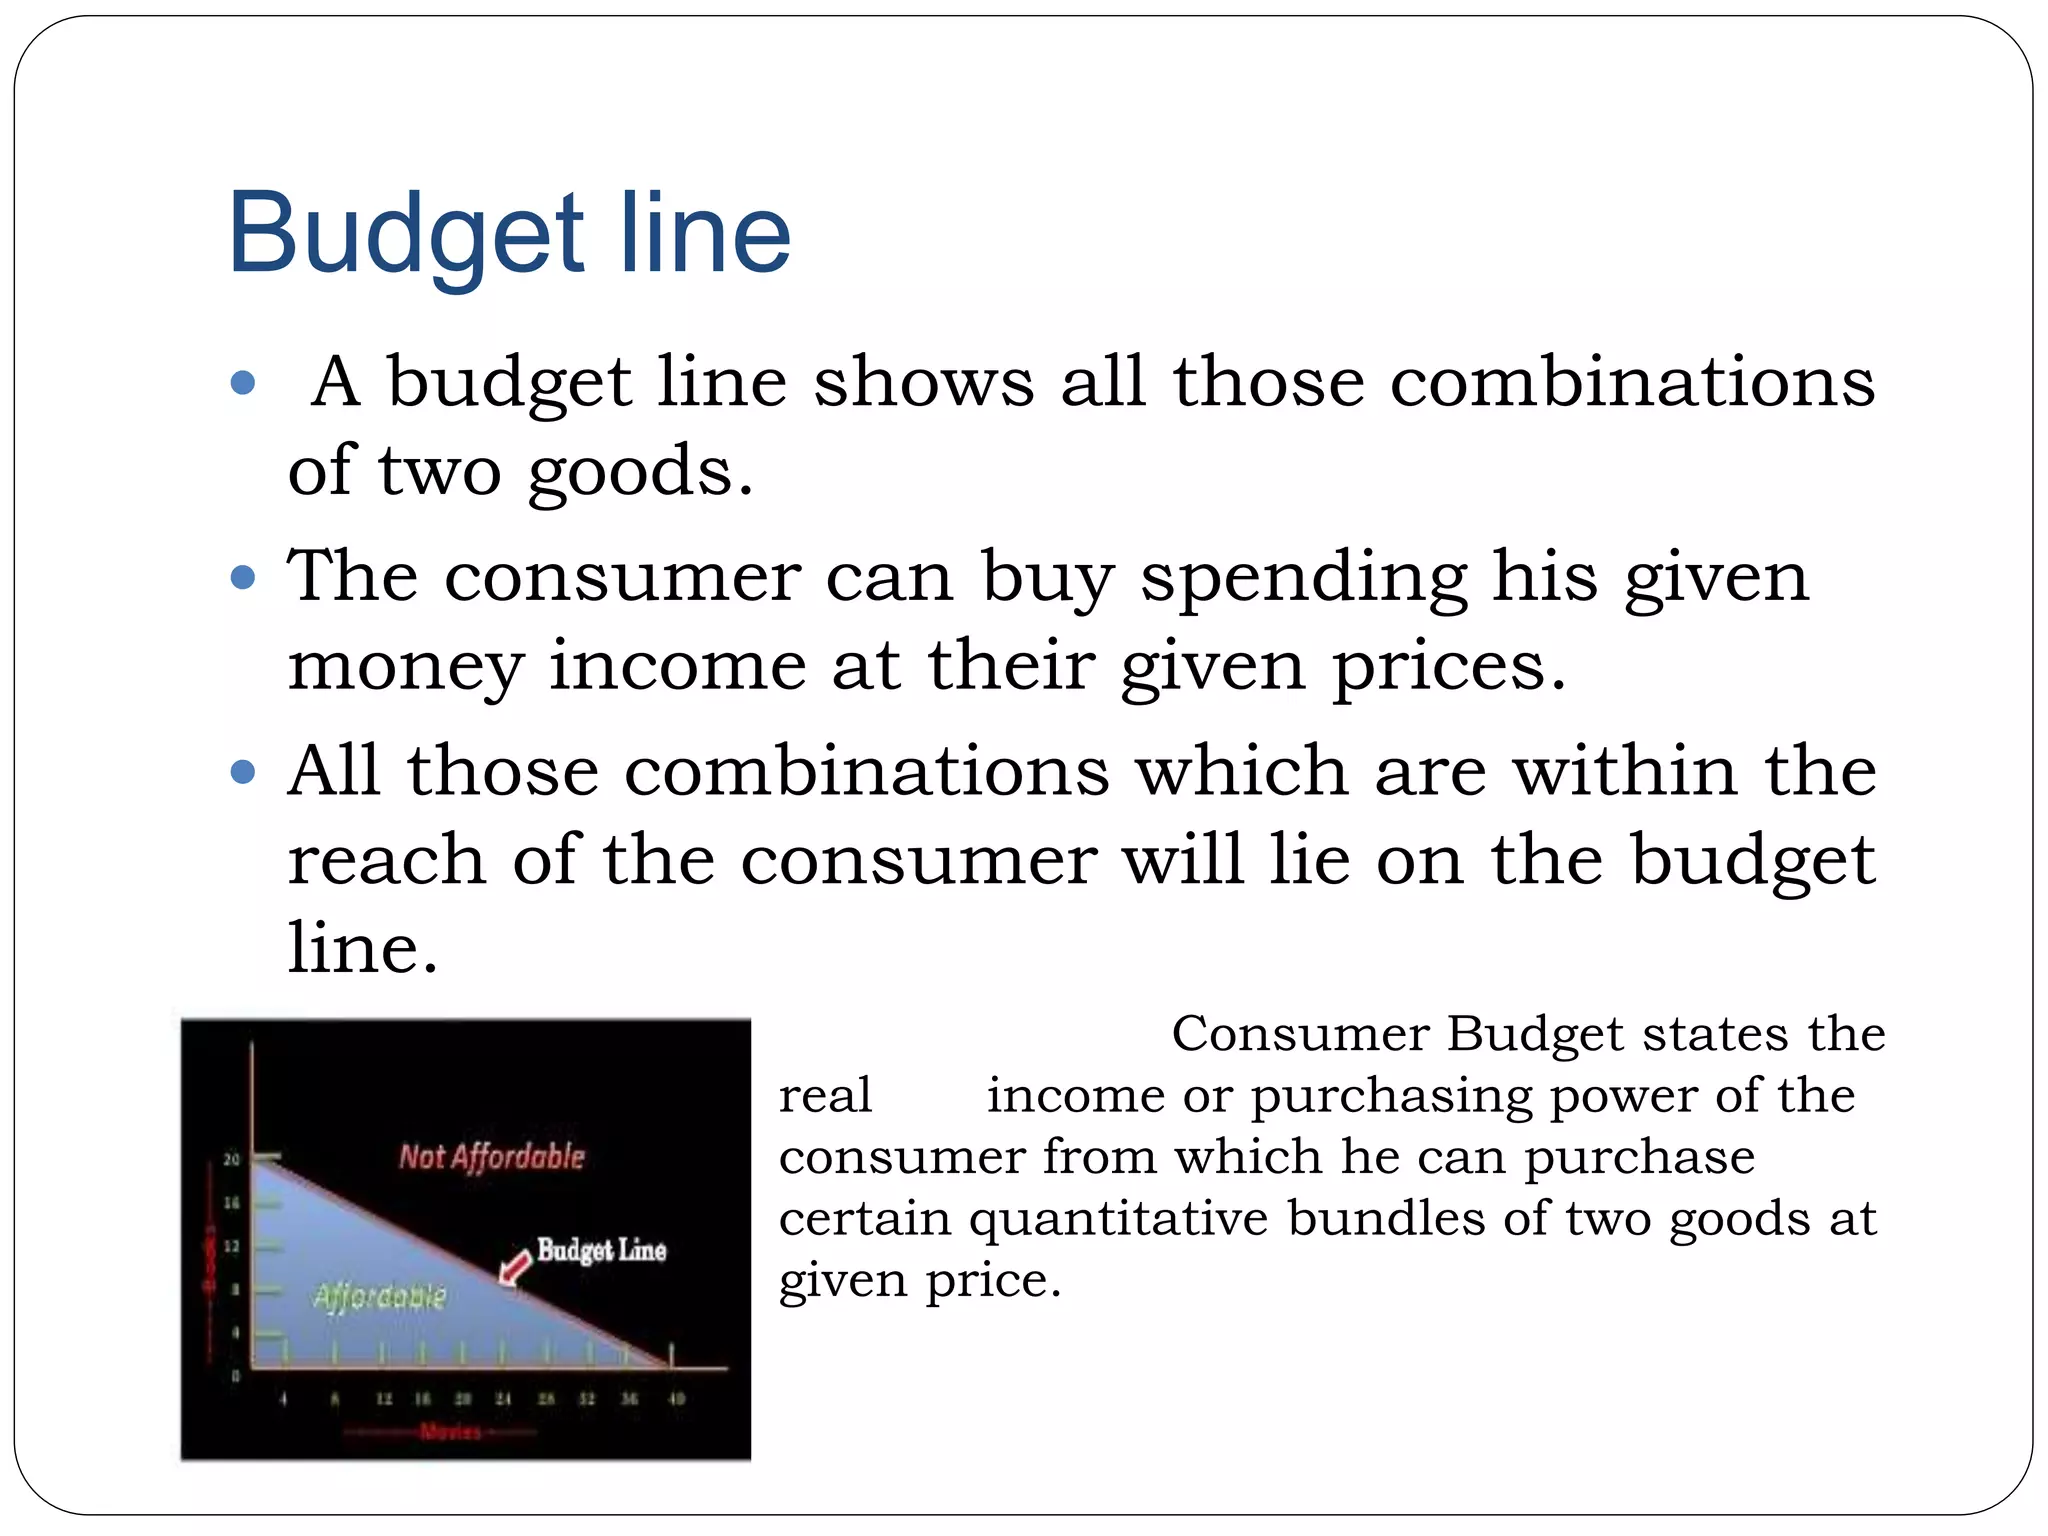
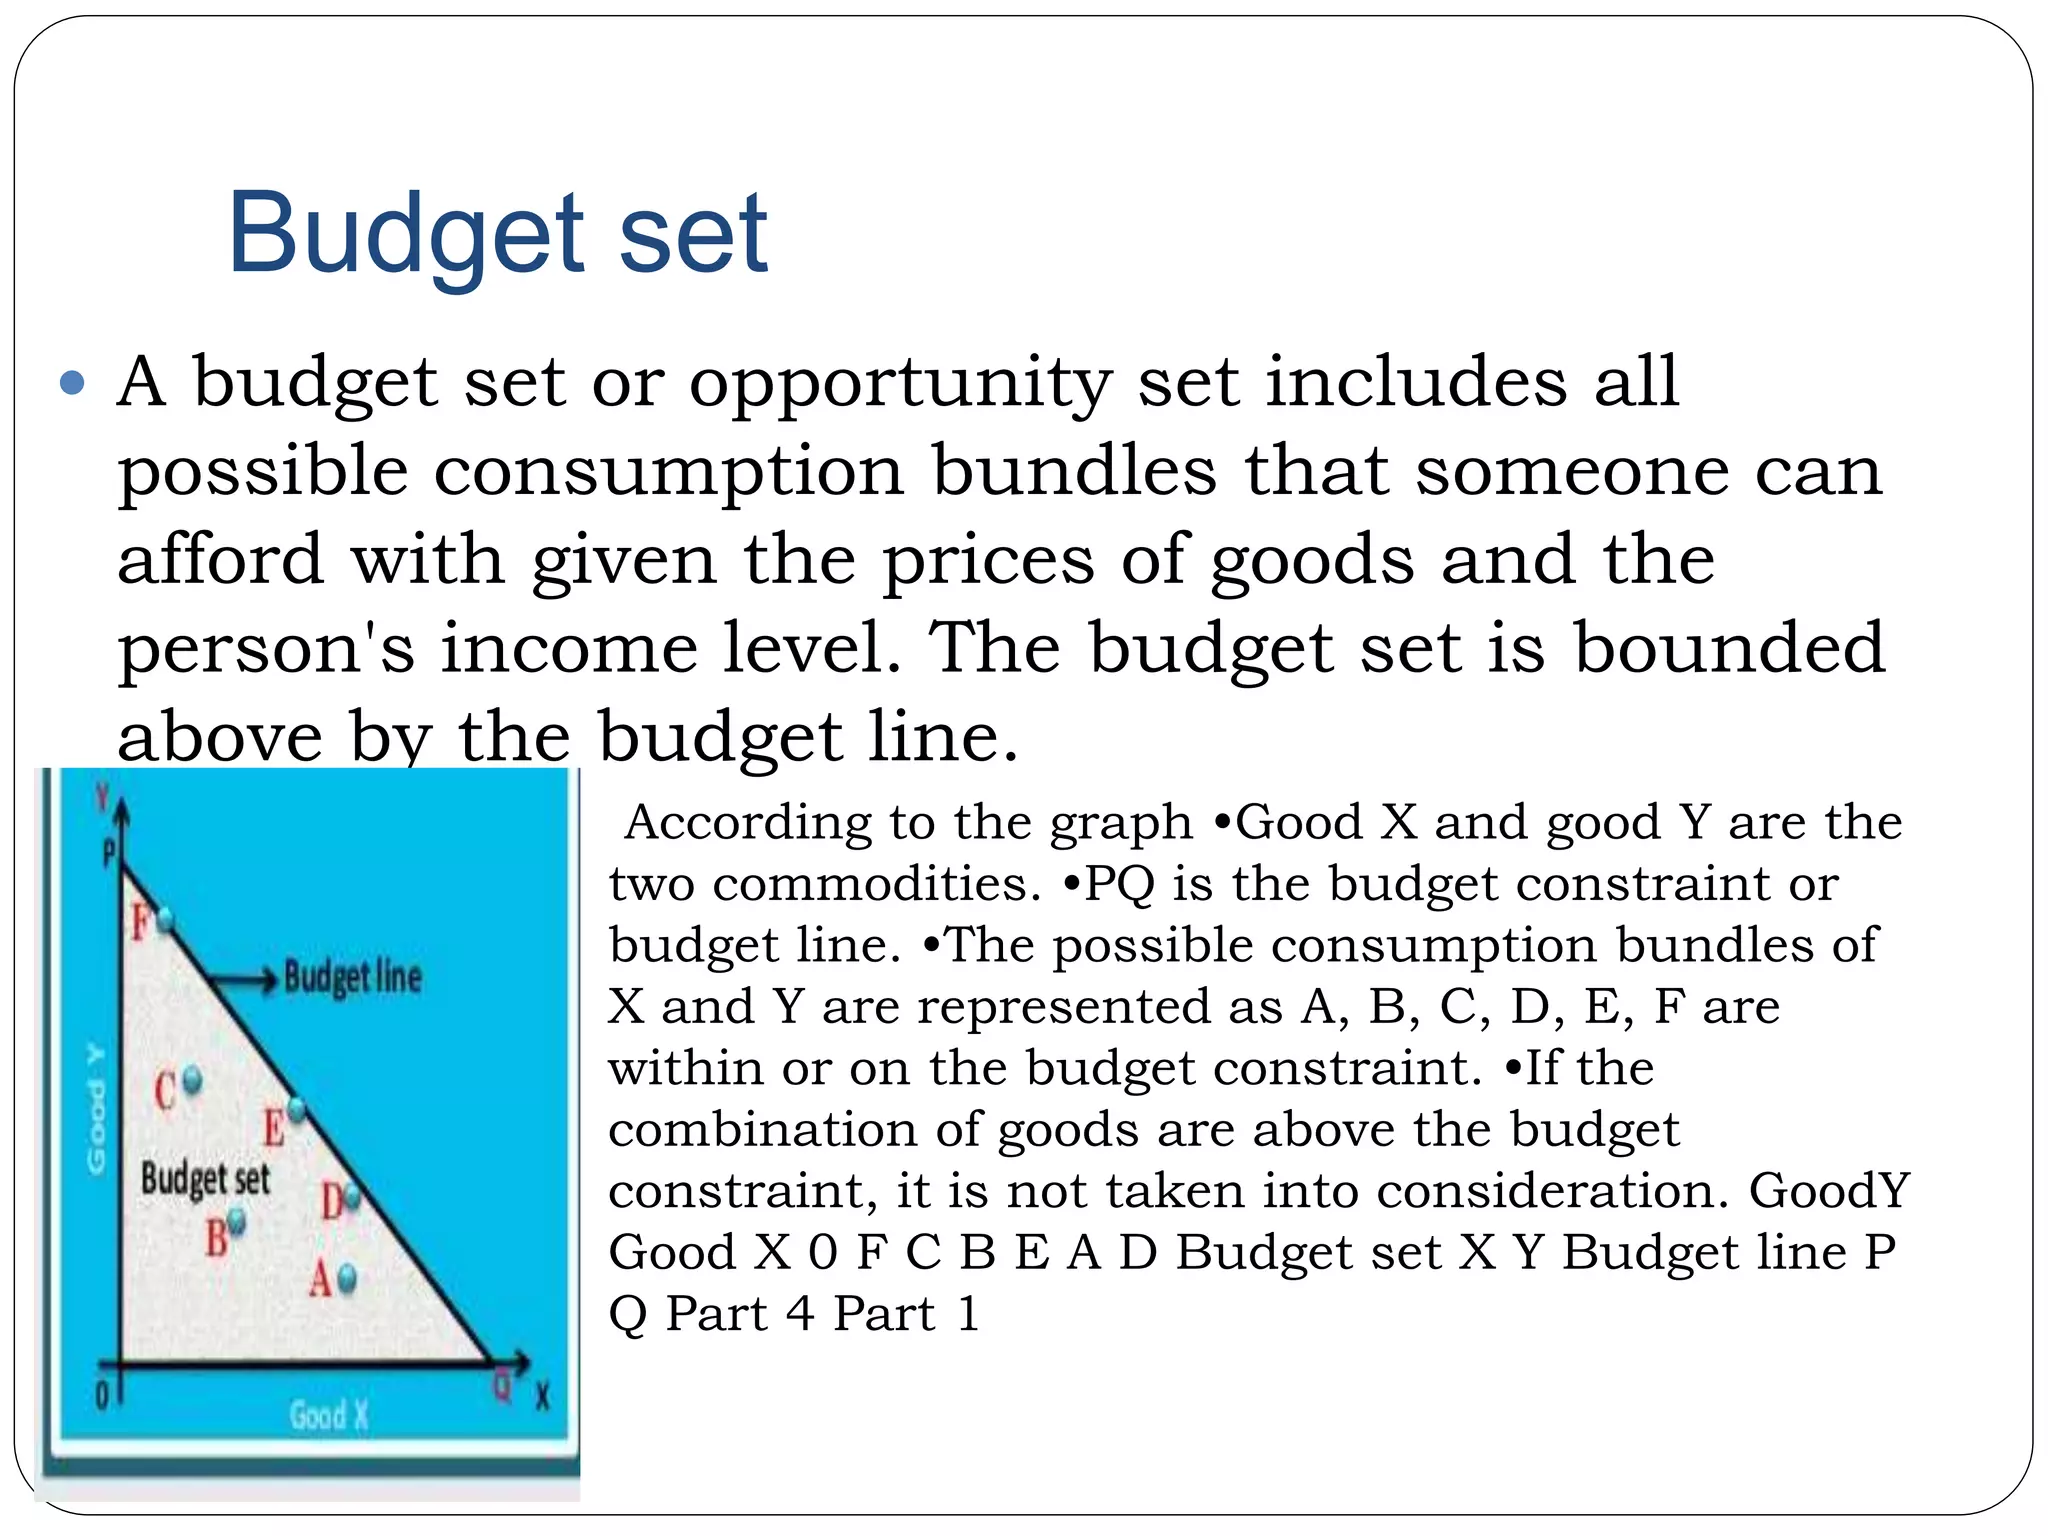
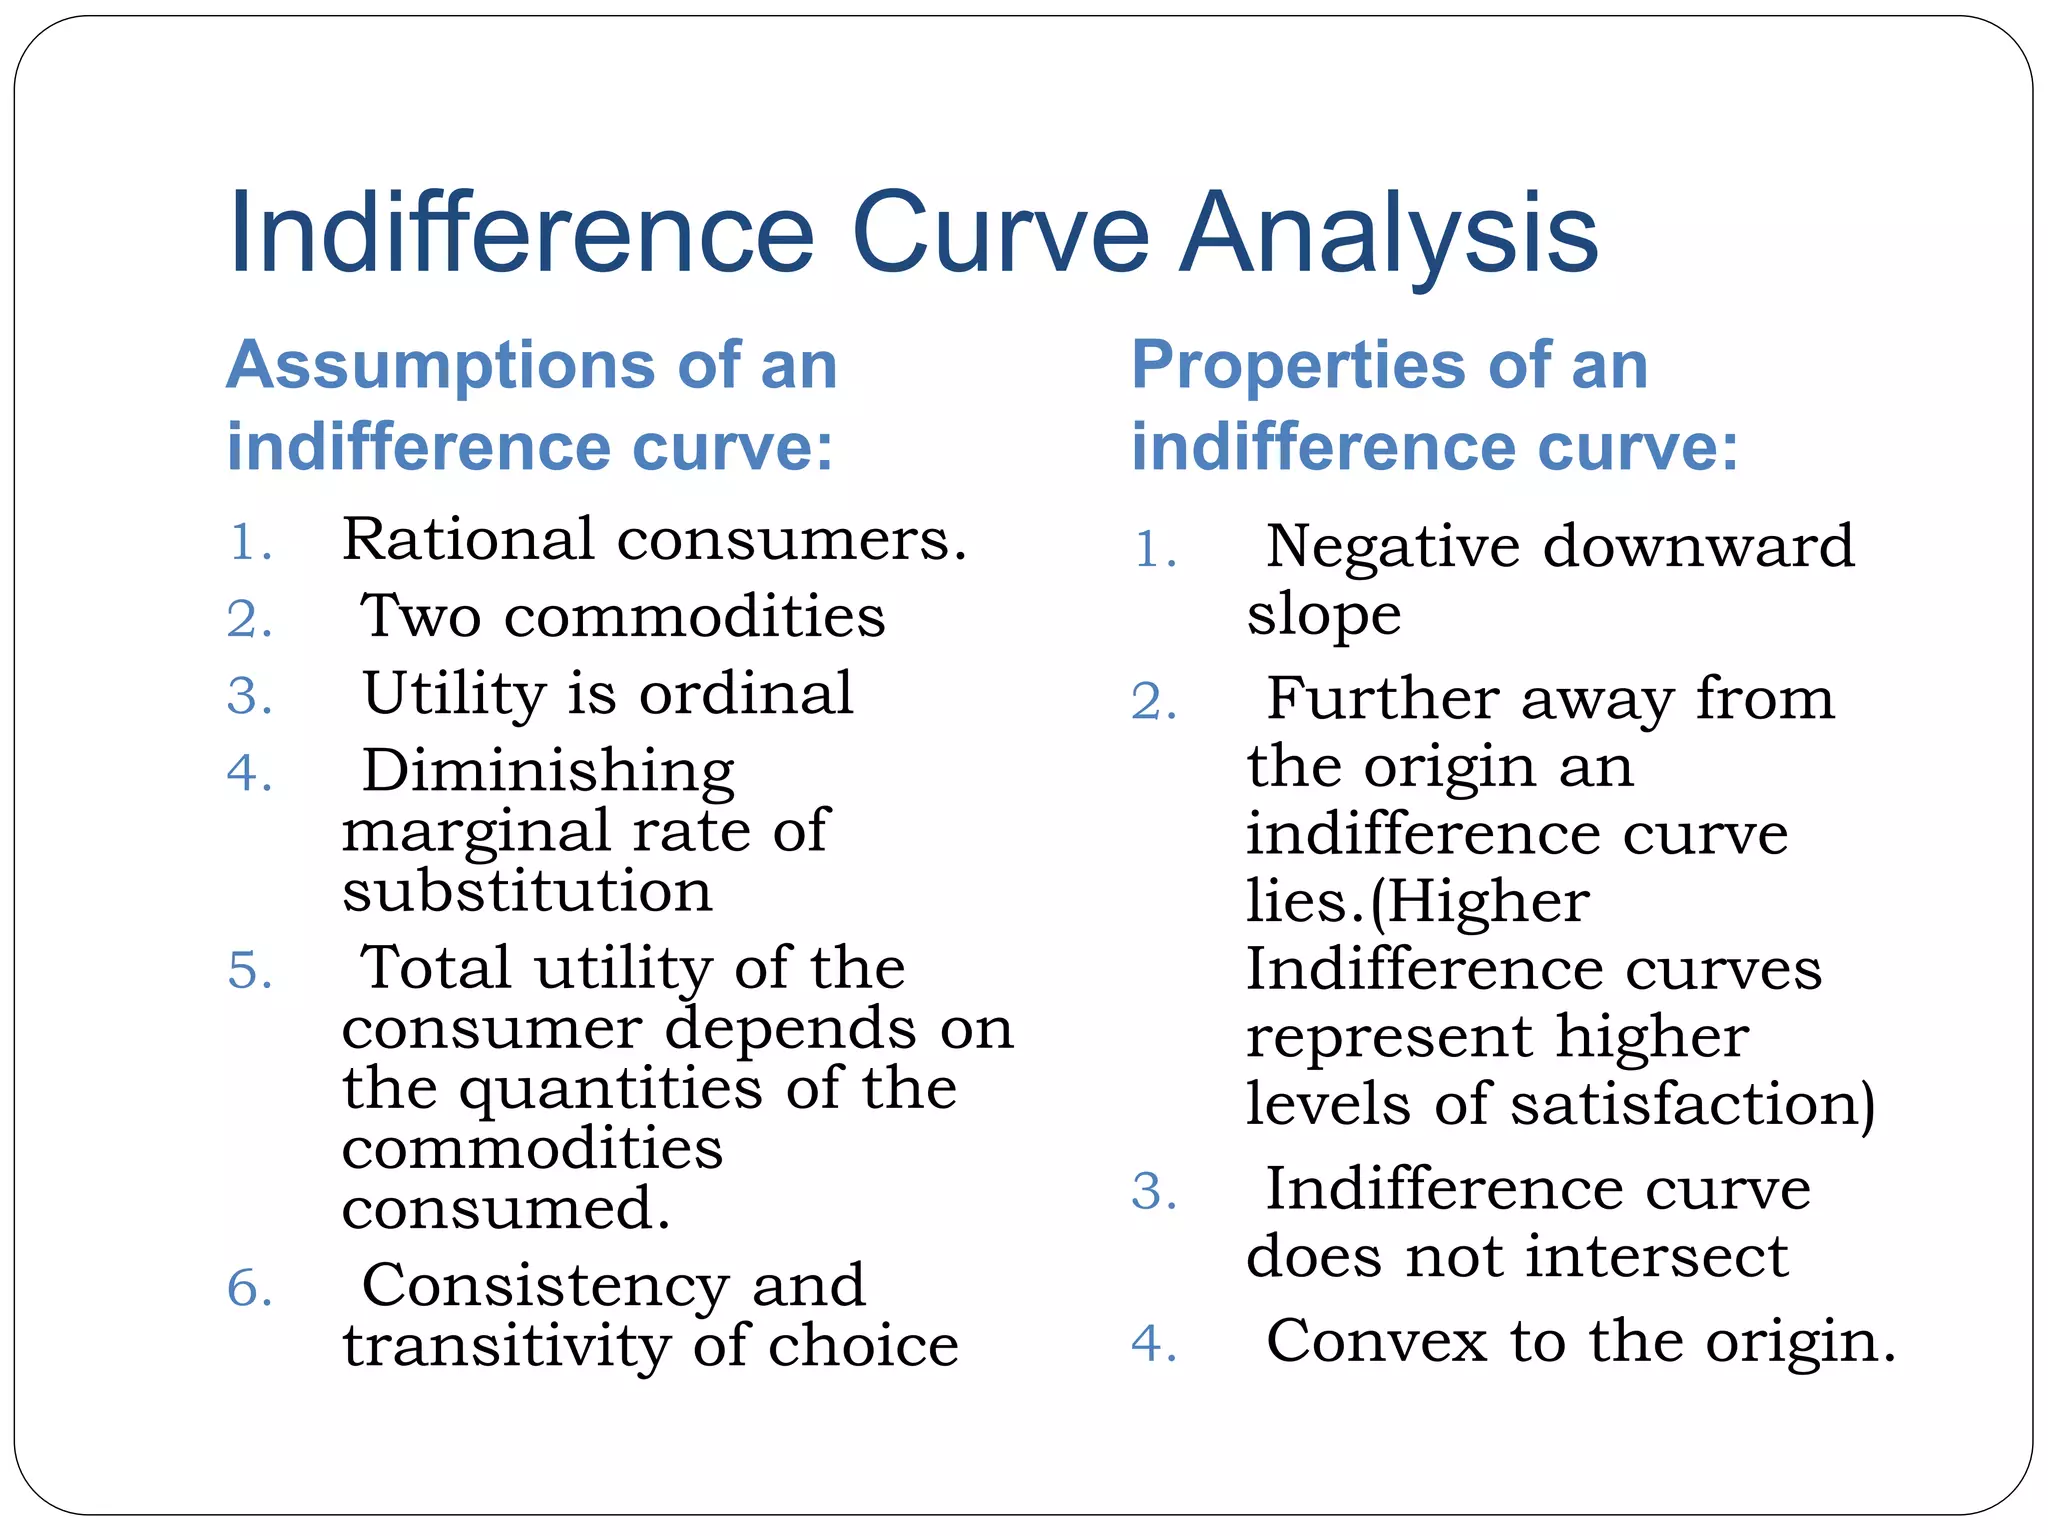
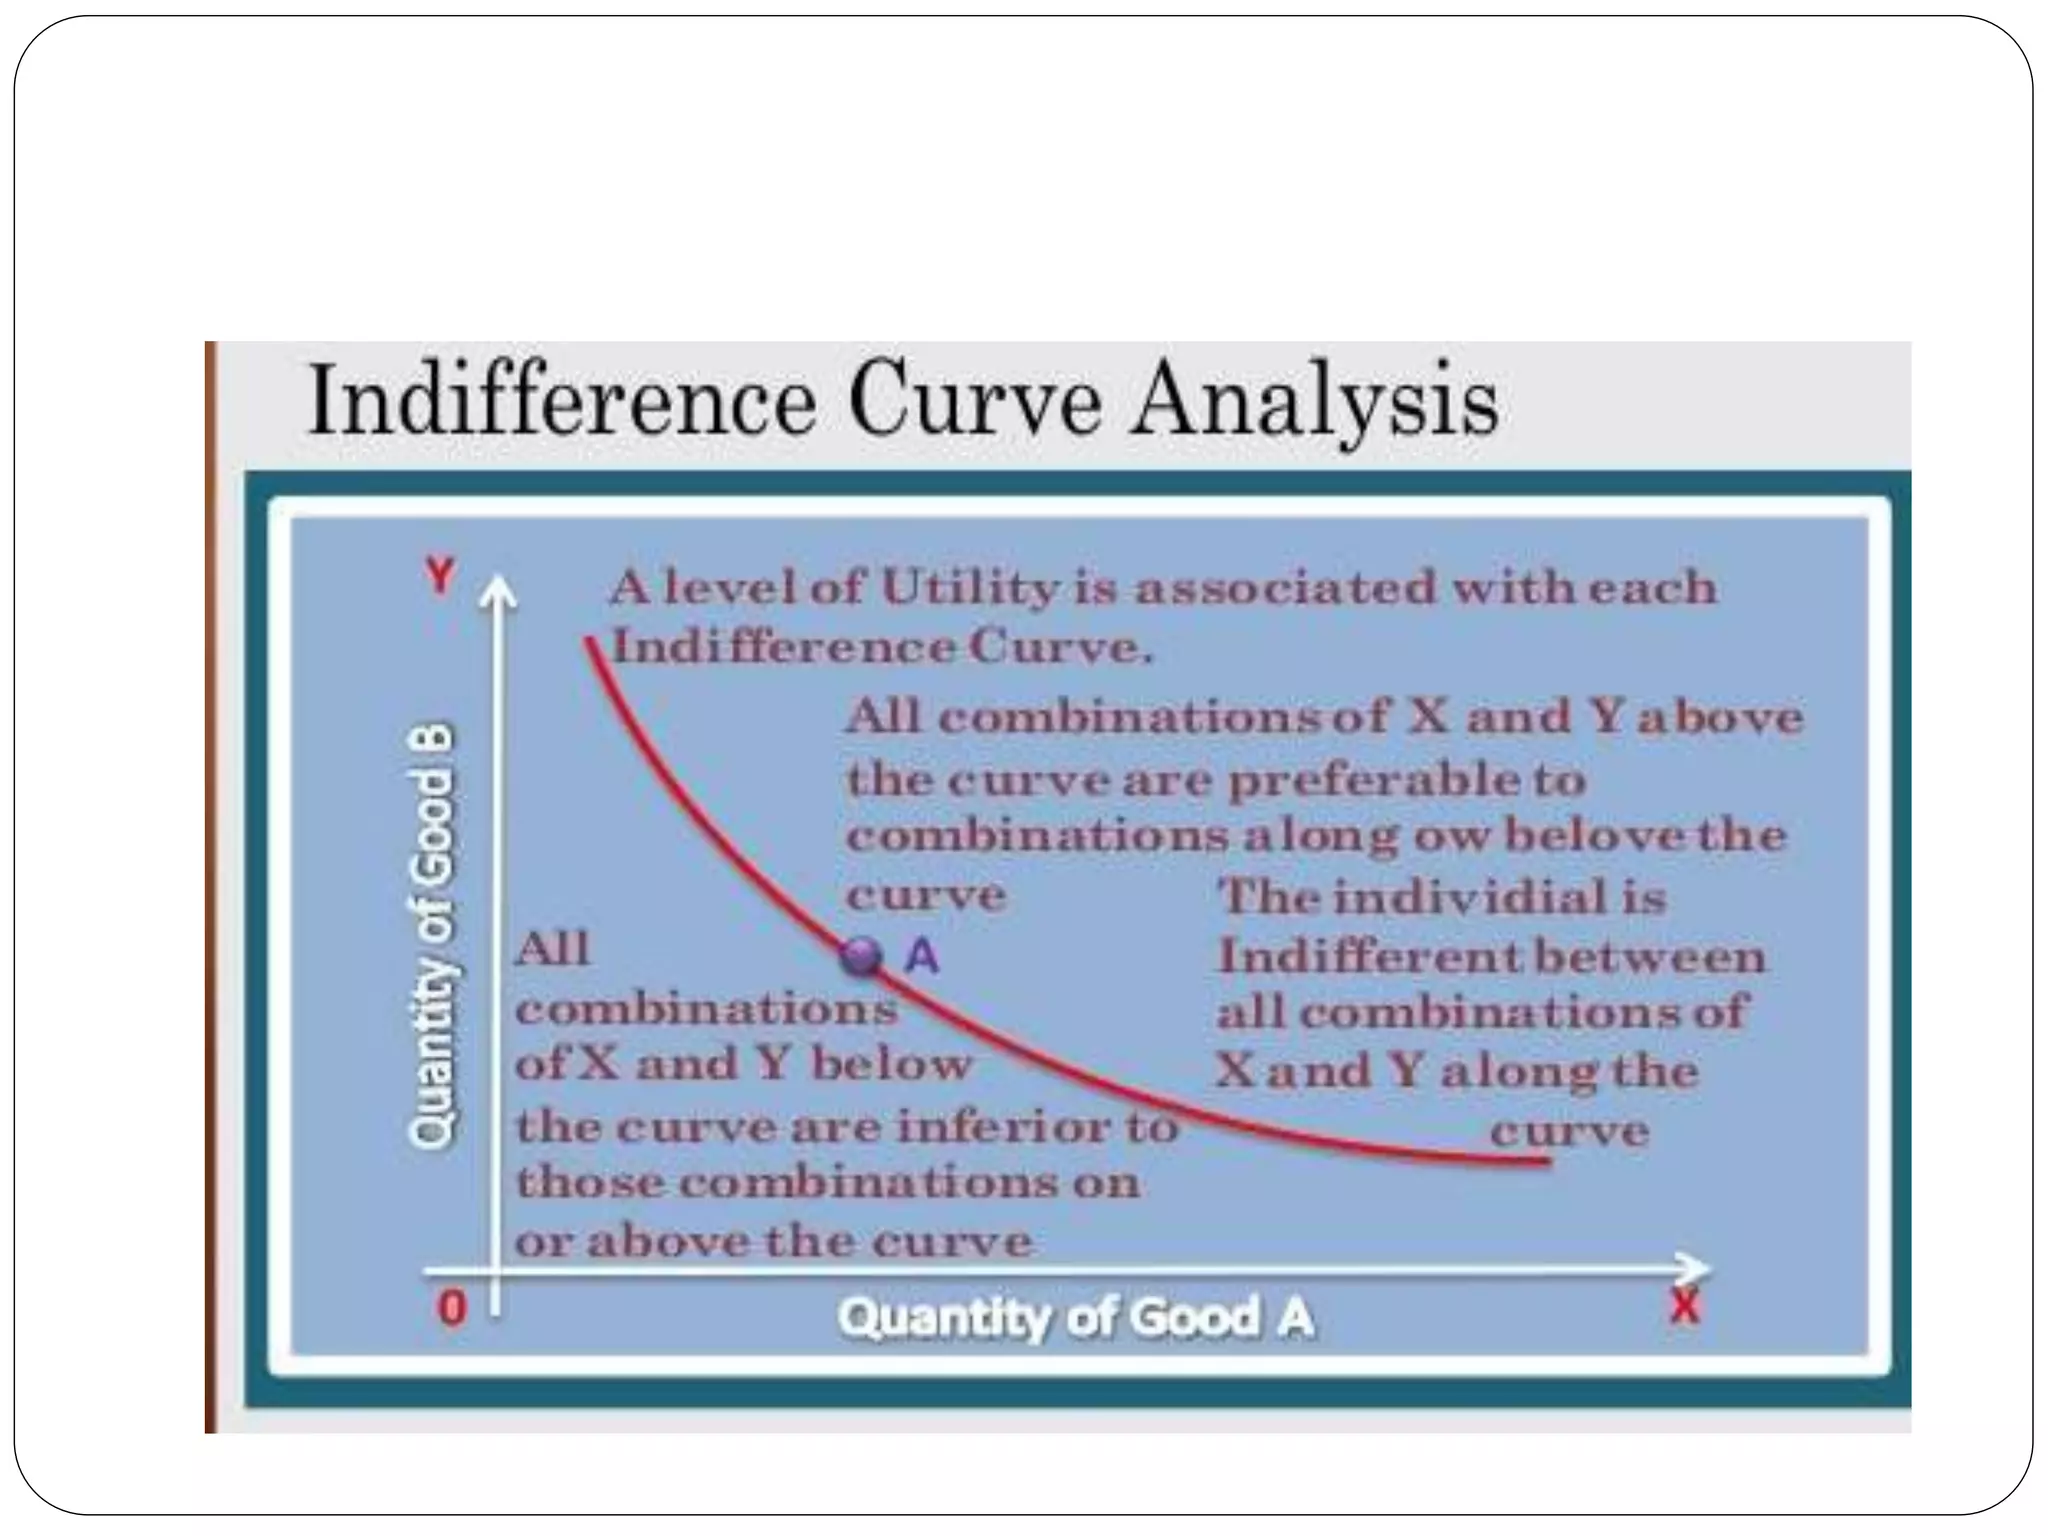
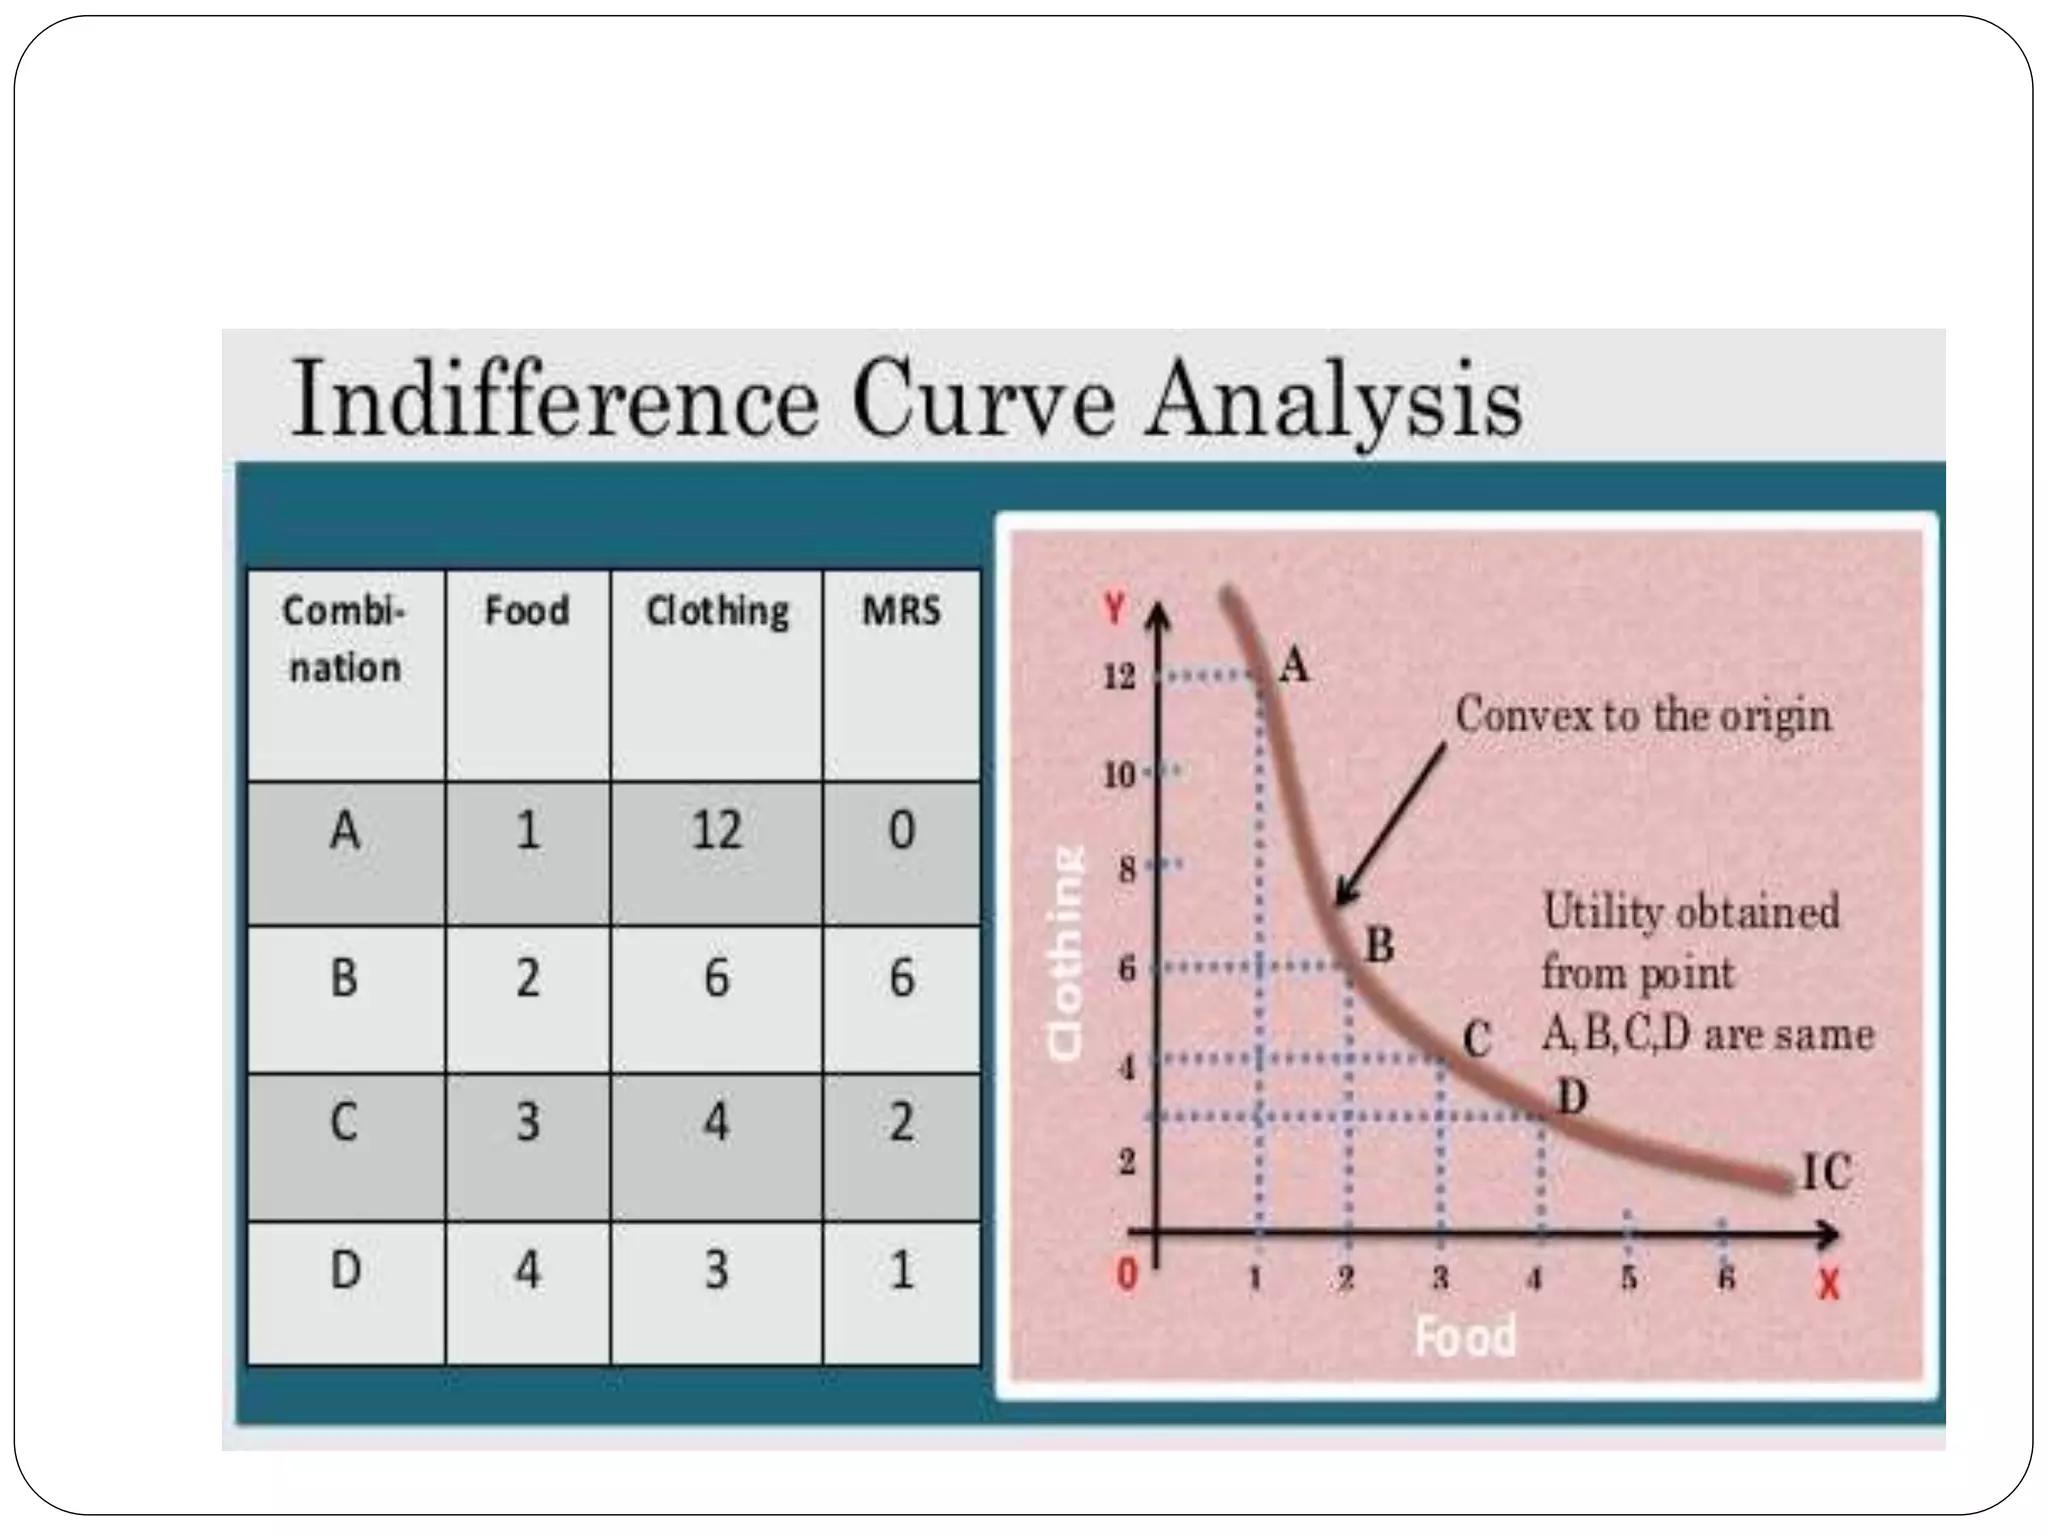
2. Contents
Introduction
Marginal Utility Analysis, Law of marginal
utility graphical representation
Ordinal Utility and Cardinal Utility Approach
Concept of Consumer Behavior – Budget
Line and Budget Set
Indifference Curve Analysis:- Meaning, Map
and Properties
Consumer's Equilibrium Marginal rate of
substitution
3. Introduction
The purpose of the theory of demand is to
determine the various factors that affect
demand.
Determinants:
1. The price of the commodity
2. Other prices
3. Income
4. Tastes
5. Income distribution
6. Total population
7. Wealth
8. Government policy
4. Introduction
The traditional theory of demand emphasis on
consumer’s demand for durable and non-
durable goods.
It does not deal with investment goods.
It is only a fraction of the total demand in the
economy as a whole.
The market demand is assumed to be the
summation of the demands of individual
consumers.
If a consumer gets more utilities from a
commodity, he would be willing to pay a higher
price and vice-versa.
5. Definitions:
Utility: Utility is wants satisfying power of a
commodity which varies from person to person. The
concept of utility is ethically neutral as harmful and
useful things are both considered. The value-in-use
of a commodity is the satisfaction which we get from
the consumption of a commodity.
Marginal utility: The additional utility derived from
additional unit of a commodity. It refers to net
addition made to the total utility by the consumption
of an extra unit of a commodity.
Total utility: The sum of utility derived from the
different units of a commodity consumed by a
consumer. The amount of utility derived from the
consumption of all units of a commodity which are at
the disposal of the consumer.
6. Marginal Utility Analysis
This theory is formulated by Alfred Marshall,
a British Economist, seeks to explain how a
consumer spends his income on different
goods and services so as to attain maximum
satisfaction.
7. Marginal Utility Analysis
Assumptions of utility analysis:
1. Utility is based on the cardinal concept.
2. Utility is measurable and additive of goods.
3. The marginal utility of money is assumed to be
constant.
4. The hypothesis of independent utility.
5. The consumer is rational.
6. He has full knowledge of the availability of commodities
and their technical qualities.
7 Possesses perfect knowledge of the choice of
commodities.
8. There are no substitutes.
9. Utilities are not influenced by variations in their prices.
10. The theory ignores complementary between goods.
8. Law of diminishing marginal utility
The law of marginal utility is based on the
human wants. The law was first developed
by German Economist H.H Gossen which is
known as “Gossen’s First law”.
Later it was popularized by Prof. Alfred
Marshall.
“The additional benefit which a person
derives from a given increase of his stock of
a thing diminishes with every increase in the
stock that he already has”. - Alfred Marshall
9. Law of diminishing marginal utility
Assumptions:
1. Tastes, preferences, etc of the customer remain
constant.
2. Income of the consumer also remain constant
3. Units of the goods are identical or similar
4. The process of consumption is continuous.
5. Units of the goods are not very small in size.
Importance:
1. Framing taxation policy by the government.
2. Useful to consumer to regulate his expenditure.
3. Useful to monopolist producer in fixing the prices of his
products.
4. Basis for law of demand.
5. Differentiate value-in-use and value-in-exchange.
10. Law of diminishing marginal utility
Explanation of the law
Suppose a person consumes the first apple, he
derives the highest level of utility and the intensity of
his desire declines.
If he consumes the second apple, he will get lesser
satisfaction than first apple.
The utility that he gets from the third apple will be
still less.
If he continues to consume more and more apples,
utility from each apple goes on diminishing as the
intensity of his desire goes on diminishing.
Thus, the law of diminishing marginal utility simply
tells us that we obtain less and less marginal utility
from the successive units of a commodity as we
consume more and more of it
11.
12. Explanation to the graph
The Total Utility (TU) declines in positive rate
but the Marginal Utility (MU) declines in a
negative rate.
Total utility rises by smaller amounts.
The negative slope of the marginal utility
curve reflects the law of diminishing
marginal utility.
Saturation point is when the total utility is
unchanged.
Marginal utility declines from larger to
smaller units.
13. Limitations
1. Different units consumed must be identical
and the habit, taste, income and treatment of
the consumer also remain unchanged.
2. Different units consumed should be standard
units.
3. Continuous consumption. I.e. no gap between
two consumption of one unit and another unit.
4. Law does not apply to articles like gold, cash,
money, music, hobbies,
5. The shape of the utility curve may be affected
by the presence or absence of articles which are
substitutes to it
14. Conclusion
Utility reflects the tastes of a particular
individual, uniqueness to the individual and
reflects his or her own particular subjective
preferences and perceptions. Utility remain
unchanged so long as the individual’s tastes
remain the same.
15. Ordinal and cardinal approach
In order to attain this objective the consumer
must be able to compare the utility of the
various commodities which can buy with his
income. There are two basic approaches to
the problem of comparison of utilities: 1.
Cardinal approach 2. Ordinal approach
16. Ordinal and cardinal approach
Ordinal approach: postulates that utility is not
measurement, but is an ordinal magnitude. The
consumer need not know in specific units the
utility of various commodities to make his
choice.
It is needed for him to rank the various
commodities. He must be able to determine his
order of preference among the different bundles
of goods. The main ordinal theories are:
1. the indifference-curves approach and
2. the revealed preference hypothesis
17. Ordinal and cardinal approach
The cardinal approach: postulates that
utility can be measured. Various suggestions
have been made for the measurement of
utility.
Under certainty of full knowledge about the
market conditions and income levels, some
economists have suggested that utility can
be measured by monetary units; by the
amount of money the consumer is willing to
sacrifice for another unit of a commodity.
18. Comparison: Ordinal and cardinal
approach
Ordinal Utility Cardinal Utility
Consumption can’t be measured Consumption can be measured
Utility is used for
grading/ranking of the products
depending on the preferences of
the consumer
Uses utils which help in
understanding how much utility
is derived from consumption of a
product.
Much less compared Comparative study
Conceptual and practical Preceded the ordinal approach
Convex function Concave function
Qualitative measure Quantitative measure
19. Conclusion
ORDINAL CARDINAL
Satisfaction from the
consumption of a combination of
goods and services
Satisfaction through
consumption of one good at a
time.
Comparisons can be made of the
utility derived from two
products, but the utility cannot
be computed quantitatively.
Focuses on the independent
utility derived from a product
will give a sense of preferences,
likes and dislikes but there is no
numerical measurement and
this approach is used in grading
the preferences of the consumer
depending upon the alternatives
that are available to him/her.
Though this approach brings out
the preference of one product
over other through utils but this
does not imply any conclusion or
relation between the choices
20. Concept of consumer behaviour
Consumer behaviour is the study of how
individual customers, groups or organizations;
select, buy, use, and dispose ideas, goods, and
services to satisfy their needs and wants.
It refers to the actions of the consumers in the
marketplace and the underlying motives for
those actions.
"Consumer behaviour is the decision process
and physical activity, which individuals engage
in when evaluating, acquiring, using or
disposing of goods and services"
21. Nature of Consumer Behaviour
1. Influenced by various factors:
Factors which influence consumer behaviour:
Marketing factors such as product design, price,
promotion, packaging, positioning and distribution.
Personal factors such as age, gender, education and income
level.
Psychological factors such as buying motives, perception of
the product and attitudes towards the product.
Situational factors such as physical surroundings at the
time of purchase, social surroundings and time factor.
Social factors such as social status, reference groups and
family.
Cultural factors such as religion, class, caste & sub-castes.
22. Nature of Consumer Behaviour
Consumer behavior is not static
Varies from consumer to consumer
Varies from region to region and country to county
Information on consumer behavior is important to
the marketers:
Factors for marketing decisions:
a) Product design/model
b) Pricing of the product
c) Promotion of the product
d) Packaging
e) Positioning
f) Place of distribution
23. Nature of Consumer Behaviour
g. Leads to purchase decision
h. Varies from product to product
i. Improves standard of living
j. Reflects status of a customer
24. Budget line
A higher indifference curve shows a higher
level of satisfaction than a lower one. •
A consumer in his attempt to maximise
satisfaction will try to reach the higher
possible indifference curve.
In pursuit of buying more and more goods,
he will obtain more and more satisfaction. It
includes two constraints:
1. He has to pay the prices for the goods
2. He has a limited money income with which
to purchase the goods.
25. Budget line
A budget line shows all those combinations
of two goods.
The consumer can buy spending his given
money income at their given prices.
All those combinations which are within the
reach of the consumer will lie on the budget
line.
• Consumer Budget states the
real income or purchasing power of the
consumer from which he can purchase
certain quantitative bundles of two goods at
given price.
26. Key points for Budget line
1. A Budget line separates what is affordable from
what is not affordable
2. Budget line slopes downwards as more of one
good can be bought by decreasing some units
of the other good.
3. Bundles which cost exactly equal to
consumer’s money income lie on the budget
line.
4. Bundles which cost less than consumer’s
money income shows under spending. They lie
inside the budget line.
5. Bundles which cost more than consumer’s
money income are not available to the
consumer. They lie outside the budget line.
27. Budget set
A budget set or opportunity set includes all
possible consumption bundles that someone can
afford with given the prices of goods and the
person's income level. The budget set is bounded
above by the budget line.
• According to the graph •Good X and good Y are the
two commodities. •PQ is the budget constraint or
budget line. •The possible consumption bundles of
X and Y are represented as A, B, C, D, E, F are
within or on the budget constraint. •If the
combination of goods are above the budget
constraint, it is not taken into consideration. GoodY
Good X 0 F C B E A D Budget set X Y Budget line P
Q Part 4 Part 1
28. Indifference Curve Analysis
A very popular, easier and scientific method of
explaining consumer’s demand is the
indifference curve analysis.
This approach to consumer behaviour is based
on consumer preferences.
Human satisfaction is psychological
phenomenon which cannot be measured in
terms of monetary terms.
This approach is more realistic to order
preferences.
Consumer preference approach is therefore an
ordinal concept based on ordering of preferences
compared with Marshall’s approach of
cardinality.
29. Indifference Curve Analysis
Indifference curve
An indifference curve is the locus of points-
particular combinations or bundles of goods-
which yield the same utility (level of satisfaction)
to the consumer, so that he is indifferent as to
the particular combination he consumes.
In other words, an indifference curve is a graph
showing combination of two goods that give the
consumer equal satisfaction and utility. Each
point on an indifference curve indicates that a
consumer is indifferent between the two and all
points give him the same utility.
U = F(X, Y) = K
30. Indifference Curve Analysis
Assumptions of an
indifference curve:
Properties of an
indifference curve:
1. Rational consumers.
2. Two commodities
3. Utility is ordinal
4. Diminishing
marginal rate of
substitution
5. Total utility of the
consumer depends on
the quantities of the
commodities
consumed.
6. Consistency and
transitivity of choice
1. Negative downward
slope
2. Further away from
the origin an
indifference curve
lies.(Higher
Indifference curves
represent higher
levels of satisfaction)
3. Indifference curve
does not intersect
4. Convex to the origin.
31.
32.
33. Marginal Rate of Substitution
MRS is the rate at which the consumer is
prepared to exchange goods X and Y.
34. Optimal choice of the consumer/
Consumer’s equilibrium
After attaining the stage of indifference curve and
budget constraint, consumer has to reach
equilibrium position.
A consumer derives maximum possible satisfaction
from the goods at equilibrium position.
A consumer cannot rearrange his purchase of goods
at that level.
Assumptions:
1. The consumer has given indifference map which
shows his scale of preferences for various
combinations of two goods X and Y.
2. He has a fixed money income which he has to
spend wholly on goods X and Y. 3. The prices of
goods X and Y are given fixed for him