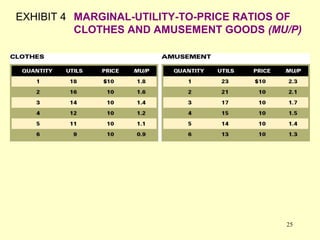
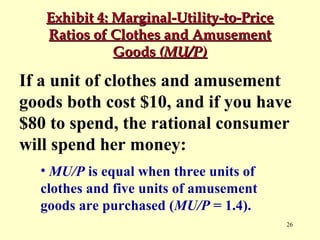
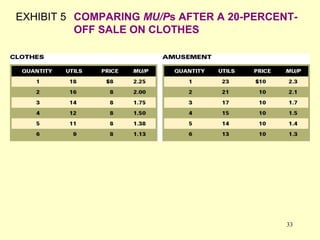
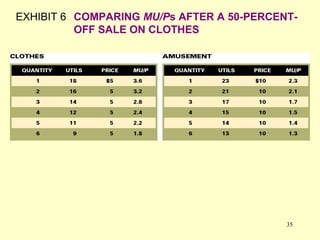
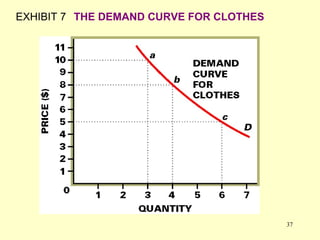
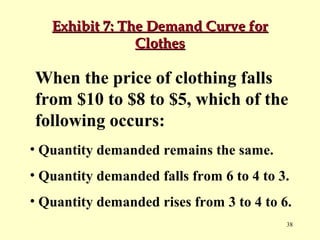
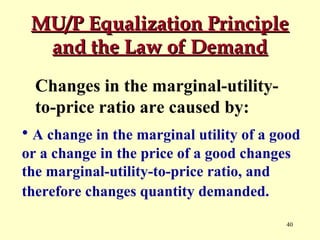
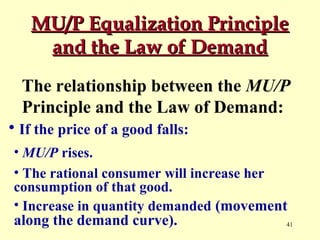
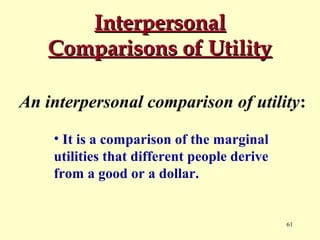
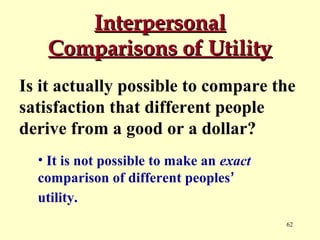
Chapter 5
Marginal Utility and
Consumer Choice
© 2002 South-Western
Economic Principles
• Total Utility and Marginal Utility
• Law of Diminishing Marginal Utility
• Relationship Between the Law of Demand
and the Marginal-Utility-To-Price Ratio
• Consumer Surplus
• Difficulties with Interpersonal Comparison
of Utility
2
What is Marginal Utility?
Util:
• It is a hypothetical unit used to
measure how much utility a person
obtains from consuming a good.
3
What is Marginal Utility?
Utility measures the satisfaction
or enjoyment a person obtains
from consuming a good.

4
What is Marginal Utility?
Law of Diminishing Marginal Utility:
• It is the idea that as more of a good is
consumed, the utility a person derives
from each additional unit diminishes.
5
What is Marginal Utility?
The implication of someone
experiencing increasing marginal
utility for pizza slices is:
• The next slice of pizza would generate
higher marginal utility than the one before.

6
What is Marginal Utility?
The implication of someone
experiencing increasing marginal
utility for pizza slices is:
• When his stomach is full to bursting from
eating so much pizza, the marginal utility
from eating yet another slice would be
higher than for any of the preceding slices.
7
What is Marginal Utility?
The implication of someone
experiencing increasing marginal
utility for pizza slices is:
• It is not clear that someone could survive
having increasing marginal utility!
8
What is Marginal Utility?
It possible for marginal
utility to become negative.
• For example, if you overeat and feel
ill, then the marginal utility for the
last bit of food you ate is negative.
9
What is Marginal Utility?
A rational consumer will not
knowingly pay to buy a unit of
a good that generates negative
marginal utility.
• Presumably something else could be
bought that generates positive marginal
utility.
• Buying something that generates negative
marginal utility is not consistent with
utility maximization.
10
EXHIBIT 1 TOTAL UTILITY AND MARGINAL UTILITY
DERIVED FROM CONSUMING T-BONE
STEAKS (UTILS)

11
Exhibit 1: Total Utility and Marginal
Utility Derived From Consuming TBone Steaks (Utils)

If marginal utility is declining,
but is still positive, total utility is:
• Total utility increases as long as
marginal utility is positive.
12
Exhibit 1: Total Utility and Marginal
Utility Derived From Consuming TBone Steaks (Utils)

If marginal utility is declining,
but is still positive, total utility is:
• In Exhibit 1, total utility reaches its
maximum at five t-bone steaks. Consuming
more than five steaks will reduce total utility.
13
EXHIBIT 2A TOTAL AND MARGINAL UTILITY

14
EXHIBIT 2B TOTAL AND MARGINAL UTILITY

15
Exhibit 2: Total and
Marginal Utility
In Exhibit 2, the curves in
Panel a and b represent:
• The curve in Panel a is the total utility
curve for T-bone steaks.

• Panel a depicts the number of utils, or
the amount of utility, a person gains from
consuming a certain number of steaks.
16
Exhibit 2: Total and
Marginal Utility
In Exhibit 2, the curves in
Panel a and b represent:
• Total utility peaks at 81 utils, or 5 steaks.
Each steak consumed beyond 5 reduces
total utility.

17
Exhibit 2: Total and
Marginal Utility
In Exhibit 2, the curves in
Panel a and b represent:
• The curve in Panel b is the marginal
utility curve for T-bone steaks.

• The curve depicts the change in total
utility a person derives from consuming
each additional steak.

18
Exhibit 2: Total and
Marginal Utility
In Exhibit 2, the curves in
Panel a and b represent:
• When marginal utility is zero, total
utility is maximized.

19
What is Marginal Utility?
If water is necessary for life, then
the market price of water so much
lower than for diamonds because:
• Market price reflects marginal utility,
not total utility.
• Due to the law of diminishing marginal utility
and the abundance of water, the marginal
utility of water is lower than for diamonds.
20
What is Marginal Utility?
A hypothetical circumstance in
which the marginal utility of
water might exceed the marginal
utility of a diamond:
• If you are lost in the desert and are
severely dehydrated, then your marginal
utility for a gallon of water might exceed
your marginal utility for a diamond.
21
French Cuisine and Marginal
Utility
Many courses, each with small portions
of food (French cuisine), may generate
more utility than one course with a
large portion of food because:
• One large portion will drive down marginal
utility.

• Marginal utility is high for the whole meal.
22
EXHIBIT 3 MARGINAL UTILITIES OF CLOTHES AND
AMUSEMENT GOODS (UTILS)

23
Exhibit 3: Marginal Utilities of Clothes
and Amusement Goods (Utils)

Based on the utility data in Exhibit
3, a rational consumer will select the
best combination of clothes and
amusement goods:
• By sequentially picking units of clothing
and amusement goods that generate the
largest MU/P.
24
EXHIBIT 4 MARGINAL-UTILITY-TO-PRICE RATIOS OF
CLOTHES AND AMUSEMENT GOODS (MU/P)

25
Exhibit 4: Marginal-Utility-to-Price
Ratios of Clothes and Amusement
Goods (MU/P)

If a unit of clothes and amusement
goods both cost $10, and if you have
$80 to spend, the rational consumer
will spend her money:
• MU/P is equal when three units of
clothes and five units of amusement
goods are purchased (MU/P = 1.4).
26
Marginal-Utility-to-Price
Ratio
Marginal-utility-to-price ratio:
• The ratio is calculated by dividing
the marginal utility of a good by the
price of the good -- MU/P.

27
Marginal-Utility-to-Price
Ratio
The MU/P equalization principle:
• A person’s total utility is maximized
when the ratios of marginal utility to
price for the last unit of each of the goods
consumed are equal.
28
Marginal-Utility-to-Price
Ratio
The MU/P equalization principle:
• MU/P measures marginal utility per dollar
spent.

• Total utility will be maximized (within the
constraints of a limited budget) when each
individual purchase generates the largest
possible MU/P.

29
Marginal-Utility-to-Price
Ratio
The MU/P equalization principle:
• A rational and fully-informed consumer will
always shift a dollar from a good whose MU/P
is lower to one whose MU/P is higher, if such a
shift is possible.
30
Marginal-Utility-to-Price
Ratio
The MU/P equalization principle:
• The principle is based on consumer behavior.
• Consumers will always arrange their
sequence of choices among goods starting with
the highest MU/P and running down to exhaust
an expenditure budget.
31
Marginal-Utility-to-Price
Ratio
The MU/P equalization principle:
• The consumer choice process is in
equilibrium when:
• There is no longer any incentive for
the consumer to rearrange her
purchases. is equal for the last unit
• The MU/P
of each good or service consumed.

32
EXHIBIT 5 COMPARING MU/Ps AFTER A 20-PERCENTOFF SALE ON CLOTHES

33
Exhibit 5: Comparing MU/Ps After a 20
Percent Off Sale on Clothes

The MU/P of clothes changes
when there is a 20 percent off
sale on clothes by:
• MU/P for each unit of clothing rises when
price is reduced by 20 percent.
• This will cause a rational
consumer to consume more clothes.
34
EXHIBIT 6 COMPARING MU/Ps AFTER A 50-PERCENTOFF SALE ON CLOTHES

35
Exhibit 6: Comparing MU/Ps After a 50
Percent Off Sale on Clothes

An additional reduction in the price
of clothing will change all of the
MU/Ps for clothing, and thus change
a rational consumer’s consumption
of clothing.
• If the price of clothes falls again, from $8
to $5, the quantity of clothing demanded
increases from four to six units.
36
EXHIBIT 7 THE DEMAND CURVE FOR CLOTHES

37
Exhibit 7: The Demand Curve for
Clothes

When the price of clothing falls
from $10 to $8 to $5, which of the
following occurs:
• Quantity demanded remains the same.
• Quantity demanded falls from 6 to 4 to 3.
• Quantity demanded rises from 3 to 4 to 6.
38
Exhibit 7: The Demand Curve for
Clothes

When the price of clothing falls
from $10 to $8 to $5, which of the
following occurs:
• Quantity demanded remains the same.
• Quantity demanded falls from 6 to 4 to 3.
• Quantity demanded rises from 3 to 4 to 6.
39
MU/P Equalization Principle
and the Law of Demand
Changes in the marginal-utilityto-price ratio are caused by:
• A change in the marginal utility of a good
or a change in the price of a good changes
the marginal-utility-to-price ratio, and
therefore changes quantity demanded.
40
MU/P Equalization Principle
and the Law of Demand
The relationship between the MU/P
Principle and the Law of Demand:
• If the price of a good falls:
• MU/P rises.
• The rational consumer will increase her
consumption of that good.
• Increase in quantity demanded (movement

along the demand curve).

41
MU/P Equalization Principle
and the Law of Demand
The relationship between the MU/P
Principle and the Law of Demand:
• If consumer preference for a good decreases:
• MU/P declines.
• The rational consumer will reduce
consumption.
• The demand curve shifts to the left (since
consumer preference is a non-price factor).

42
MU/P Equalization Principle
and the Law of Demand
The relationship between the MU/P
Principle and the Law of Demand:
• If consumer income increases:
• The consumer can pursue a lower MU/P.
• The consumer can afford to increase
consumption.
• An increase in the demand for normal goods.
43
MU/P Equalization Principle
and the Law of Demand
A downward-sloping demand
curve is consistent with the law
of diminishing marginal utility.
• Diminishing marginal utility
means that MU/P declines as
quantity consumed increases.
44
MU/P Equalization Principle
and the Law of Demand
A downward-sloping demand
curve is consistent with the law
of diminishing marginal utility.
• A consumer’s willingness-topay falls as quantity consumed
increases.
45
Are White Rats Rational
Consumers?
There is evidence that lab rats
make consumer choices based
on MU/P.
• Economists Battalio and Kagel found
that white lab rats respond to price and
income changes in a manner consistent
with economic theory.
46
The MU/P Guide to
Auction Bidding
MU/P can help guide auction bidding:
• If a particular MU/P is guaranteed by
buying something outside of the auction,
and if the marginal utility from the auction
good is known, then you can figure out
your maximum auction price.
47
Creating Consumer
Surplus
Consumer surplus:
• The difference between the maximum price a
person would be willing to pay for a good or
service, and the price the person actually pays.

• Most consumers receive some consumer
surplus from a transaction.
48
Creating Consumer
Surplus
When market price falls,
consumer surplus increases.

49
Creating Consumer
Surplus
If the price of a good is greater
than amount a consumer is willing
to pay for that good, the consumer
surplus will be negative if the
consumer buys the good.
50
Creating Consumer
Surplus
A rational consumer will not
purchase a good that generates
negative consumer surplus.
• A rational consumer will prefer zero
consumer surplus (no purchase) to
negative consumer surplus.
51
EXHIBIT 8 THE MARKET FOR HORSEBACK RIDING

52
Exhibit 8: The Market for
Horseback Riding
Exhibit 8 depicts the demand and
supply curves for horseback riding.
The concept of consumer surplus
applies to horseback riding:
• At a price of $6, all consumers with a
willingness-to-pay value of $6 or more will
purchase a horseback ride.
• These consumers receive consumer surplus.
53
Exhibit 8: The Market for
Horseback Riding
Exhibit 8 depicts the demand and
supply curves for horseback riding.
The concept of consumer surplus
applies to horseback riding:
• Some consumer may be willing to pay
$10 for a horseback ride.
• This consumer will receive $(10-6) = $4
of consumer surplus.

54
Exhibit 8: The Market for
Horseback Riding
Exhibit 8 depicts the demand and
supply curves for horseback riding.
The concept of consumer surplus
applies to horseback riding:
• A consumer who has a willingness-to-pay
value less than $6:
• This consumer has a negative consumer
surplus.
• A rational consumer will not choose to
purchase a ride.

55
EXHIBIT 9 CONSUMER SURPLUS ON THE HORSEBACKRIDING MARKET

56
Exhibit 9: Consumer Surplus on
the Horseback-Riding Market
Kim’s consumer surplus from
horseback riding is:
• $(15-6) for the first ride.
• $(12-6) for the second ride.
• $(9-6) for the third ride.
• $(6-6) for the fourth ride.
• These sum to $(9+6+3+0) = $18.

57
Exhibit 9: Consumer Surplus on
the Horseback-Riding Market
Tony’s consumer surplus
from horseback riding is:
• $(10-6) for the first ride.
• $(8-6) for the second ride.
• $(6-6) for the fourth ride.
• These sum to $(4+2+0) = $6.
58
Exhibit 9: Consumer Surplus on
the Horseback-Riding Market
Randy’s consumer surplus
from horseback riding is:
• $(9-6) for the first ride.
• $(6-6) for the fourth ride.
• These sum to $(3+0) = $3.

59
Exhibit 9: Consumer Surplus on
the Horseback-Riding Market
If Kim, Tony and Randy represent the
entire market demand for horseback
riding, the total consumer surplus is:
• $18 (Kim) + $6 (Tony) + $3 (Randy)
= $27 in consumer surplus

60
Interpersonal
Comparisons of Utility
An interpersonal comparison of utility:
• It is a comparison of the marginal
utilities that different people derive
from a good or a dollar.

61
Interpersonal
Comparisons of Utility
Is it actually possible to compare the
satisfaction that different people
derive from a good or a dollar?
• It is not possible to make an exact
comparison of different peoples’
utility.
62
Interpersonal
Comparisons of Utility
Is it actually possible to compare the
satisfaction that different people
derive from a good or a dollar?
• Policies such as those aimed at poverty
alleviation rely on society being able to make
approximate or reasonable comparisons of
utility across different people.

63

Marg util powerpoint

  • 1.
    Chapter 5 Marginal Utilityand Consumer Choice © 2002 South-Western
  • 2.
    Economic Principles • TotalUtility and Marginal Utility • Law of Diminishing Marginal Utility • Relationship Between the Law of Demand and the Marginal-Utility-To-Price Ratio • Consumer Surplus • Difficulties with Interpersonal Comparison of Utility 2
  • 3.
    What is MarginalUtility? Util: • It is a hypothetical unit used to measure how much utility a person obtains from consuming a good. 3
  • 4.
    What is MarginalUtility? Utility measures the satisfaction or enjoyment a person obtains from consuming a good. 4
  • 5.
    What is MarginalUtility? Law of Diminishing Marginal Utility: • It is the idea that as more of a good is consumed, the utility a person derives from each additional unit diminishes. 5
  • 6.
    What is MarginalUtility? The implication of someone experiencing increasing marginal utility for pizza slices is: • The next slice of pizza would generate higher marginal utility than the one before. 6
  • 7.
    What is MarginalUtility? The implication of someone experiencing increasing marginal utility for pizza slices is: • When his stomach is full to bursting from eating so much pizza, the marginal utility from eating yet another slice would be higher than for any of the preceding slices. 7
  • 8.
    What is MarginalUtility? The implication of someone experiencing increasing marginal utility for pizza slices is: • It is not clear that someone could survive having increasing marginal utility! 8
  • 9.
    What is MarginalUtility? It possible for marginal utility to become negative. • For example, if you overeat and feel ill, then the marginal utility for the last bit of food you ate is negative. 9
  • 10.
    What is MarginalUtility? A rational consumer will not knowingly pay to buy a unit of a good that generates negative marginal utility. • Presumably something else could be bought that generates positive marginal utility. • Buying something that generates negative marginal utility is not consistent with utility maximization. 10
  • 11.
    EXHIBIT 1 TOTALUTILITY AND MARGINAL UTILITY DERIVED FROM CONSUMING T-BONE STEAKS (UTILS) 11
  • 12.
    Exhibit 1: TotalUtility and Marginal Utility Derived From Consuming TBone Steaks (Utils) If marginal utility is declining, but is still positive, total utility is: • Total utility increases as long as marginal utility is positive. 12
  • 13.
    Exhibit 1: TotalUtility and Marginal Utility Derived From Consuming TBone Steaks (Utils) If marginal utility is declining, but is still positive, total utility is: • In Exhibit 1, total utility reaches its maximum at five t-bone steaks. Consuming more than five steaks will reduce total utility. 13
  • 14.
    EXHIBIT 2A TOTALAND MARGINAL UTILITY 14
  • 15.
    EXHIBIT 2B TOTALAND MARGINAL UTILITY 15
  • 16.
    Exhibit 2: Totaland Marginal Utility In Exhibit 2, the curves in Panel a and b represent: • The curve in Panel a is the total utility curve for T-bone steaks. • Panel a depicts the number of utils, or the amount of utility, a person gains from consuming a certain number of steaks. 16
  • 17.
    Exhibit 2: Totaland Marginal Utility In Exhibit 2, the curves in Panel a and b represent: • Total utility peaks at 81 utils, or 5 steaks. Each steak consumed beyond 5 reduces total utility. 17
  • 18.
    Exhibit 2: Totaland Marginal Utility In Exhibit 2, the curves in Panel a and b represent: • The curve in Panel b is the marginal utility curve for T-bone steaks. • The curve depicts the change in total utility a person derives from consuming each additional steak. 18
  • 19.
    Exhibit 2: Totaland Marginal Utility In Exhibit 2, the curves in Panel a and b represent: • When marginal utility is zero, total utility is maximized. 19
  • 20.
    What is MarginalUtility? If water is necessary for life, then the market price of water so much lower than for diamonds because: • Market price reflects marginal utility, not total utility. • Due to the law of diminishing marginal utility and the abundance of water, the marginal utility of water is lower than for diamonds. 20
  • 21.
    What is MarginalUtility? A hypothetical circumstance in which the marginal utility of water might exceed the marginal utility of a diamond: • If you are lost in the desert and are severely dehydrated, then your marginal utility for a gallon of water might exceed your marginal utility for a diamond. 21
  • 22.
    French Cuisine andMarginal Utility Many courses, each with small portions of food (French cuisine), may generate more utility than one course with a large portion of food because: • One large portion will drive down marginal utility. • Marginal utility is high for the whole meal. 22
  • 23.
    EXHIBIT 3 MARGINALUTILITIES OF CLOTHES AND AMUSEMENT GOODS (UTILS) 23
  • 24.
    Exhibit 3: MarginalUtilities of Clothes and Amusement Goods (Utils) Based on the utility data in Exhibit 3, a rational consumer will select the best combination of clothes and amusement goods: • By sequentially picking units of clothing and amusement goods that generate the largest MU/P. 24
  • 25.
    EXHIBIT 4 MARGINAL-UTILITY-TO-PRICERATIOS OF CLOTHES AND AMUSEMENT GOODS (MU/P) 25
  • 26.
    Exhibit 4: Marginal-Utility-to-Price Ratiosof Clothes and Amusement Goods (MU/P) If a unit of clothes and amusement goods both cost $10, and if you have $80 to spend, the rational consumer will spend her money: • MU/P is equal when three units of clothes and five units of amusement goods are purchased (MU/P = 1.4). 26
  • 27.
    Marginal-Utility-to-Price Ratio Marginal-utility-to-price ratio: • Theratio is calculated by dividing the marginal utility of a good by the price of the good -- MU/P. 27
  • 28.
    Marginal-Utility-to-Price Ratio The MU/P equalizationprinciple: • A person’s total utility is maximized when the ratios of marginal utility to price for the last unit of each of the goods consumed are equal. 28
  • 29.
    Marginal-Utility-to-Price Ratio The MU/P equalizationprinciple: • MU/P measures marginal utility per dollar spent. • Total utility will be maximized (within the constraints of a limited budget) when each individual purchase generates the largest possible MU/P. 29
  • 30.
    Marginal-Utility-to-Price Ratio The MU/P equalizationprinciple: • A rational and fully-informed consumer will always shift a dollar from a good whose MU/P is lower to one whose MU/P is higher, if such a shift is possible. 30
  • 31.
    Marginal-Utility-to-Price Ratio The MU/P equalizationprinciple: • The principle is based on consumer behavior. • Consumers will always arrange their sequence of choices among goods starting with the highest MU/P and running down to exhaust an expenditure budget. 31
  • 32.
    Marginal-Utility-to-Price Ratio The MU/P equalizationprinciple: • The consumer choice process is in equilibrium when: • There is no longer any incentive for the consumer to rearrange her purchases. is equal for the last unit • The MU/P of each good or service consumed. 32
  • 33.
    EXHIBIT 5 COMPARINGMU/Ps AFTER A 20-PERCENTOFF SALE ON CLOTHES 33
  • 34.
    Exhibit 5: ComparingMU/Ps After a 20 Percent Off Sale on Clothes The MU/P of clothes changes when there is a 20 percent off sale on clothes by: • MU/P for each unit of clothing rises when price is reduced by 20 percent. • This will cause a rational consumer to consume more clothes. 34
  • 35.
    EXHIBIT 6 COMPARINGMU/Ps AFTER A 50-PERCENTOFF SALE ON CLOTHES 35
  • 36.
    Exhibit 6: ComparingMU/Ps After a 50 Percent Off Sale on Clothes An additional reduction in the price of clothing will change all of the MU/Ps for clothing, and thus change a rational consumer’s consumption of clothing. • If the price of clothes falls again, from $8 to $5, the quantity of clothing demanded increases from four to six units. 36
  • 37.
    EXHIBIT 7 THEDEMAND CURVE FOR CLOTHES 37
  • 38.
    Exhibit 7: TheDemand Curve for Clothes When the price of clothing falls from $10 to $8 to $5, which of the following occurs: • Quantity demanded remains the same. • Quantity demanded falls from 6 to 4 to 3. • Quantity demanded rises from 3 to 4 to 6. 38
  • 39.
    Exhibit 7: TheDemand Curve for Clothes When the price of clothing falls from $10 to $8 to $5, which of the following occurs: • Quantity demanded remains the same. • Quantity demanded falls from 6 to 4 to 3. • Quantity demanded rises from 3 to 4 to 6. 39
  • 40.
    MU/P Equalization Principle andthe Law of Demand Changes in the marginal-utilityto-price ratio are caused by: • A change in the marginal utility of a good or a change in the price of a good changes the marginal-utility-to-price ratio, and therefore changes quantity demanded. 40
  • 41.
    MU/P Equalization Principle andthe Law of Demand The relationship between the MU/P Principle and the Law of Demand: • If the price of a good falls: • MU/P rises. • The rational consumer will increase her consumption of that good. • Increase in quantity demanded (movement along the demand curve). 41
  • 42.
    MU/P Equalization Principle andthe Law of Demand The relationship between the MU/P Principle and the Law of Demand: • If consumer preference for a good decreases: • MU/P declines. • The rational consumer will reduce consumption. • The demand curve shifts to the left (since consumer preference is a non-price factor). 42
  • 43.
    MU/P Equalization Principle andthe Law of Demand The relationship between the MU/P Principle and the Law of Demand: • If consumer income increases: • The consumer can pursue a lower MU/P. • The consumer can afford to increase consumption. • An increase in the demand for normal goods. 43
  • 44.
    MU/P Equalization Principle andthe Law of Demand A downward-sloping demand curve is consistent with the law of diminishing marginal utility. • Diminishing marginal utility means that MU/P declines as quantity consumed increases. 44
  • 45.
    MU/P Equalization Principle andthe Law of Demand A downward-sloping demand curve is consistent with the law of diminishing marginal utility. • A consumer’s willingness-topay falls as quantity consumed increases. 45
  • 46.
    Are White RatsRational Consumers? There is evidence that lab rats make consumer choices based on MU/P. • Economists Battalio and Kagel found that white lab rats respond to price and income changes in a manner consistent with economic theory. 46
  • 47.
    The MU/P Guideto Auction Bidding MU/P can help guide auction bidding: • If a particular MU/P is guaranteed by buying something outside of the auction, and if the marginal utility from the auction good is known, then you can figure out your maximum auction price. 47
  • 48.
    Creating Consumer Surplus Consumer surplus: •The difference between the maximum price a person would be willing to pay for a good or service, and the price the person actually pays. • Most consumers receive some consumer surplus from a transaction. 48
  • 49.
    Creating Consumer Surplus When marketprice falls, consumer surplus increases. 49
  • 50.
    Creating Consumer Surplus If theprice of a good is greater than amount a consumer is willing to pay for that good, the consumer surplus will be negative if the consumer buys the good. 50
  • 51.
    Creating Consumer Surplus A rationalconsumer will not purchase a good that generates negative consumer surplus. • A rational consumer will prefer zero consumer surplus (no purchase) to negative consumer surplus. 51
  • 52.
    EXHIBIT 8 THEMARKET FOR HORSEBACK RIDING 52
  • 53.
    Exhibit 8: TheMarket for Horseback Riding Exhibit 8 depicts the demand and supply curves for horseback riding. The concept of consumer surplus applies to horseback riding: • At a price of $6, all consumers with a willingness-to-pay value of $6 or more will purchase a horseback ride. • These consumers receive consumer surplus. 53
  • 54.
    Exhibit 8: TheMarket for Horseback Riding Exhibit 8 depicts the demand and supply curves for horseback riding. The concept of consumer surplus applies to horseback riding: • Some consumer may be willing to pay $10 for a horseback ride. • This consumer will receive $(10-6) = $4 of consumer surplus. 54
  • 55.
    Exhibit 8: TheMarket for Horseback Riding Exhibit 8 depicts the demand and supply curves for horseback riding. The concept of consumer surplus applies to horseback riding: • A consumer who has a willingness-to-pay value less than $6: • This consumer has a negative consumer surplus. • A rational consumer will not choose to purchase a ride. 55
  • 56.
    EXHIBIT 9 CONSUMERSURPLUS ON THE HORSEBACKRIDING MARKET 56
  • 57.
    Exhibit 9: ConsumerSurplus on the Horseback-Riding Market Kim’s consumer surplus from horseback riding is: • $(15-6) for the first ride. • $(12-6) for the second ride. • $(9-6) for the third ride. • $(6-6) for the fourth ride. • These sum to $(9+6+3+0) = $18. 57
  • 58.
    Exhibit 9: ConsumerSurplus on the Horseback-Riding Market Tony’s consumer surplus from horseback riding is: • $(10-6) for the first ride. • $(8-6) for the second ride. • $(6-6) for the fourth ride. • These sum to $(4+2+0) = $6. 58
  • 59.
    Exhibit 9: ConsumerSurplus on the Horseback-Riding Market Randy’s consumer surplus from horseback riding is: • $(9-6) for the first ride. • $(6-6) for the fourth ride. • These sum to $(3+0) = $3. 59
  • 60.
    Exhibit 9: ConsumerSurplus on the Horseback-Riding Market If Kim, Tony and Randy represent the entire market demand for horseback riding, the total consumer surplus is: • $18 (Kim) + $6 (Tony) + $3 (Randy) = $27 in consumer surplus 60
  • 61.
    Interpersonal Comparisons of Utility Aninterpersonal comparison of utility: • It is a comparison of the marginal utilities that different people derive from a good or a dollar. 61
  • 62.
    Interpersonal Comparisons of Utility Isit actually possible to compare the satisfaction that different people derive from a good or a dollar? • It is not possible to make an exact comparison of different peoples’ utility. 62
  • 63.
    Interpersonal Comparisons of Utility Isit actually possible to compare the satisfaction that different people derive from a good or a dollar? • Policies such as those aimed at poverty alleviation rely on society being able to make approximate or reasonable comparisons of utility across different people. 63