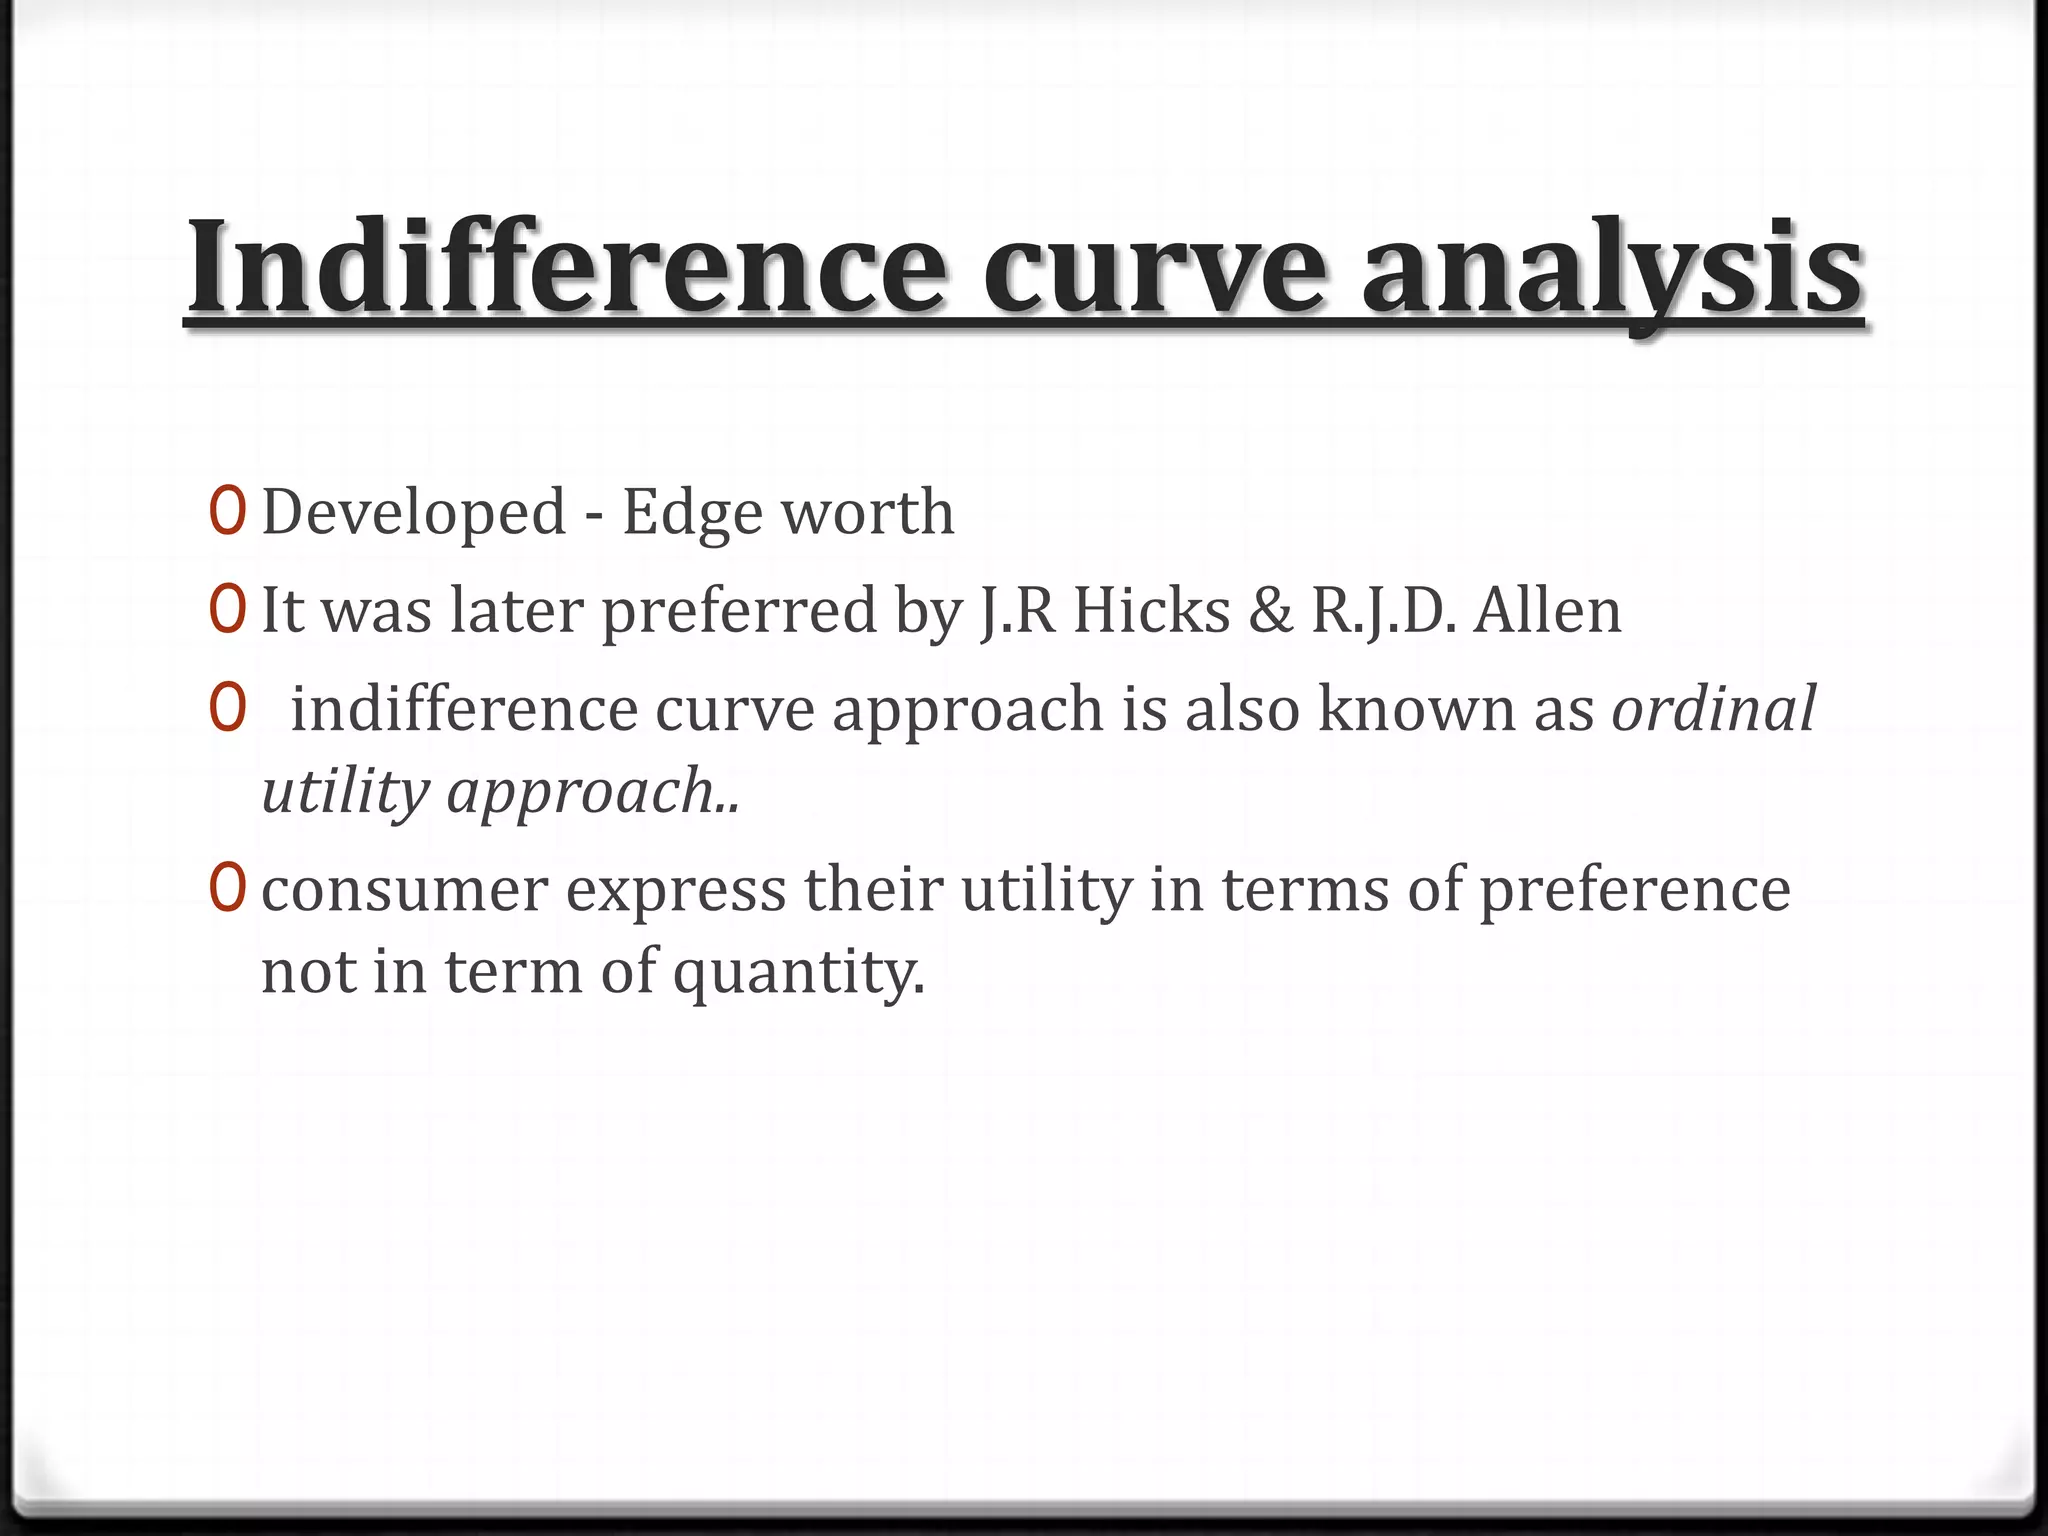
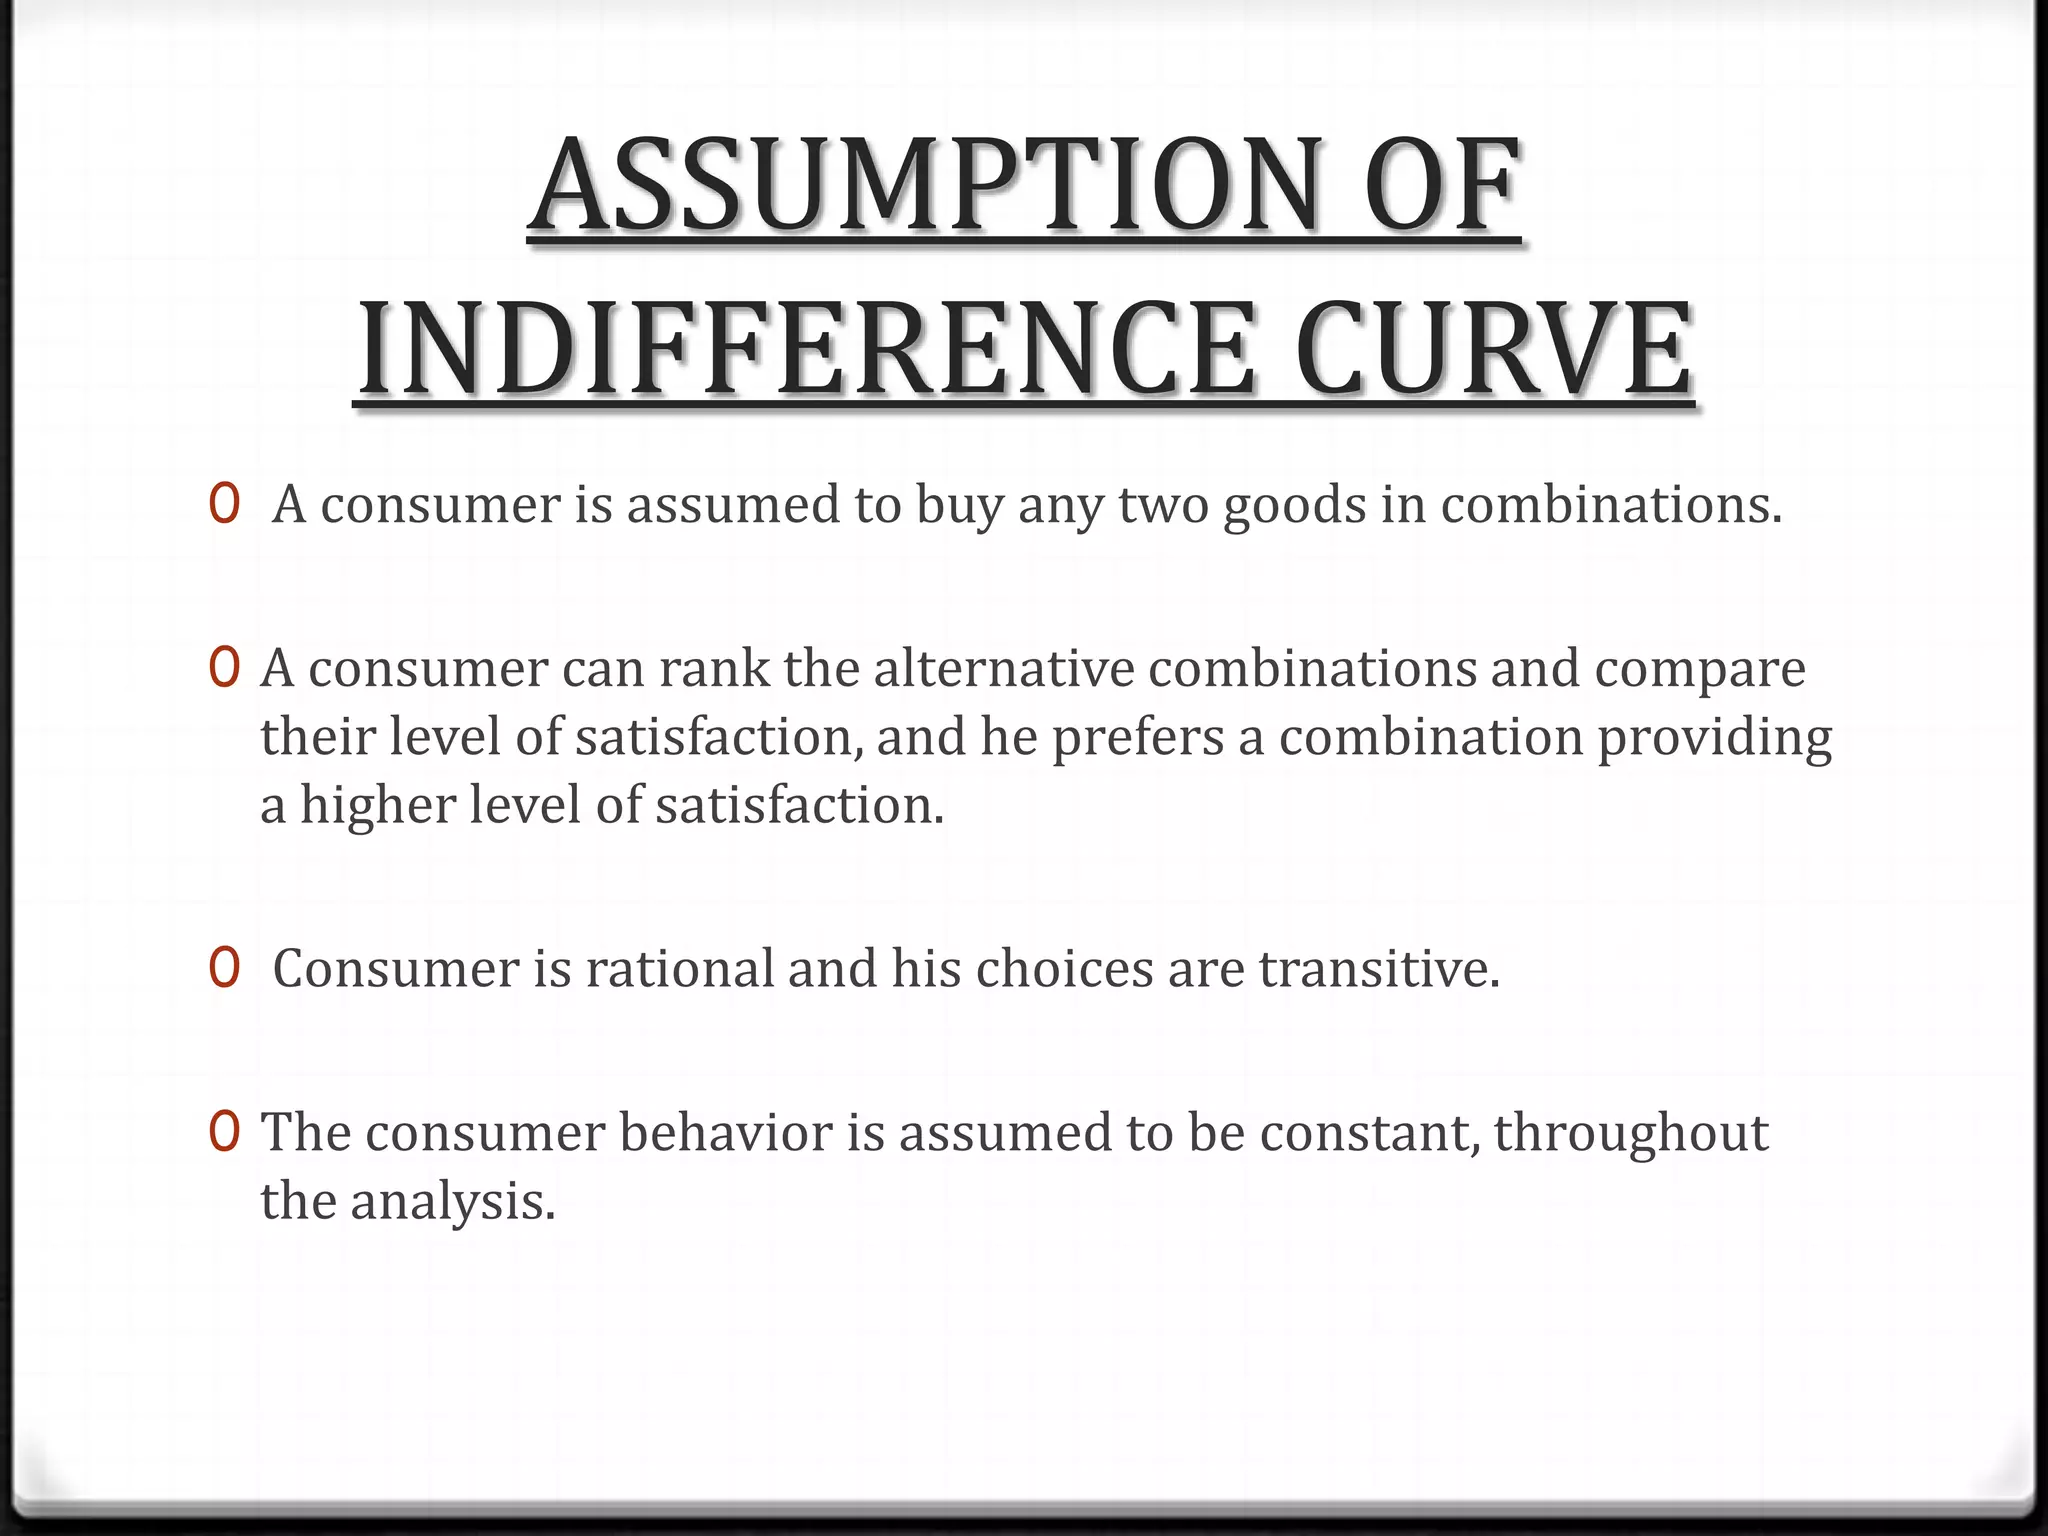
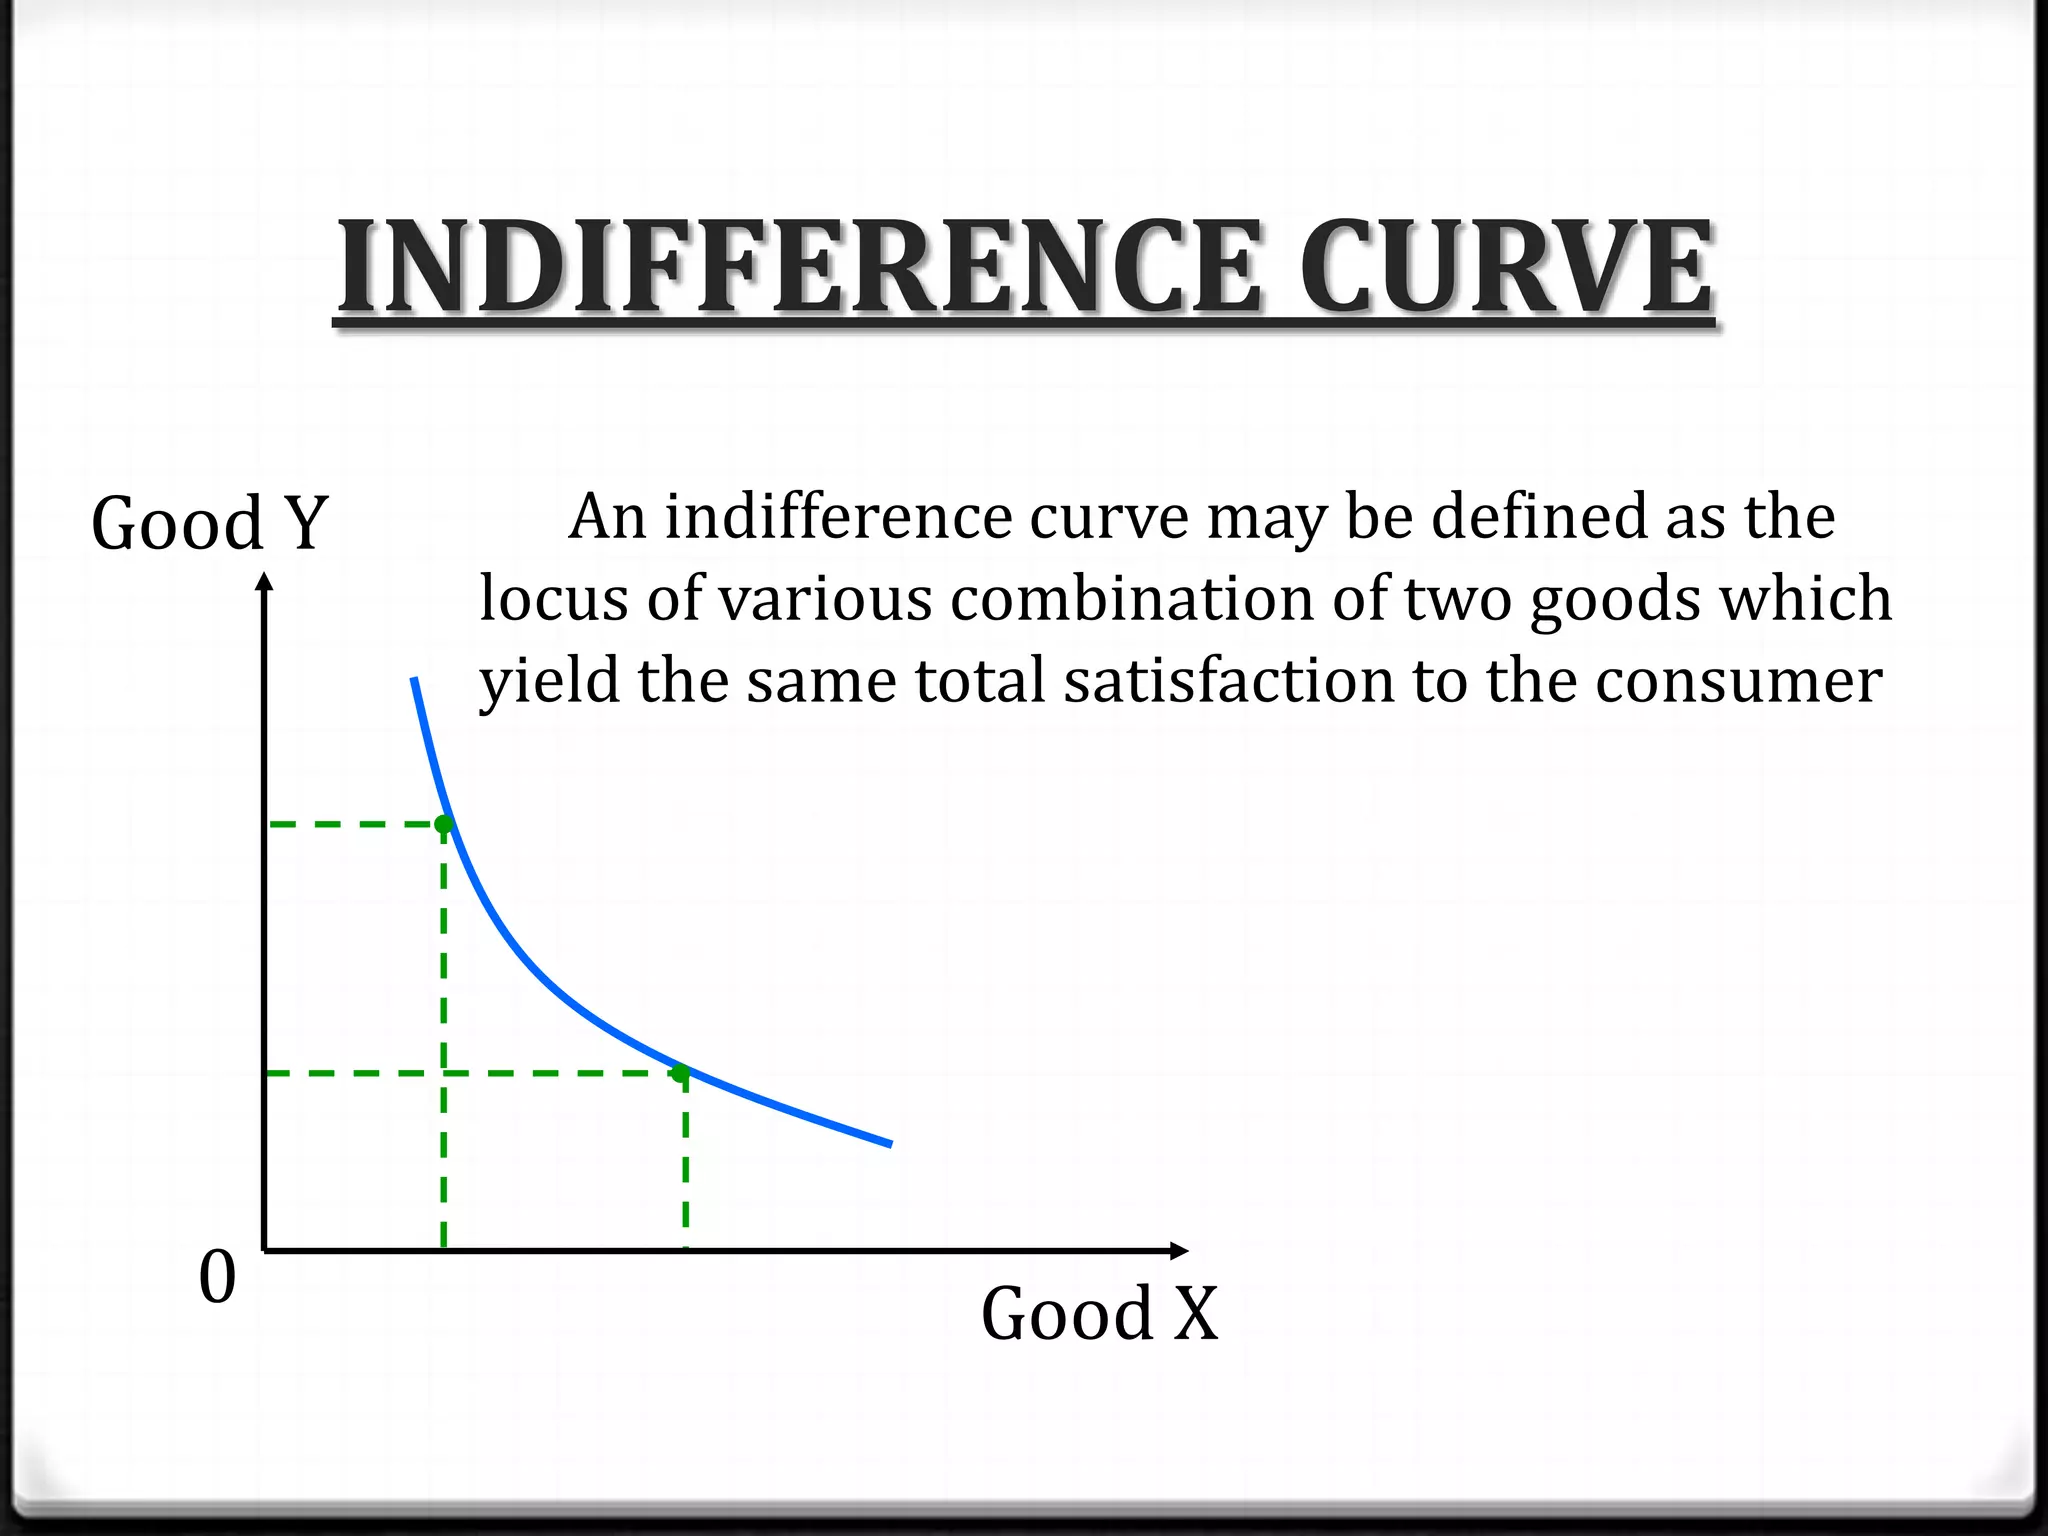
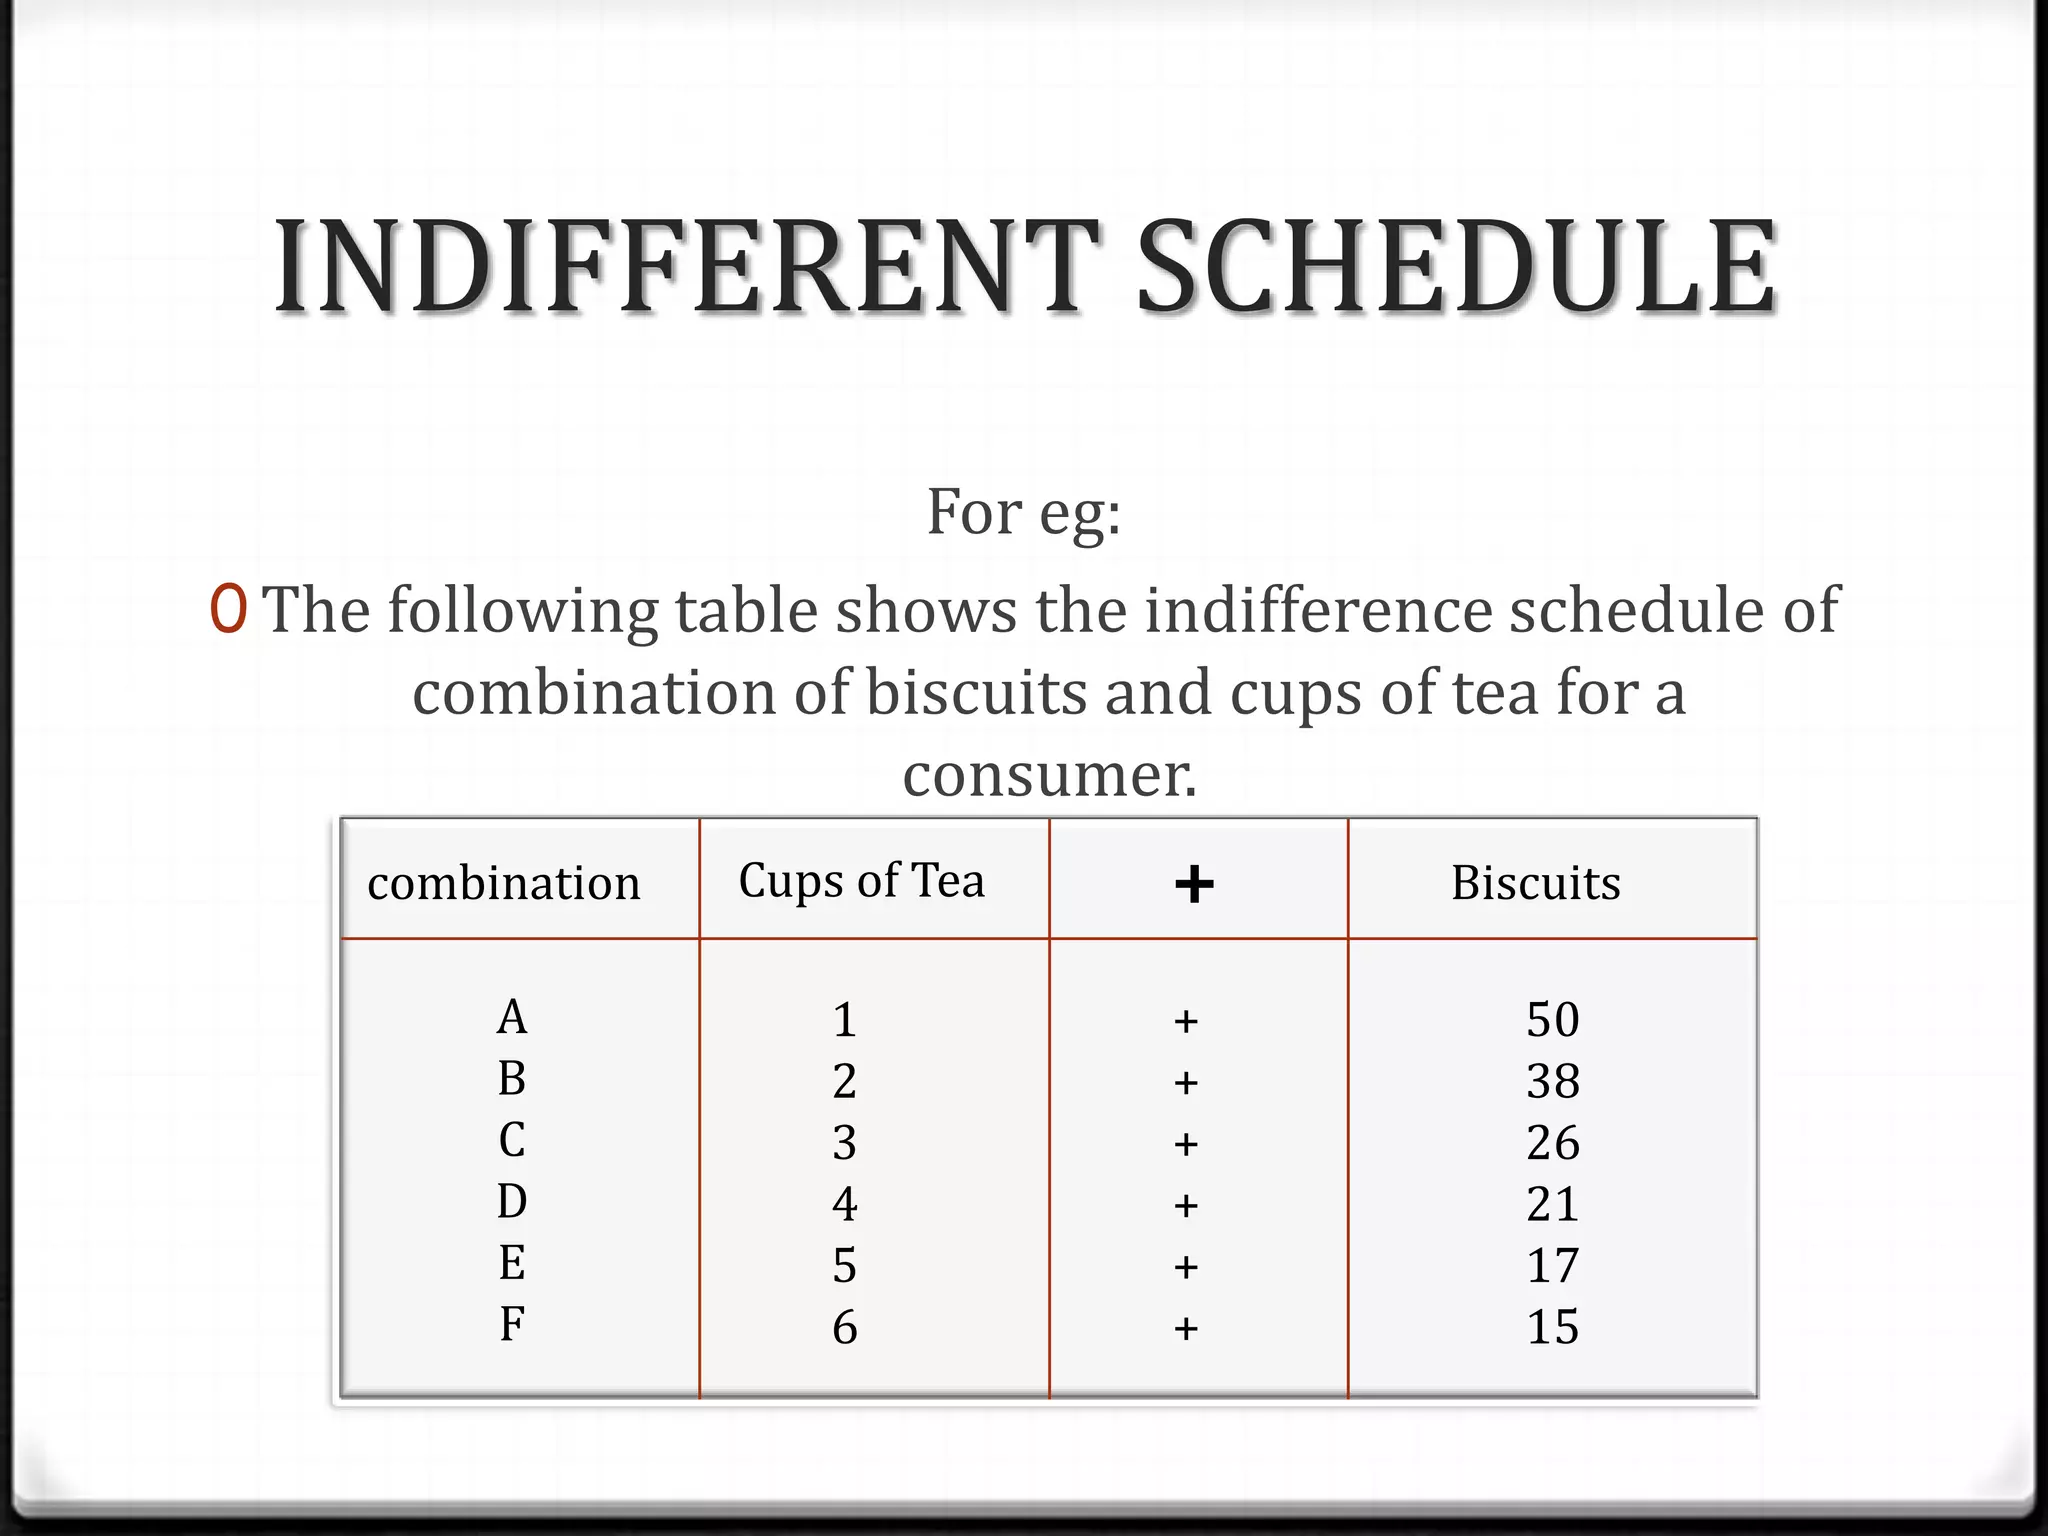
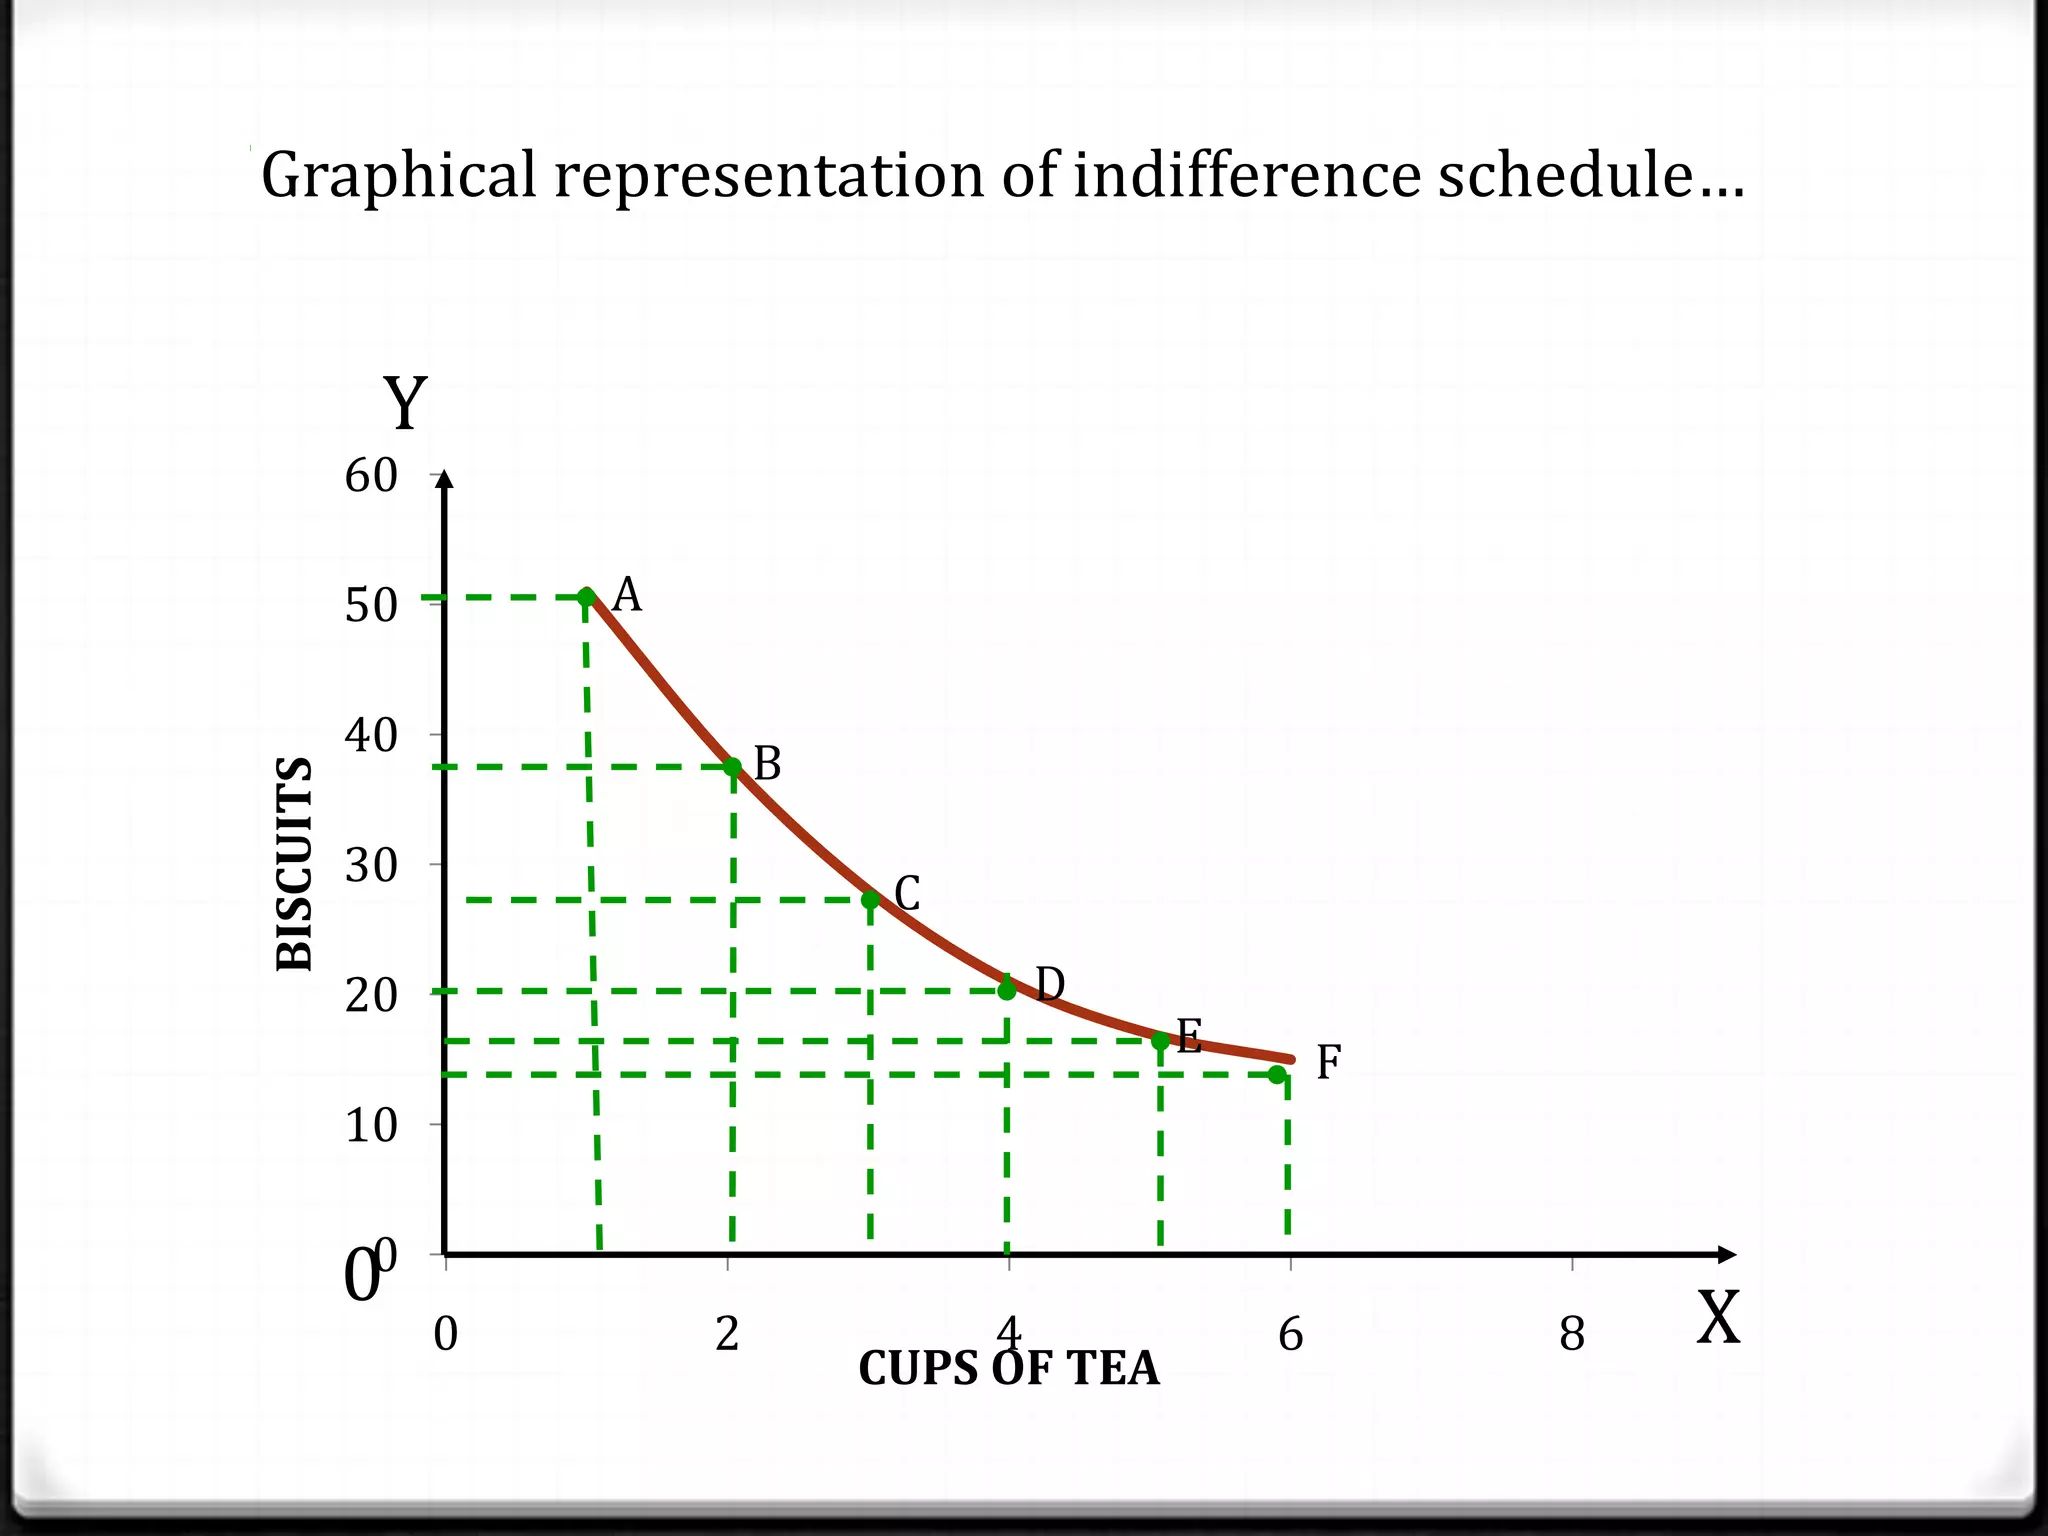
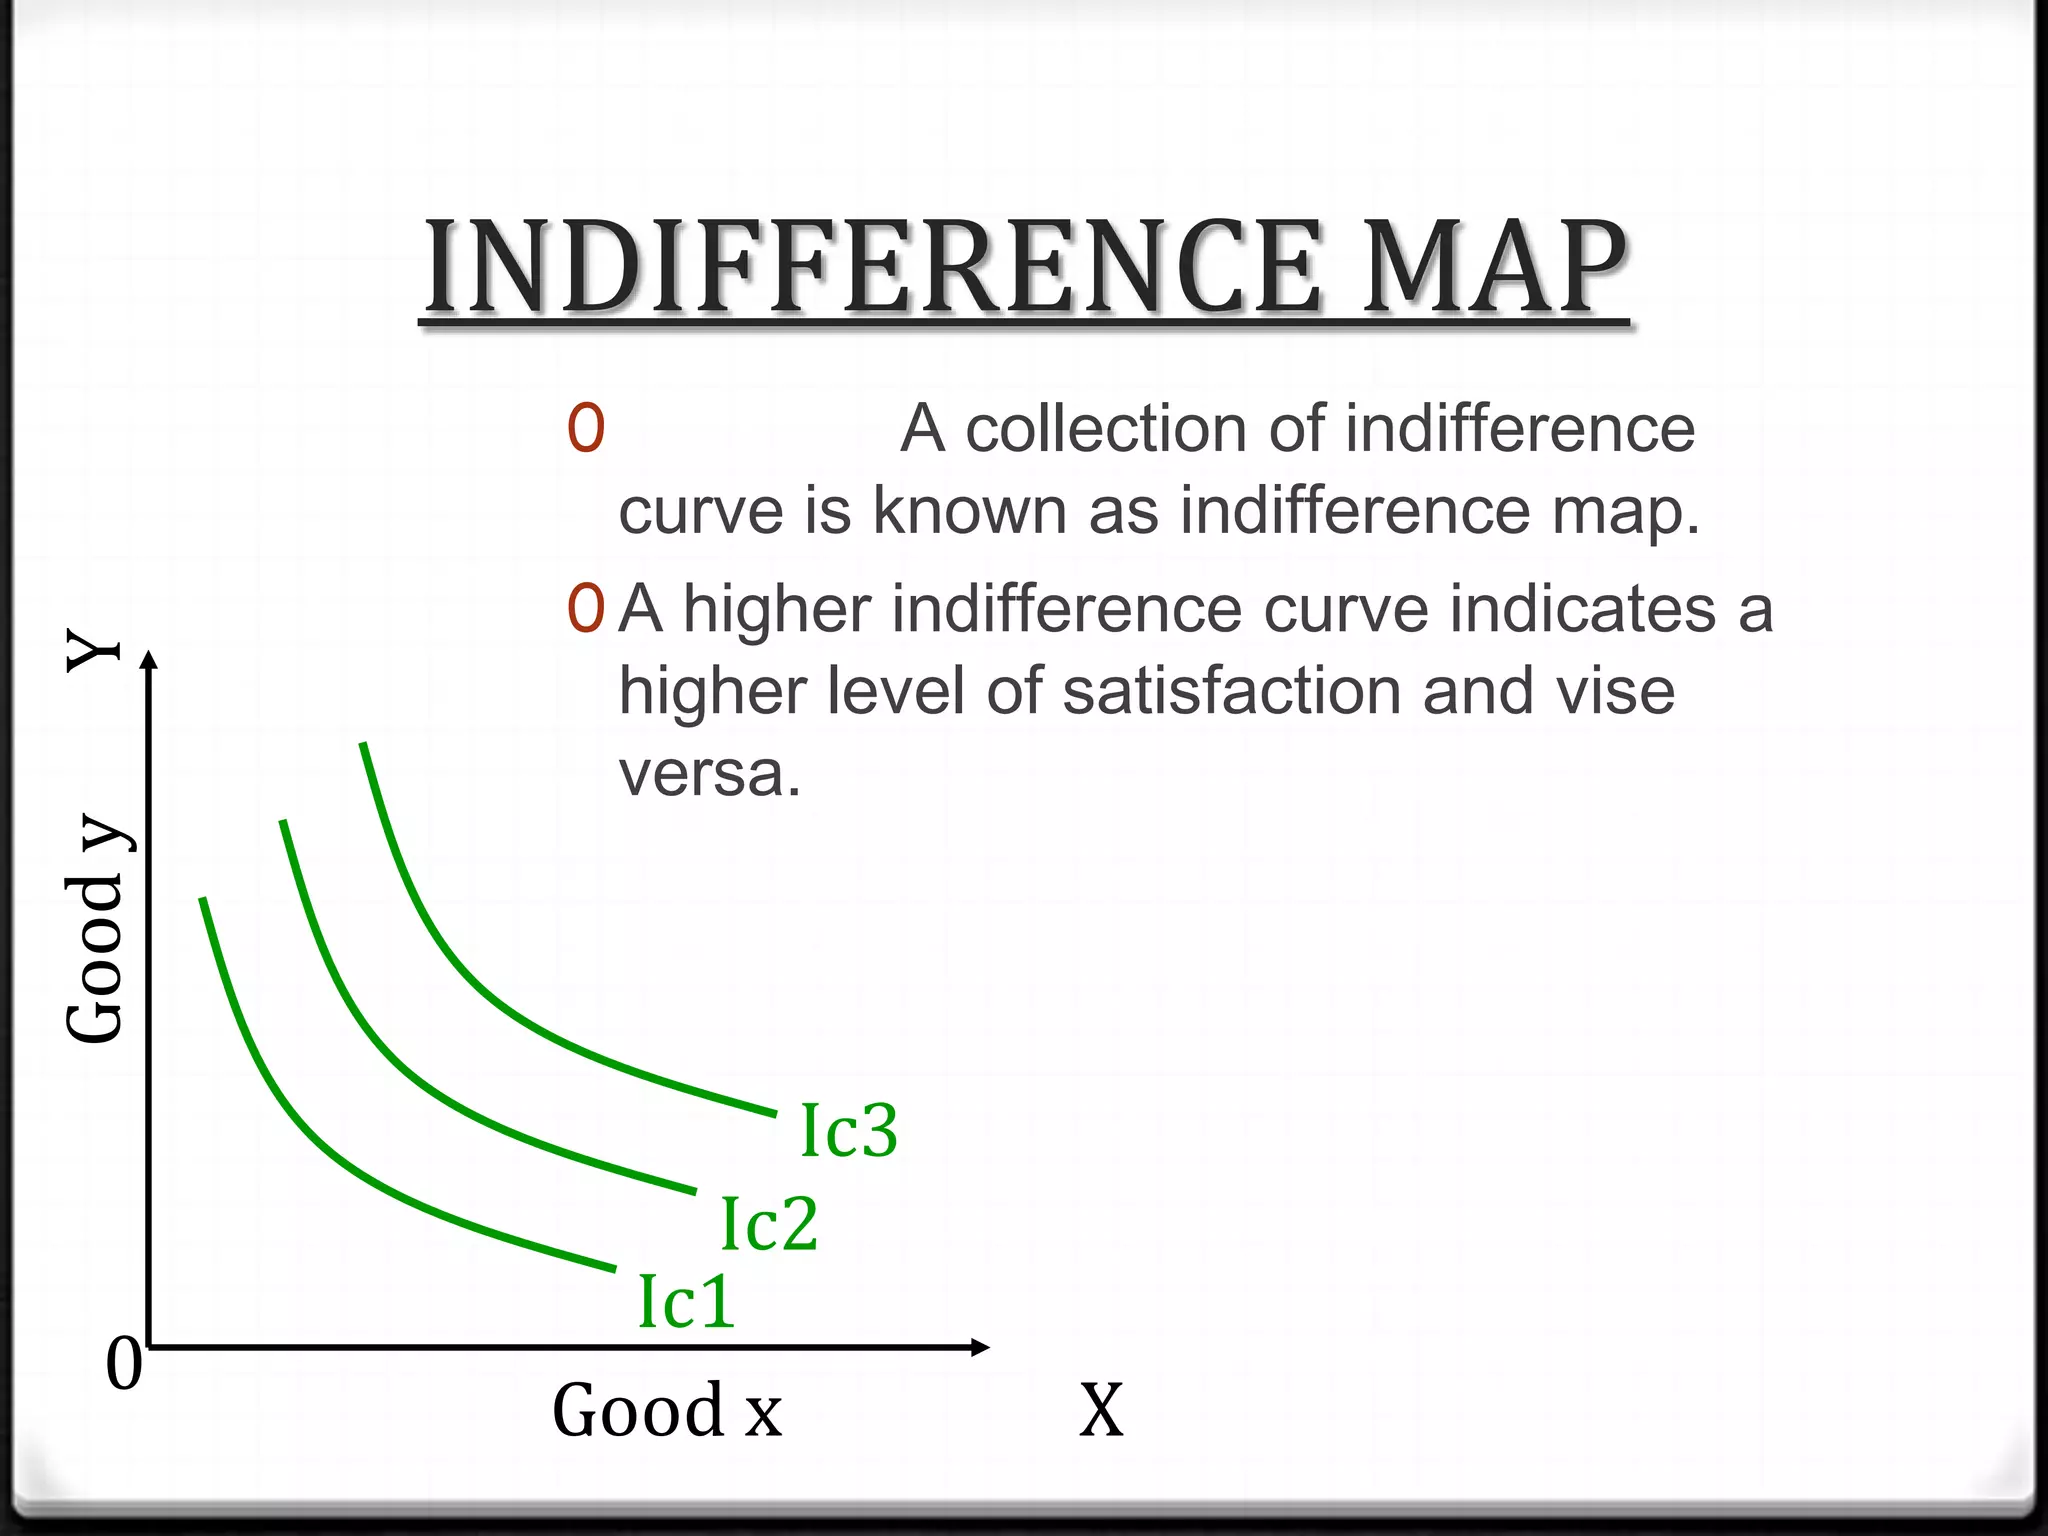
Indifference curve analysis
0 Developed - Edge worth
0 It was later preferred by J.R Hicks & R.J.D. Allen
0 indifference curve approach is also known as ordinal

utility approach..
0 consumer express their utility in terms of preference
not in term of quantity.
ASSUMPTION OF
INDIFFERENCE CURVE
0 A consumer is assumed to buy any two goods in combinations.

0 A consumer can rank the alternative combinations and compare

their level of satisfaction, and he prefers a combination providing
a higher level of satisfaction.

0 Consumer is rational and his choices are transitive.
0 The consumer behavior is assumed to be constant, throughout

the analysis.
INDIFFERENCE CURVE
Good Y

0

An indifference curve may be defined as the
locus of various combination of two goods which
yield the same total satisfaction to the consumer

Good X
INDIFFERENT SCHEDULE
For eg:
0 The following table shows the indifference schedule of
combination of biscuits and cups of tea for a
consumer.
combination
A
B
C
D
E
F

Cups of Tea
1
2
3
4
5
6

+
+
+
+
+
+
+

Biscuits
50
38
26
21
17
15
Graphical representation of indifference schedule…

Y

60

A

BISCUITS

50
40

B

30

C
D

20

E

F

10

00

0

2

4
CUPS OF TEA

6

8

X
INDIFFERENCE MAP
A collection of indifference
curve is known as indifference map.
0 A higher indifference curve indicates a
higher level of satisfaction and vise
versa.

Good y

Y

0

0

Ic3
Ic2
Ic1
Good x

X
Thanks….

Indifference curve Managerial Economics

  • 2.
    Indifference curve analysis 0Developed - Edge worth 0 It was later preferred by J.R Hicks & R.J.D. Allen 0 indifference curve approach is also known as ordinal utility approach.. 0 consumer express their utility in terms of preference not in term of quantity.
  • 3.
    ASSUMPTION OF INDIFFERENCE CURVE 0A consumer is assumed to buy any two goods in combinations. 0 A consumer can rank the alternative combinations and compare their level of satisfaction, and he prefers a combination providing a higher level of satisfaction. 0 Consumer is rational and his choices are transitive. 0 The consumer behavior is assumed to be constant, throughout the analysis.
  • 4.
    INDIFFERENCE CURVE Good Y 0 Anindifference curve may be defined as the locus of various combination of two goods which yield the same total satisfaction to the consumer Good X
  • 5.
    INDIFFERENT SCHEDULE For eg: 0The following table shows the indifference schedule of combination of biscuits and cups of tea for a consumer. combination A B C D E F Cups of Tea 1 2 3 4 5 6 + + + + + + + Biscuits 50 38 26 21 17 15
  • 6.
    Graphical representation ofindifference schedule… Y 60 A BISCUITS 50 40 B 30 C D 20 E F 10 00 0 2 4 CUPS OF TEA 6 8 X
  • 7.
    INDIFFERENCE MAP A collectionof indifference curve is known as indifference map. 0 A higher indifference curve indicates a higher level of satisfaction and vise versa. Good y Y 0 0 Ic3 Ic2 Ic1 Good x X
  • 8.

Editor's Notes

  • #3 Because it is based on the ordinal measurementie;ranking of utility ..
  • #5 Each point of the curve represent each combination of two goods. All these combination yields the same level of total satisfaction. The consumer is indifferent so as to the different combination on the same curve.
  • #6 Indifference curve can be better understood with the help of an indifferent schedule. Indifferent schedule means its a table. The schedule shows that the consumer can select any combination. If we represent these schedule in a graph we can obtain indifference curve that is indifference curve is the graphical representation of indifference schedule. In the indifference curve consumer can substittute one commodity for another to maximize his satisfaction.
  • #8 We cannot say how much utility the higher indifference curve represents , meaning Aggregate Utilities are rankable not measurable.