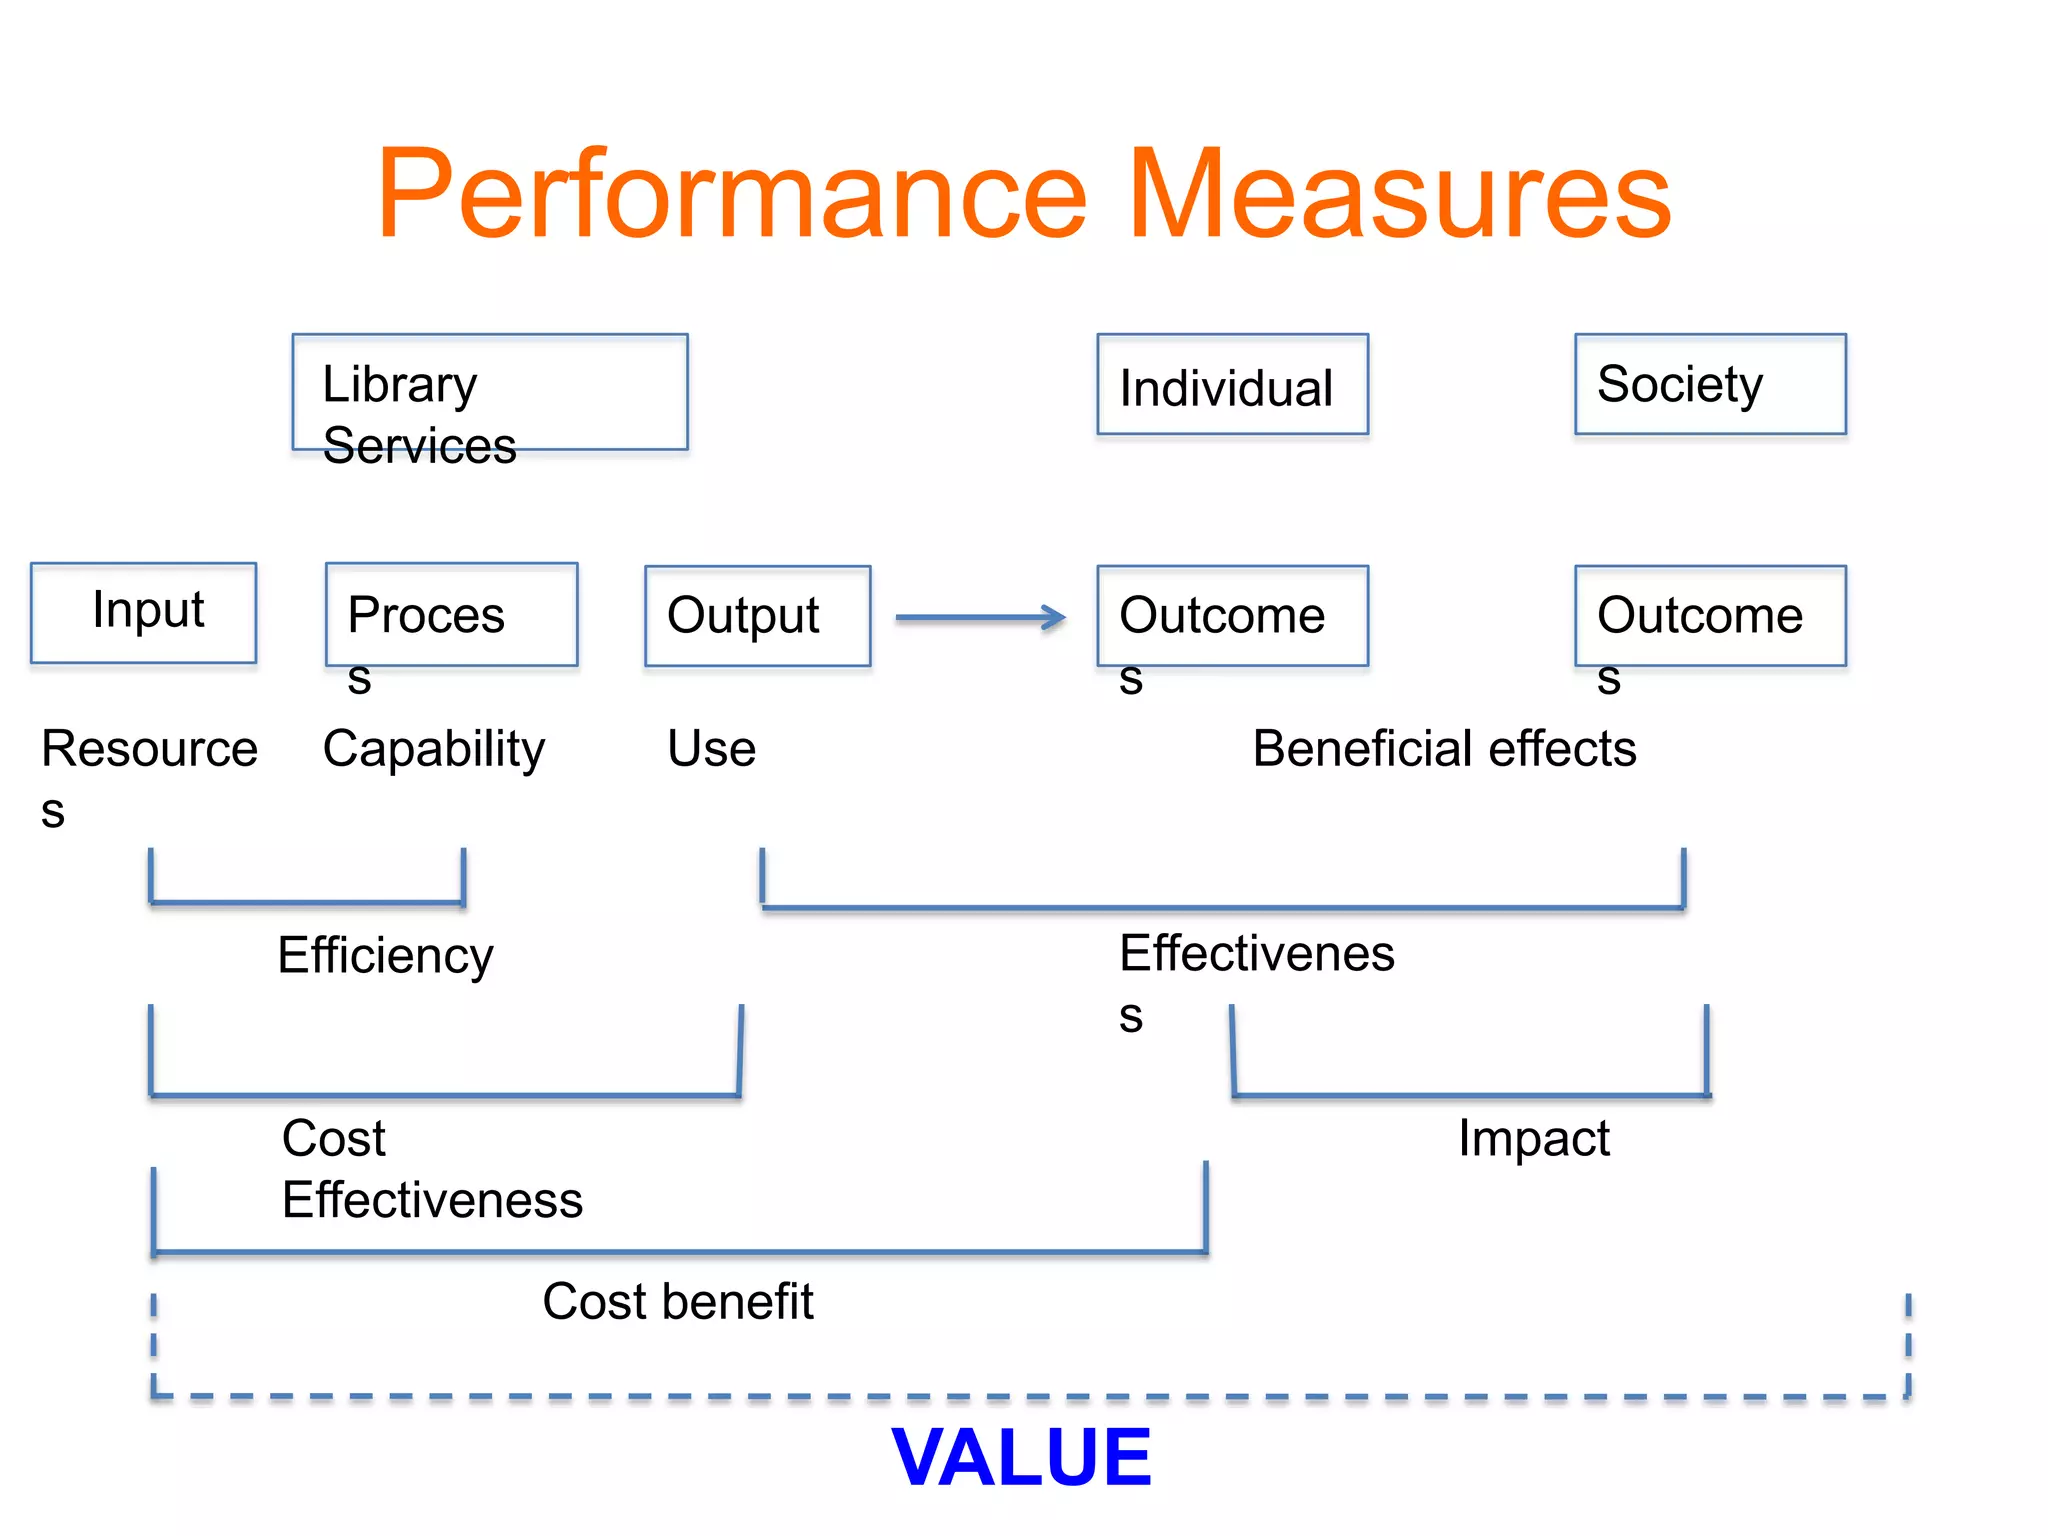
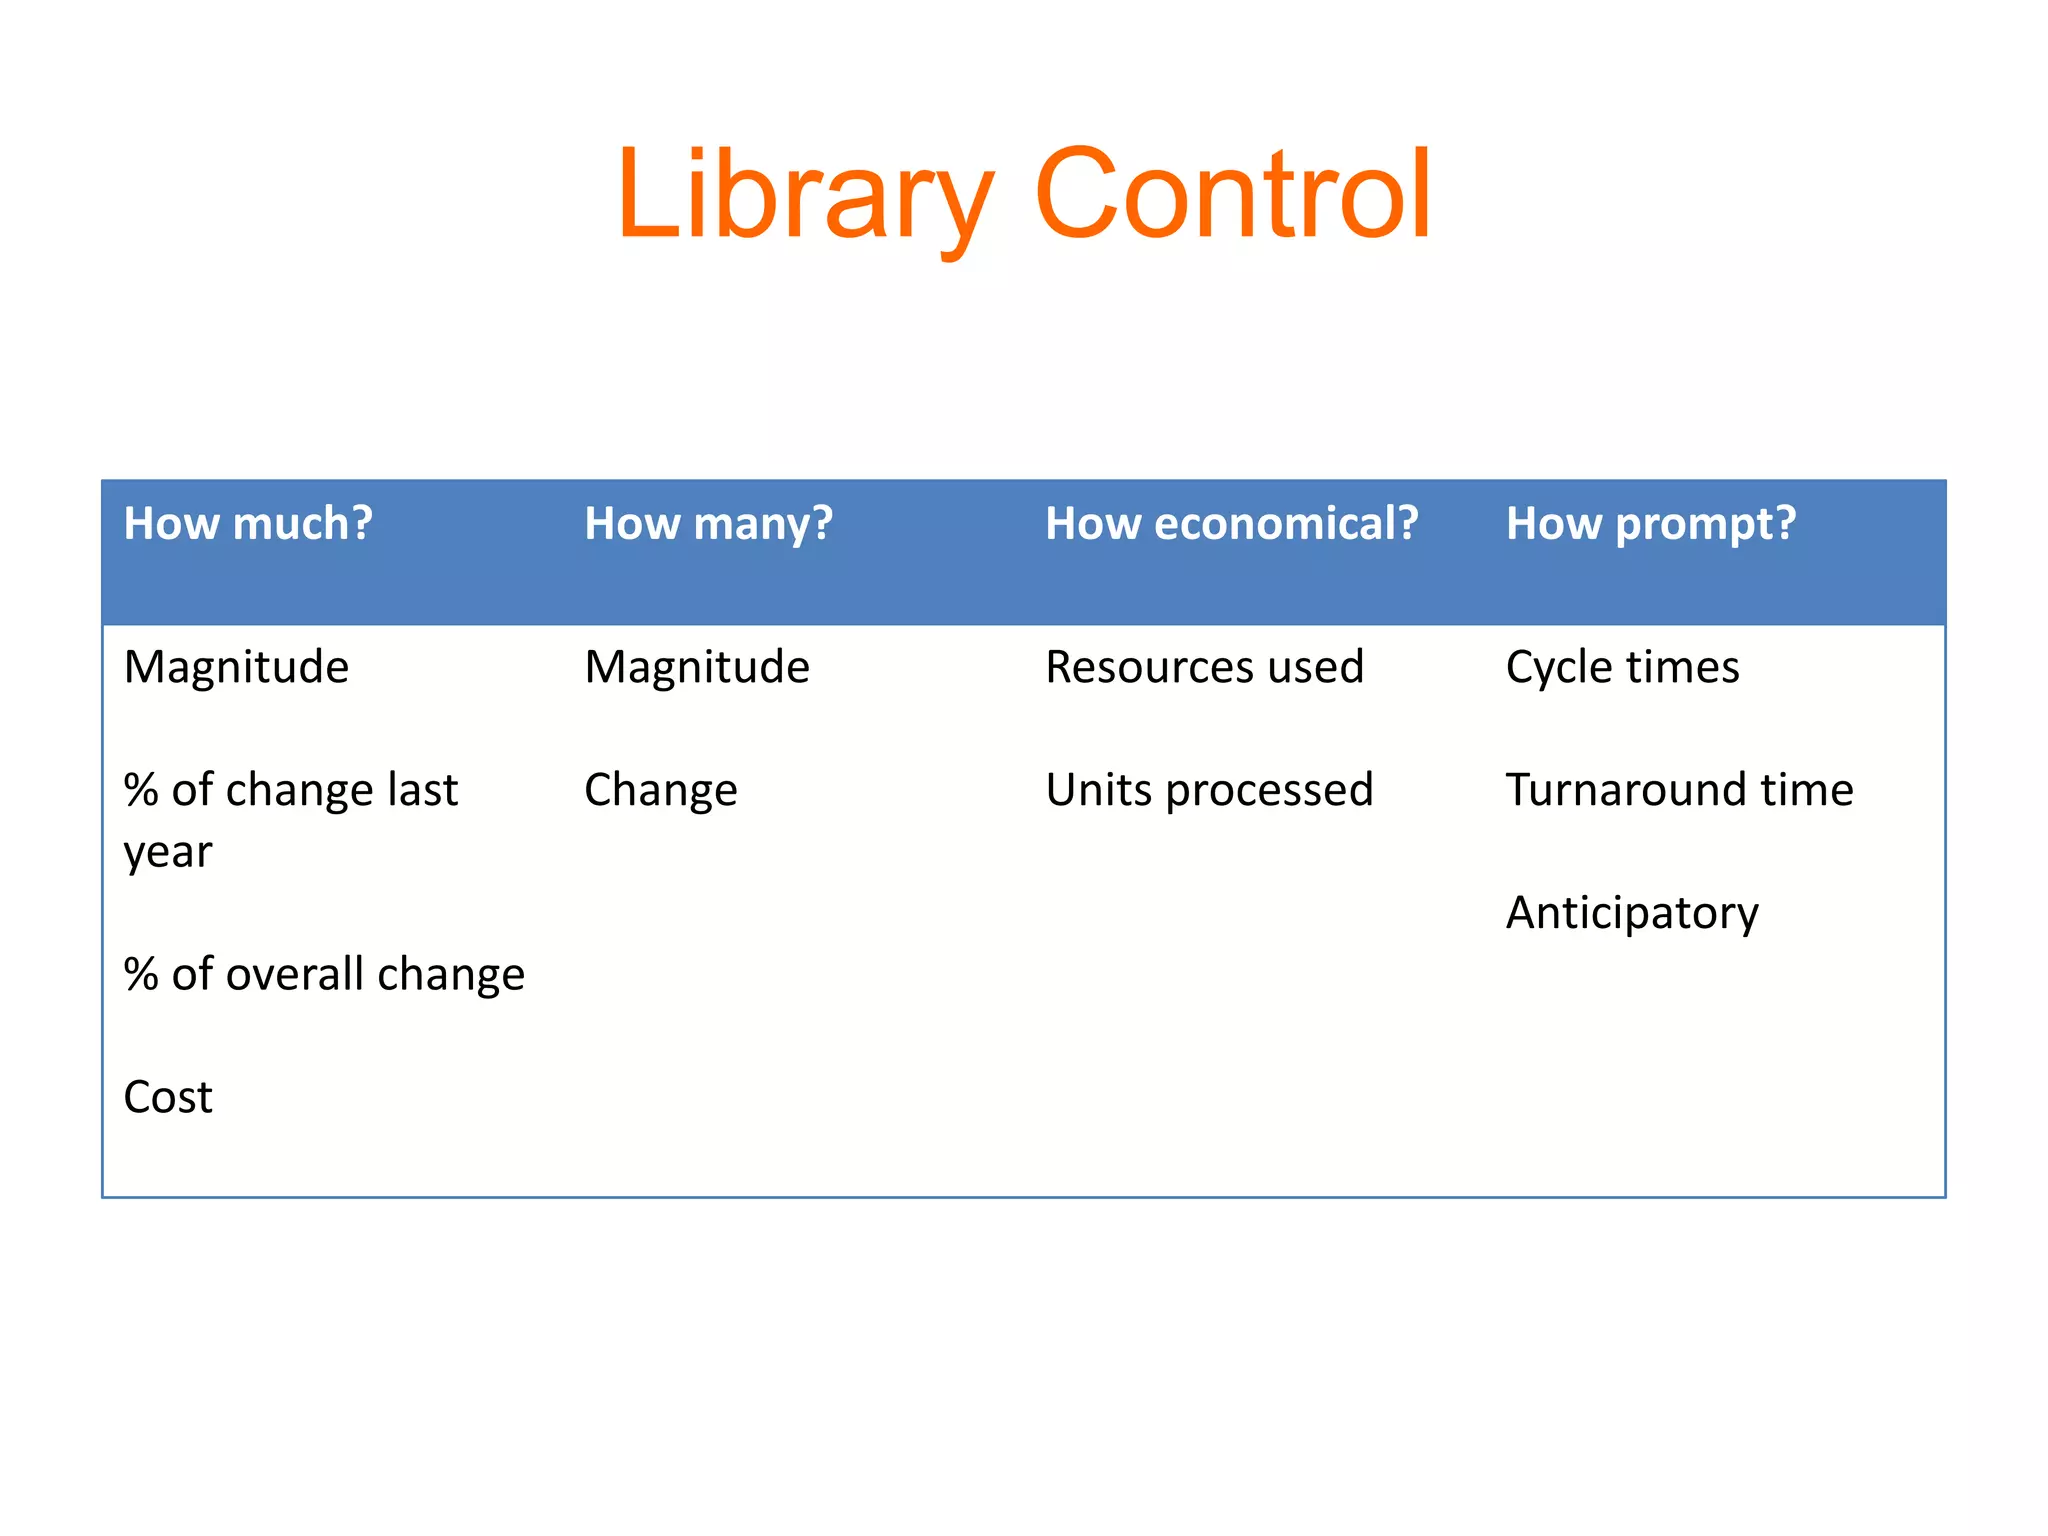
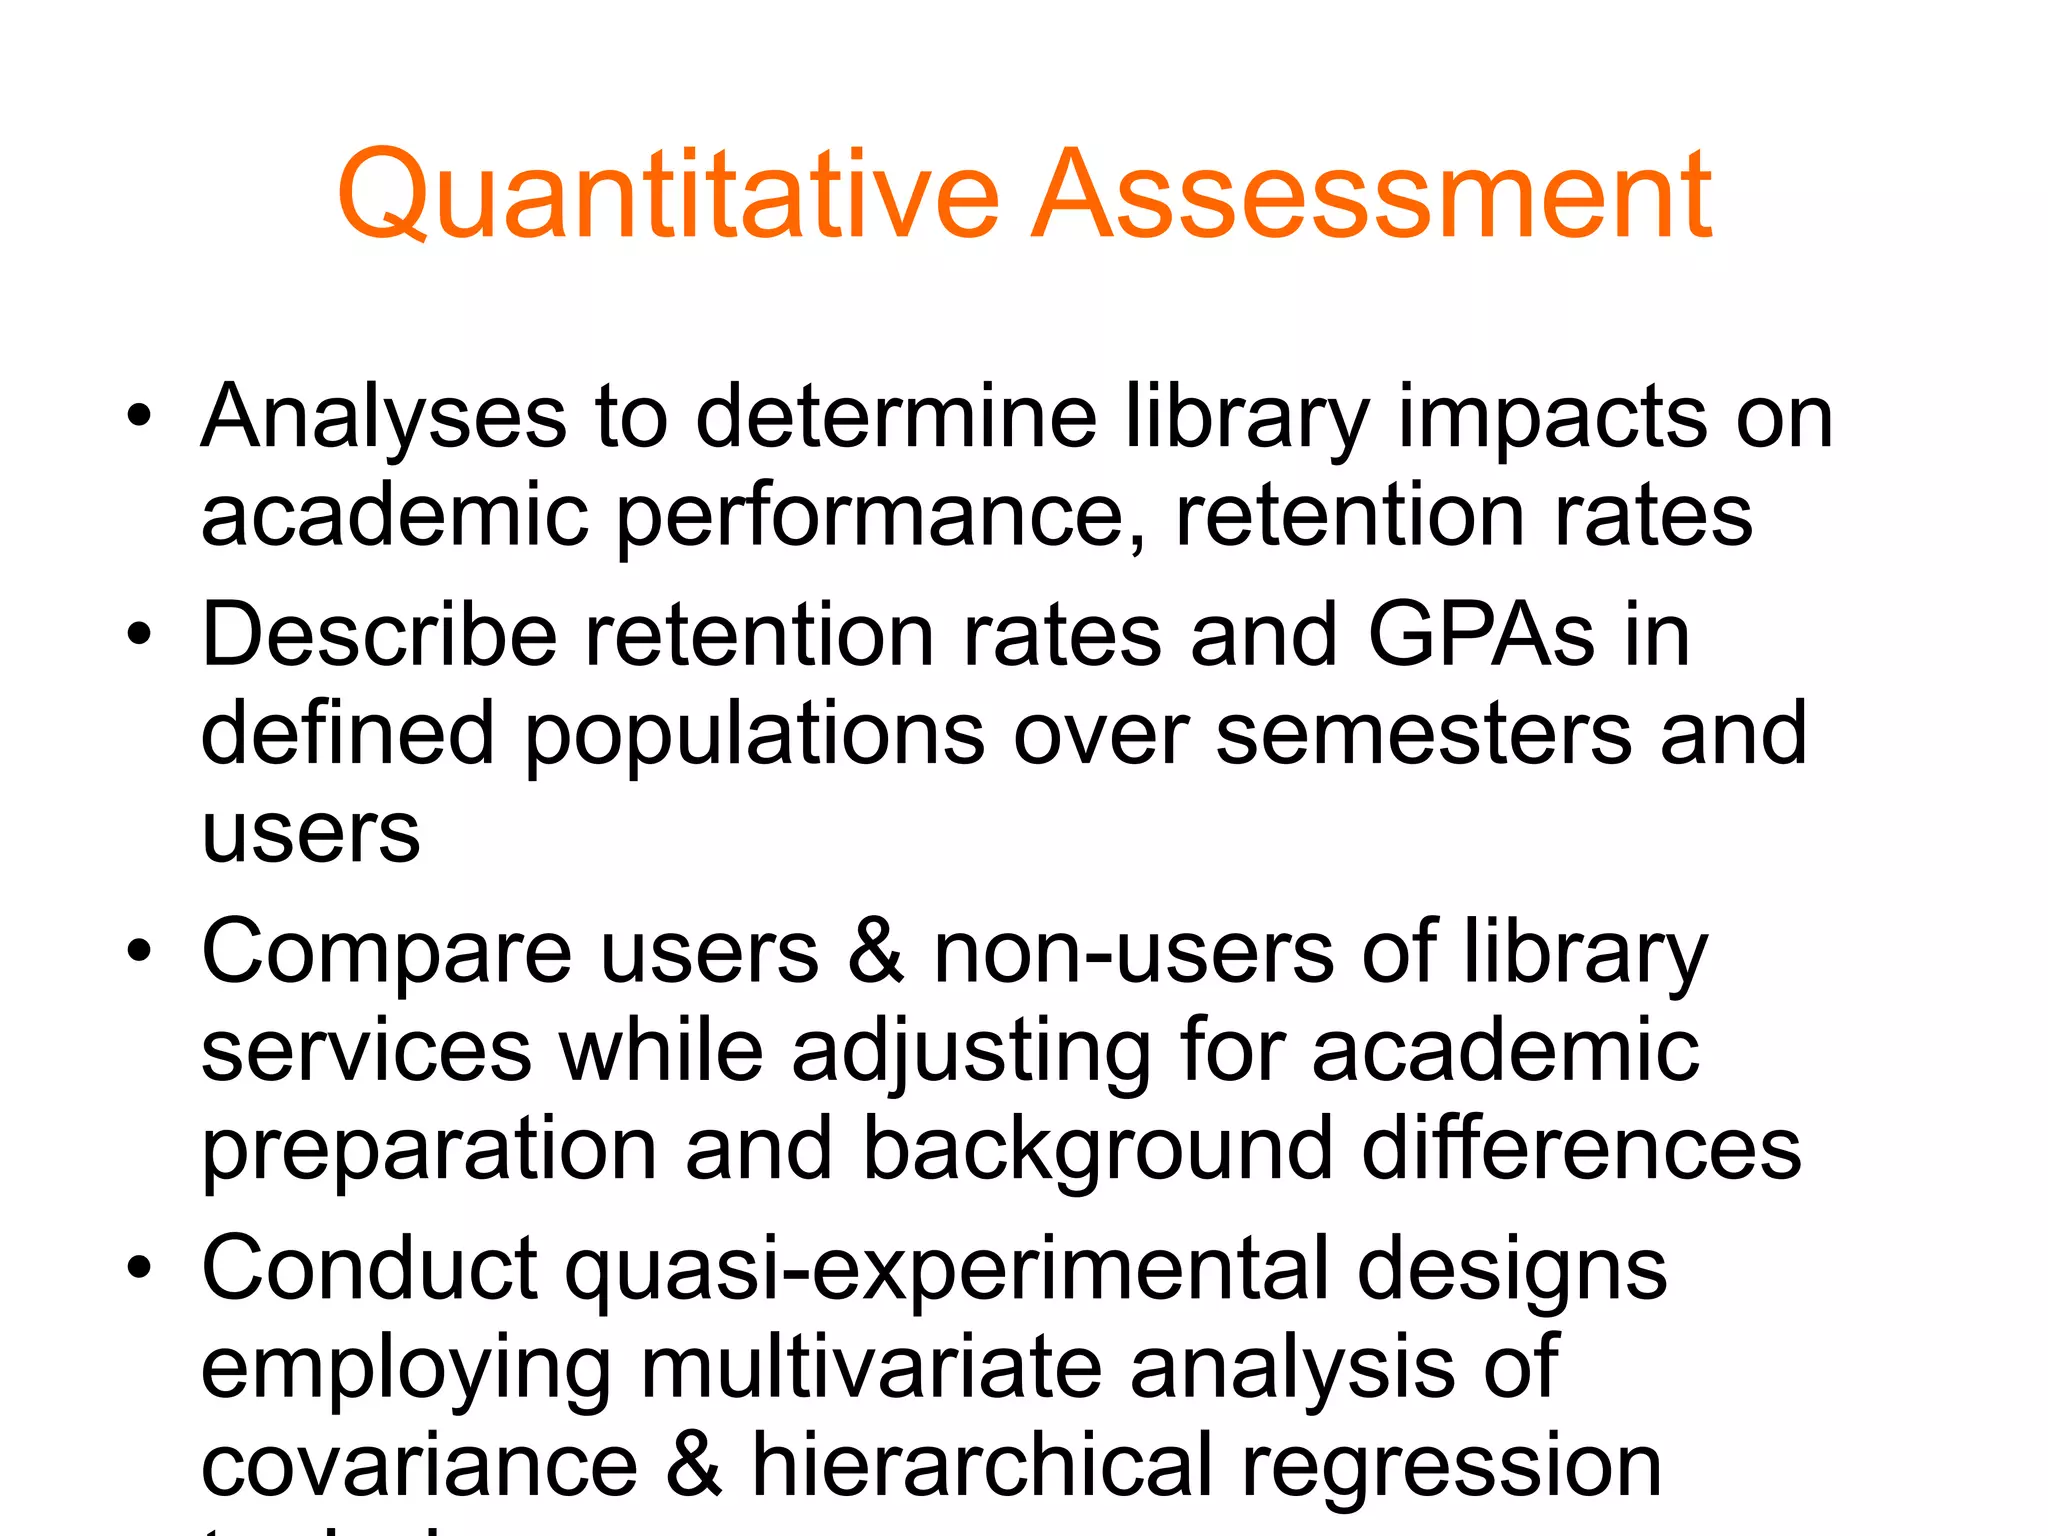
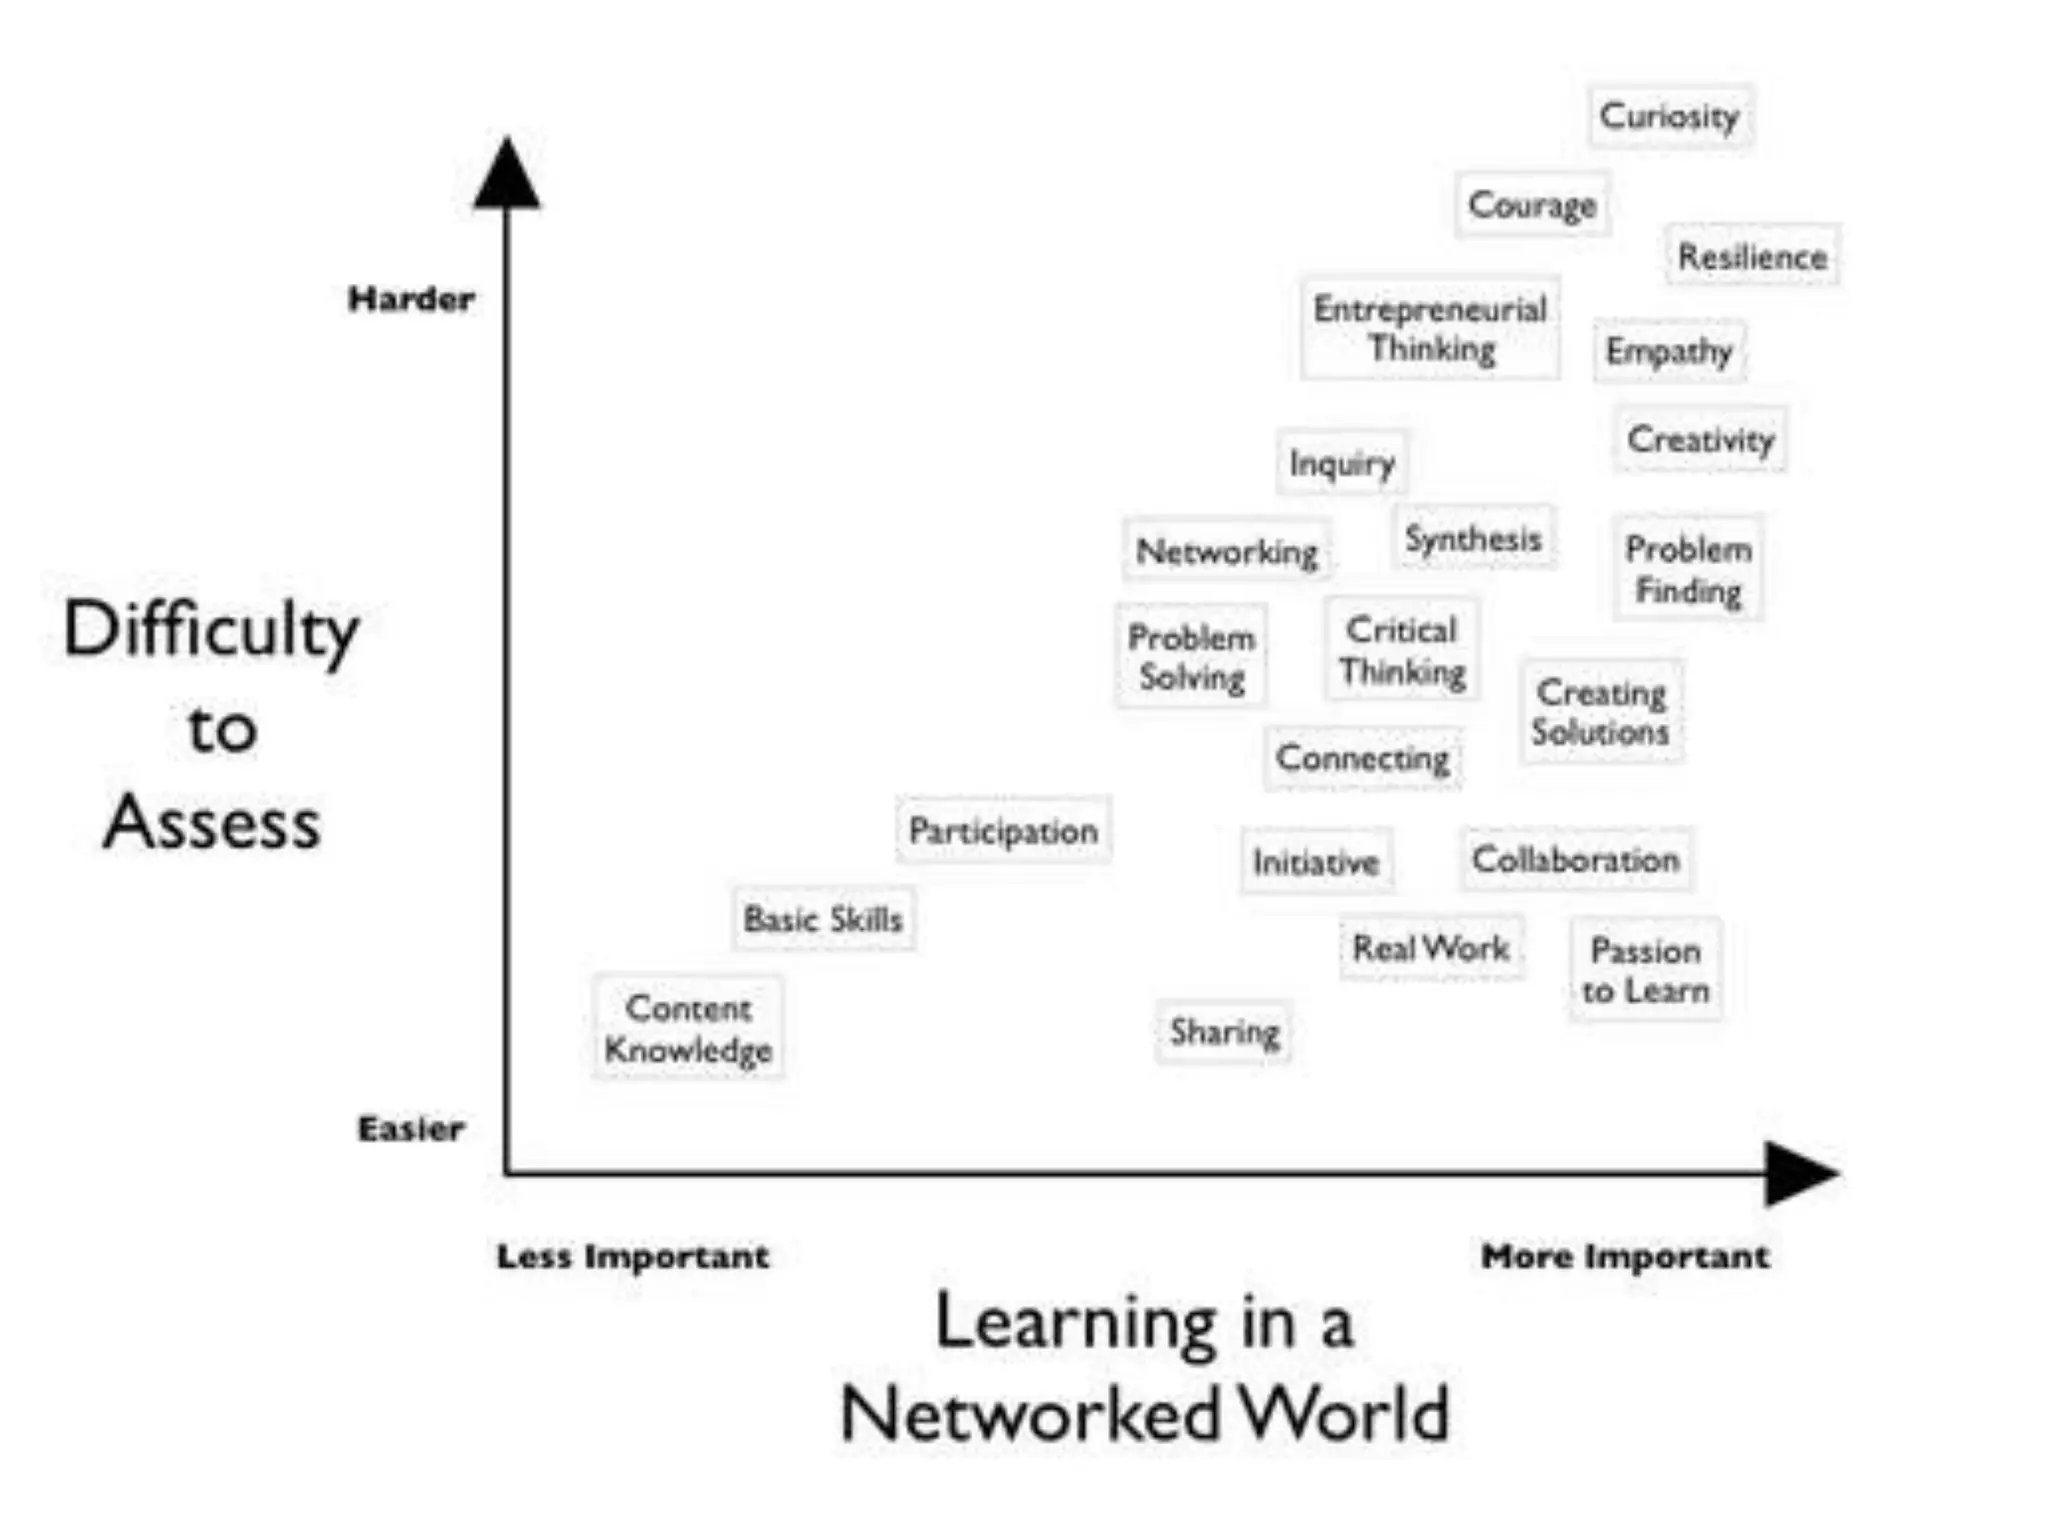
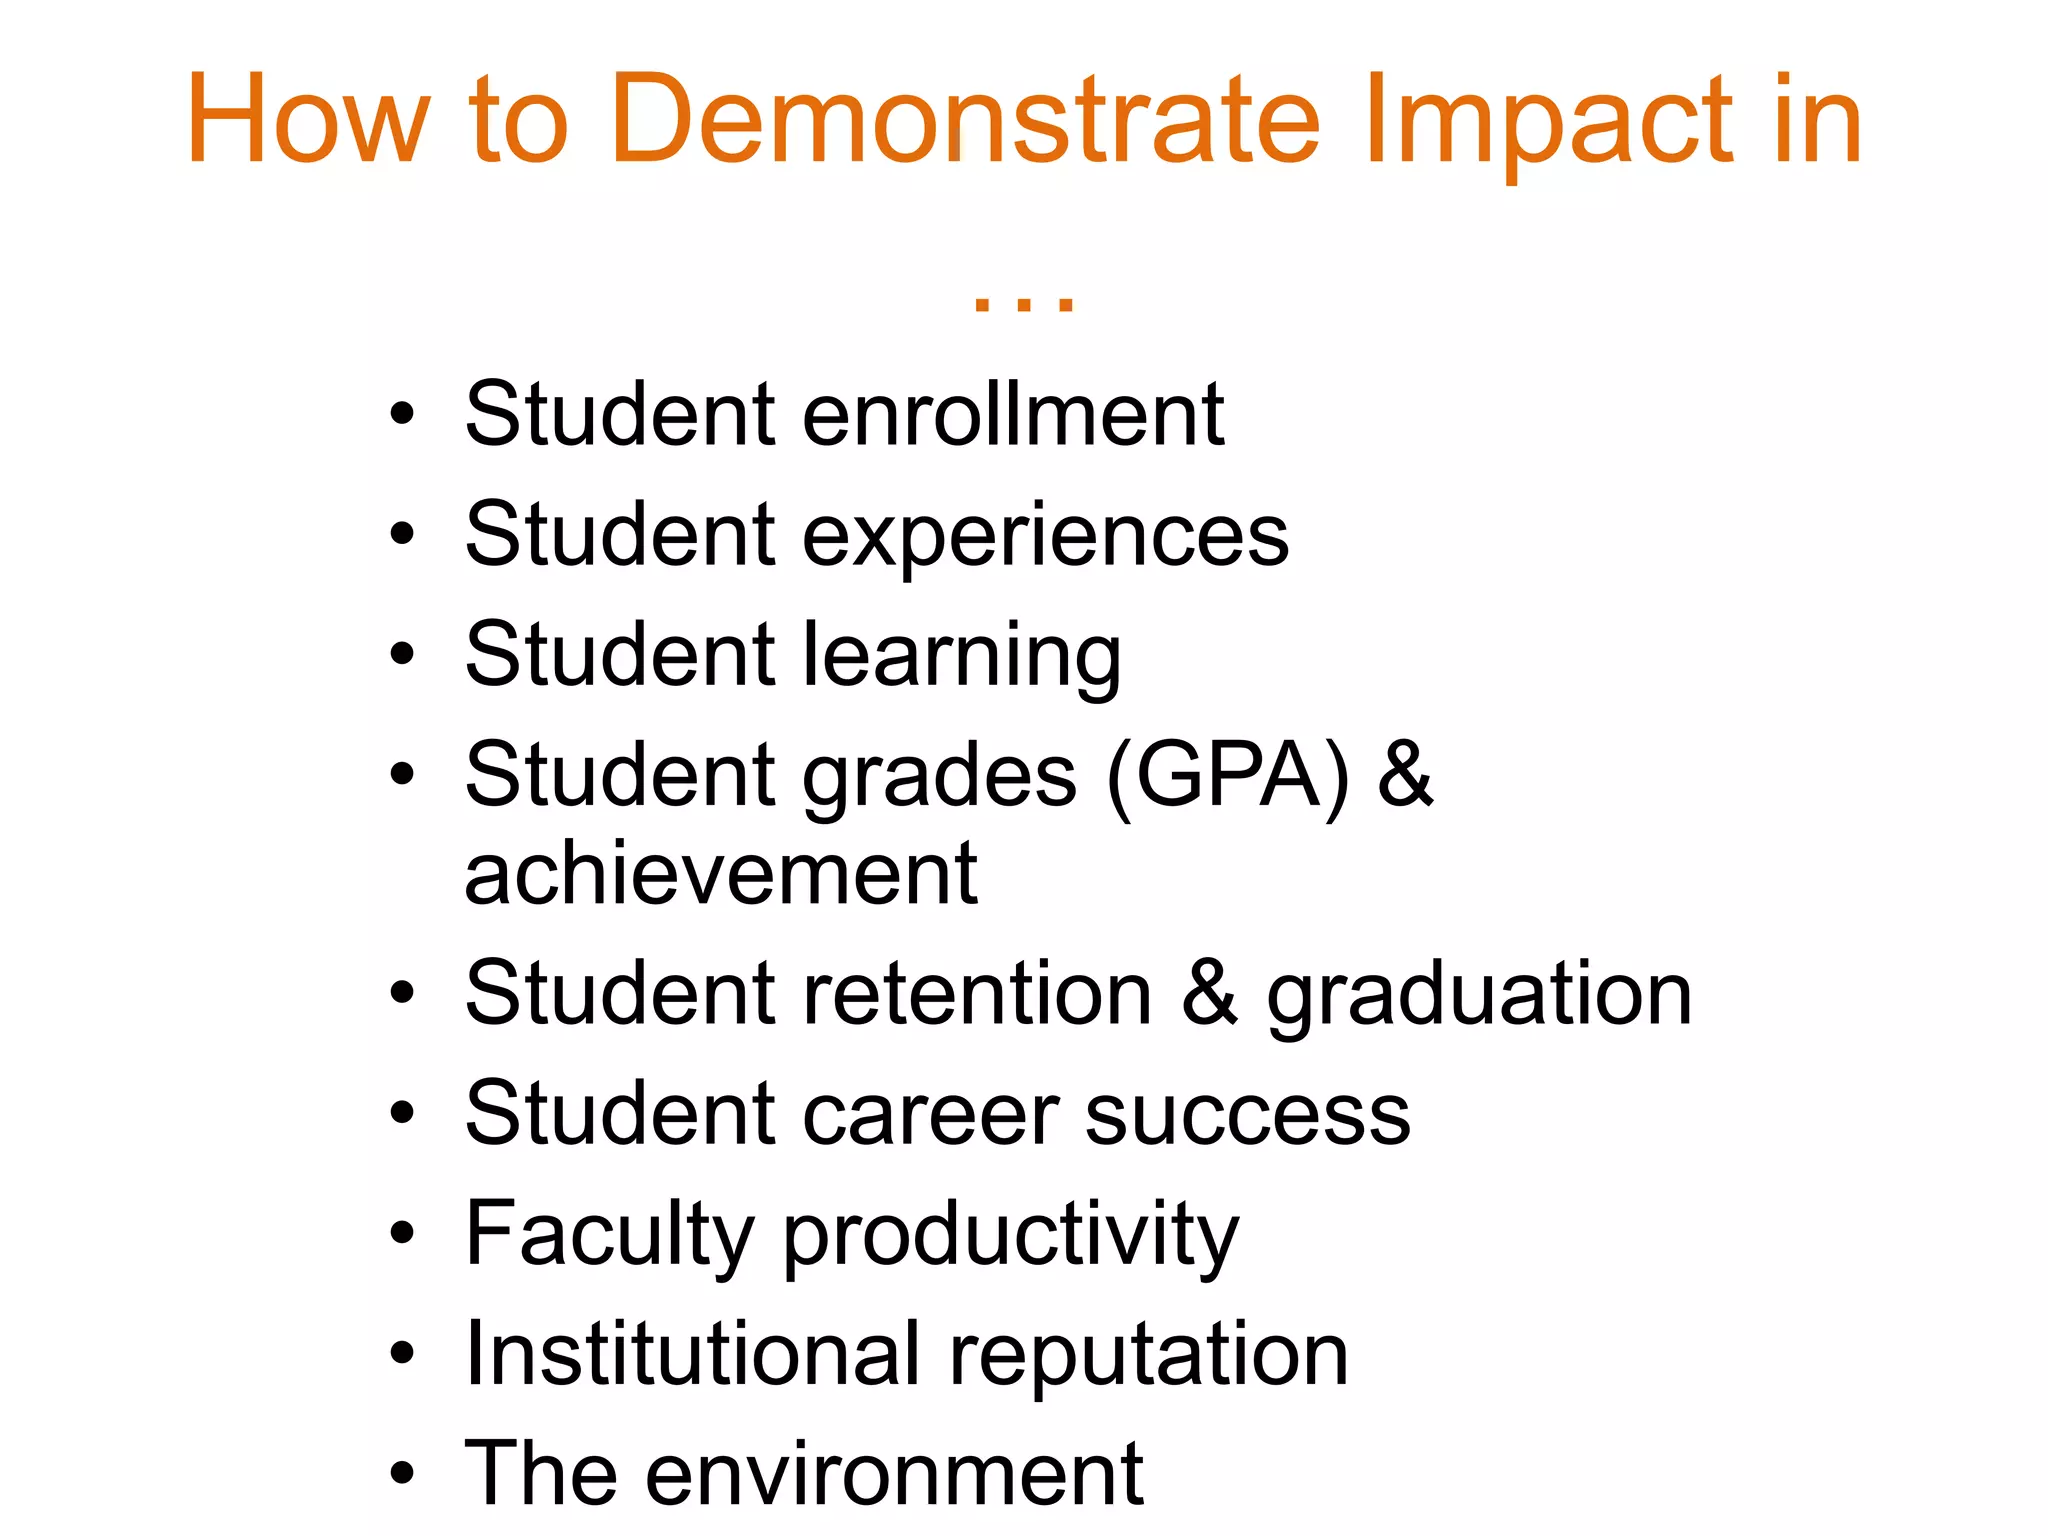
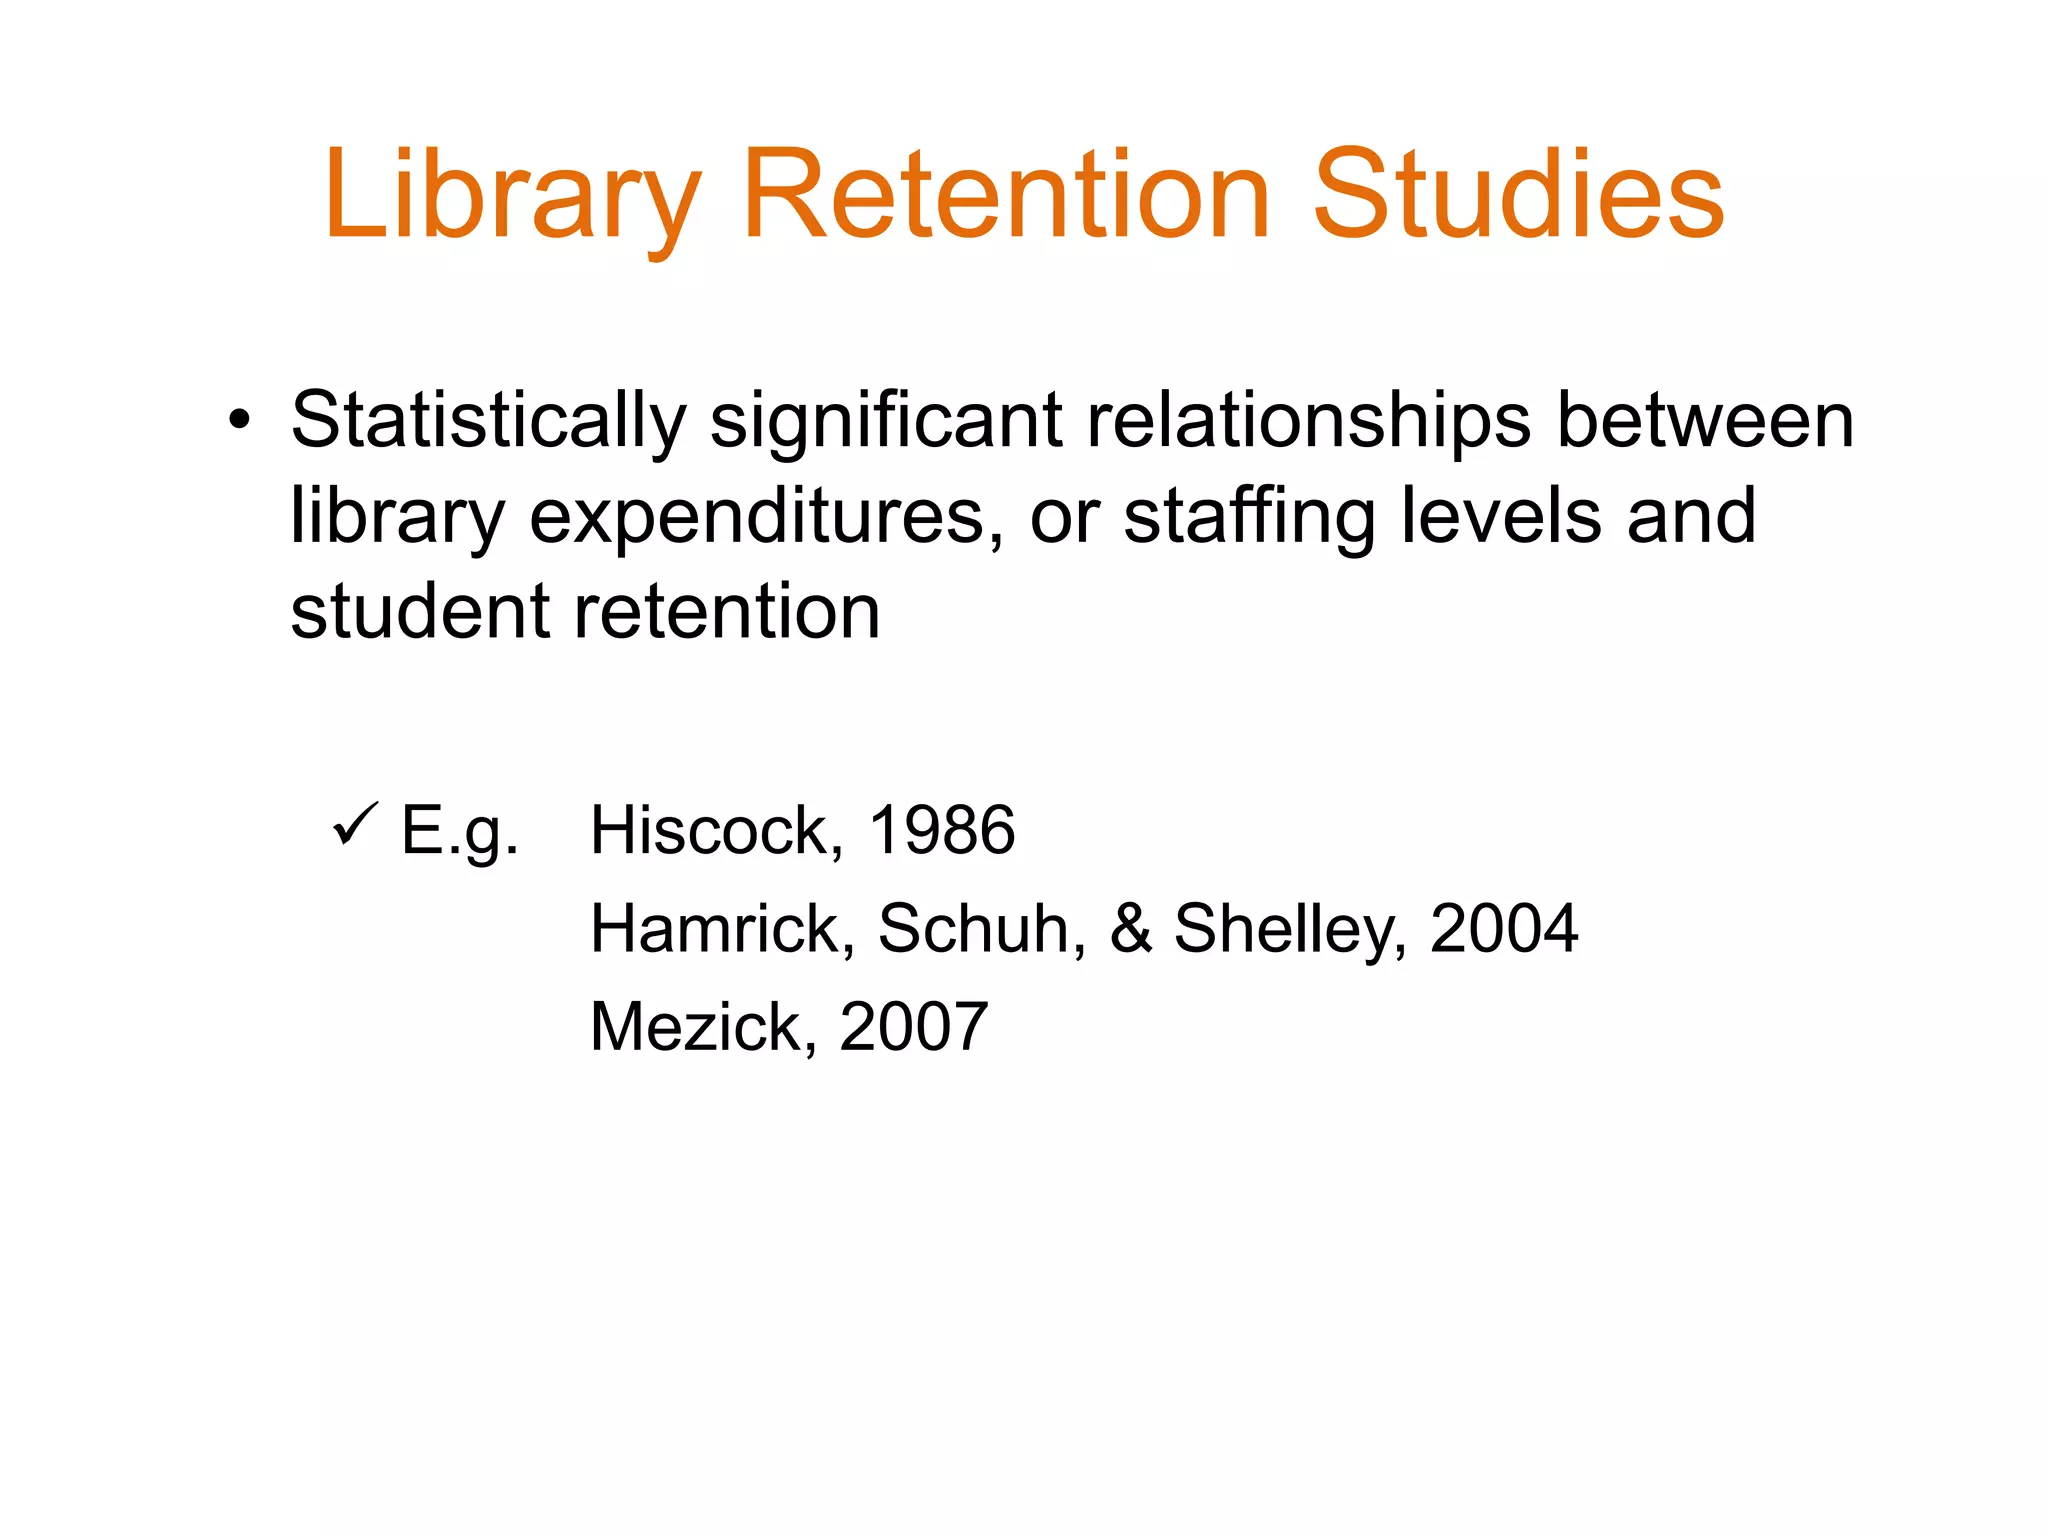
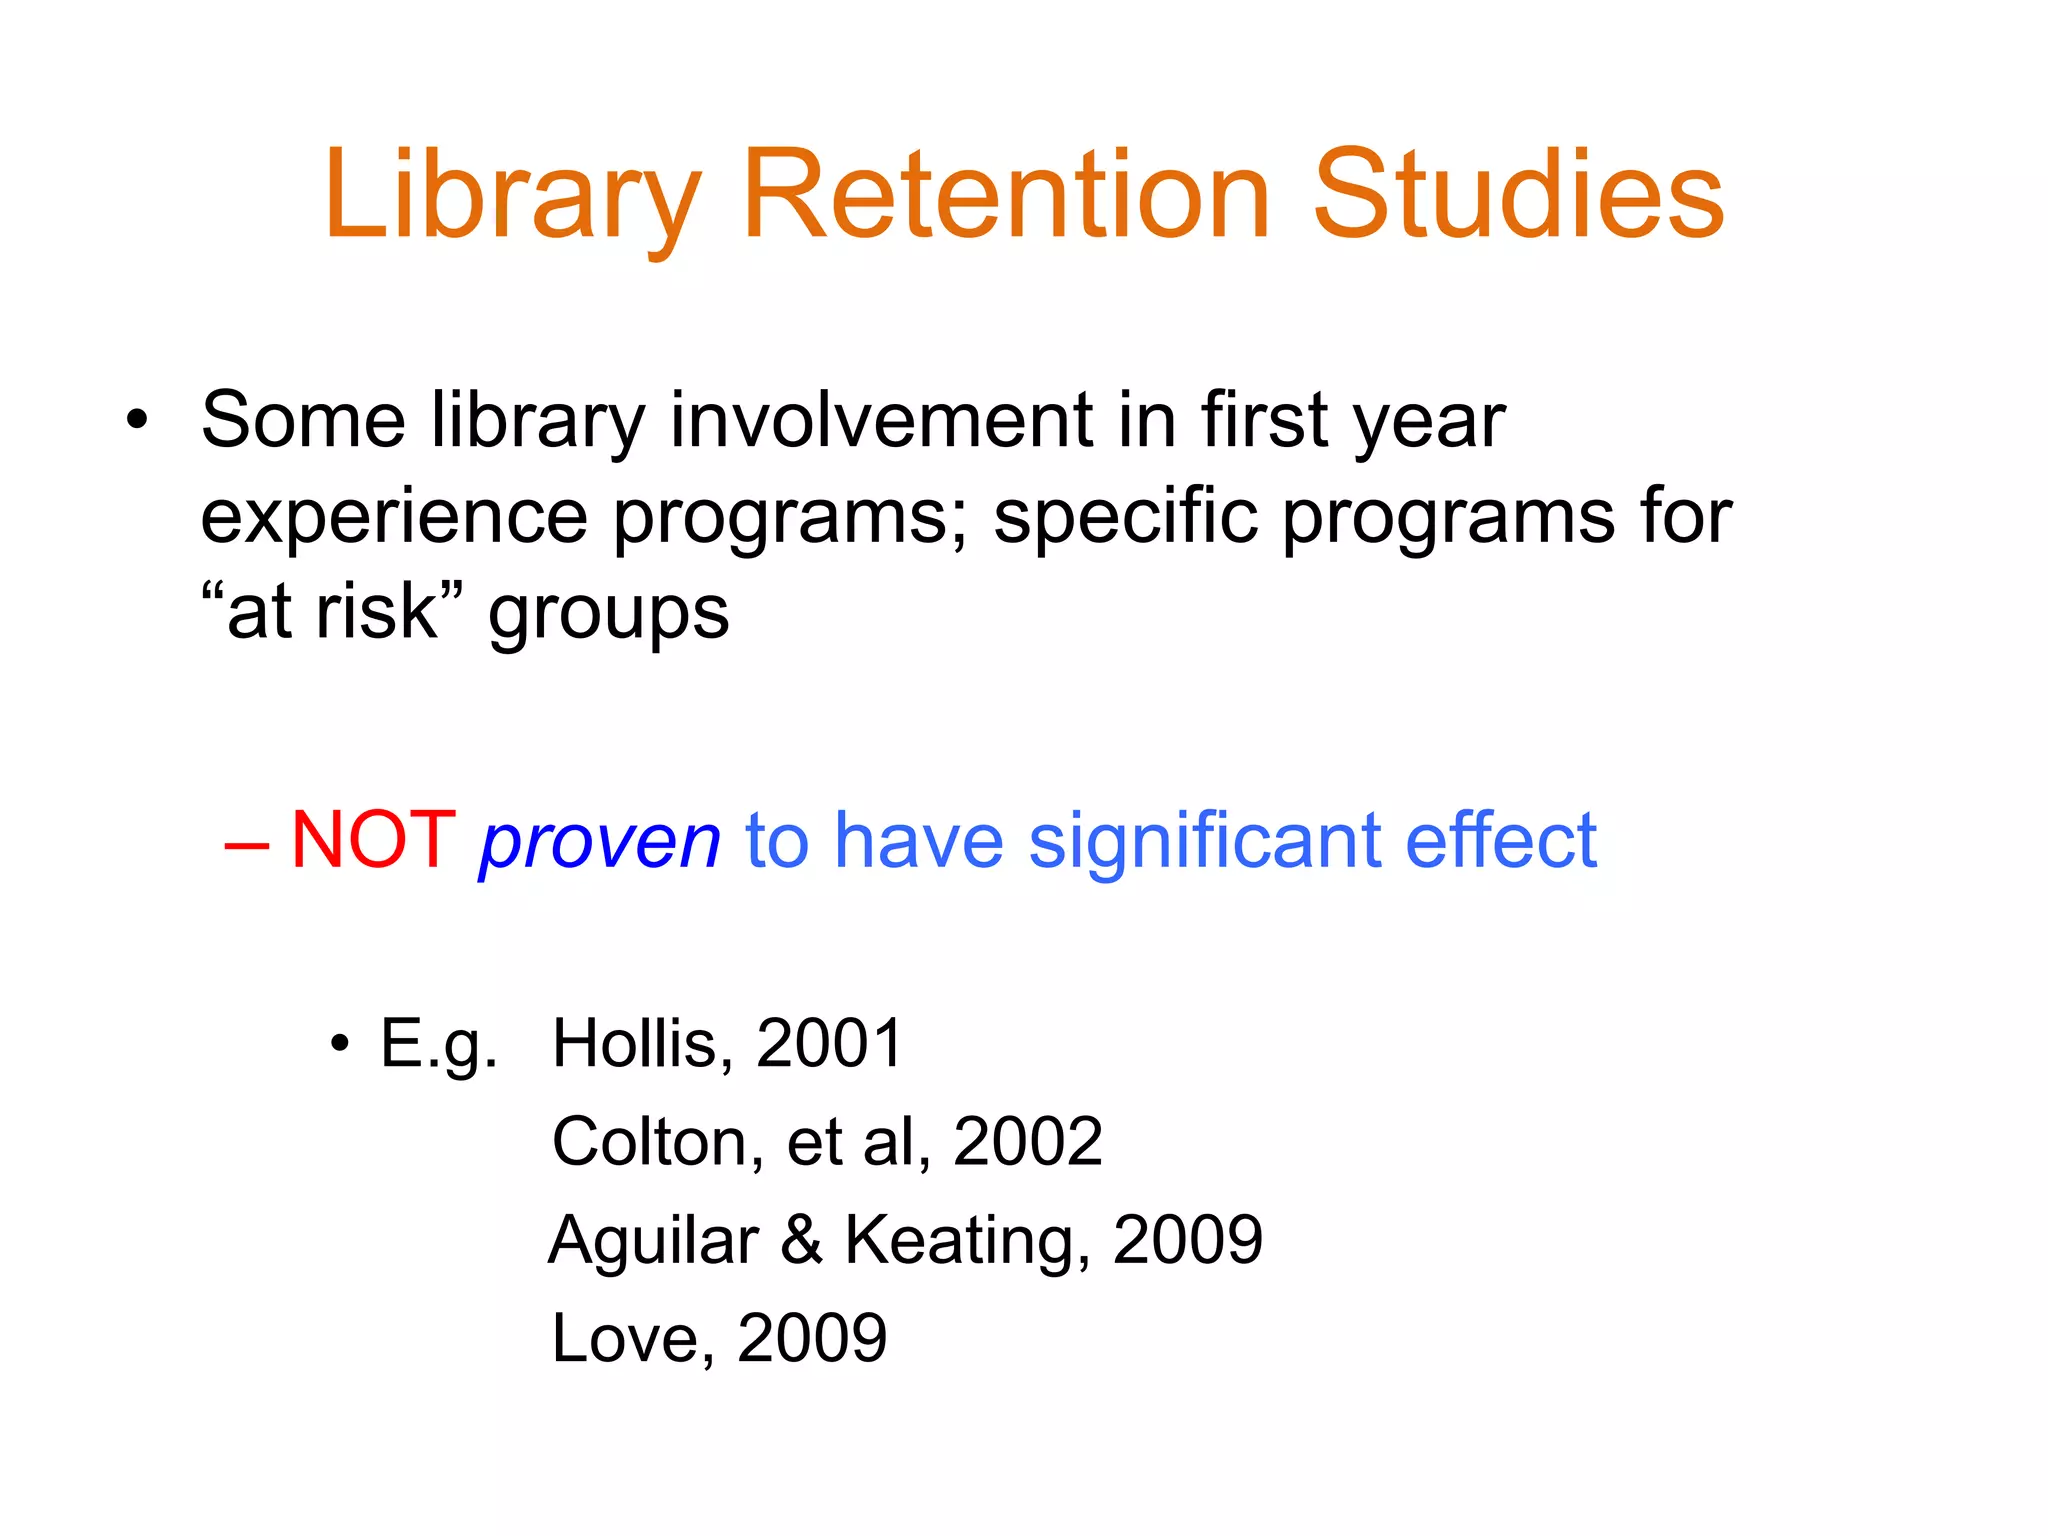
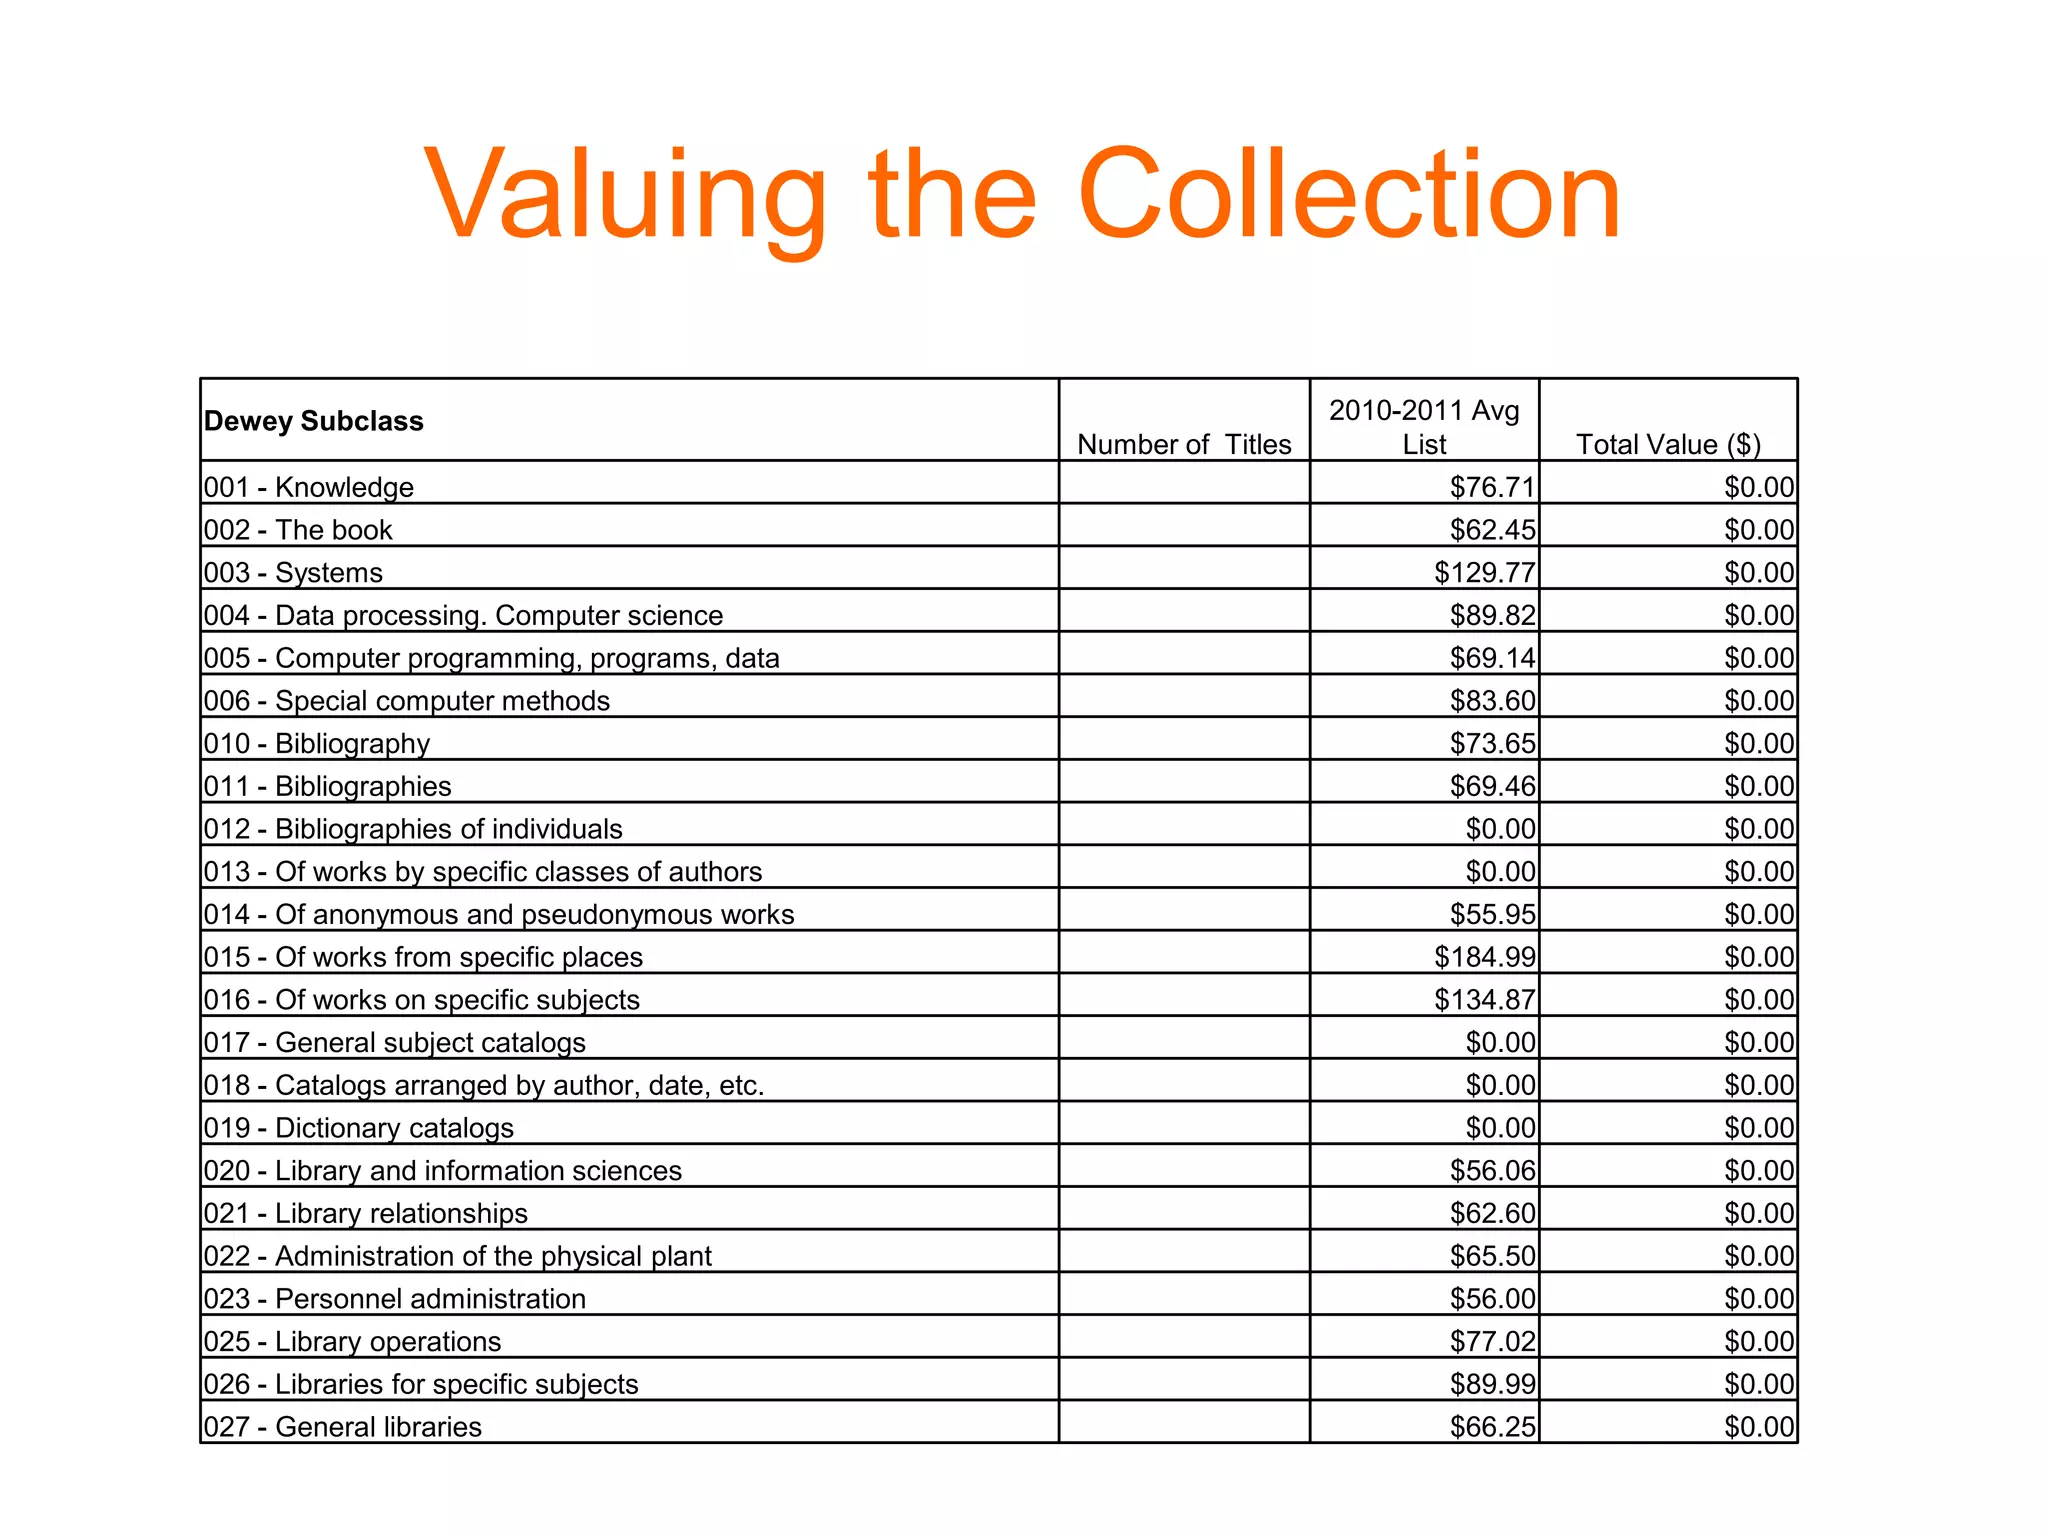
The Value & Economic
Measures of Libraries
10th Northumbria International
Library Conference
Joe Matthews
July 25, 2013
Morning Session
Megan Oakleaf
Outline
• Performance Measures
• Value
• Value of Information
Services
Outline
Personal value
• Direct measures
• Indirect measures
Organizational value
• Academic libraries
• Public libraries
• National libraries
)
Few libraries exist in a vacuum,
accountable only to themselves. There is
thus always a larger context for
accessing library quality, that is, what and
how well does the library contribute to
achieving the overall goals of the parent
constituencies?
Sarah Pritchard
There is no systematic evidence
collected which shows the value
of academic libraries
for teaching and research staff.
Claire Creaser and Valerie Spezi
Performance Measures
Input Proces
s
Output Outcome
s
Outcome
s
Library
Services
Individual Society
Efficiency Effectivenes
s
Cost
Effectiveness
Impact
VALUE
Cost benefit
Resource
s
Capability Use Beneficial effects
Start with the end in mind:
work backwards
Refocus from the activity
to the impact
Impact
Library Control
How much? How many? How economical? How prompt?
Magnitude
% of change last
year
% of overall change
Cost
Magnitude
Change
Resources used
Units processed
Cycle times
Turnaround time
Anticipatory
Library & Customers Decide
How valuable? How reliable? How accurate?
Effort expended
Cost
Benefits obtained
Dependability
Access
Accuracy
Completeness
Comprehensiveness
Currency
Customers Decide
How well? How courteous? How responsive? How satisfied?
Accuracy
Promptness
Courtesy
Expertise
Attentive
Welcoming
Anticipatory
Helpful
Empathetic
Expectations met
Materials obtained
Personal interaction
Ease of use
Environment
Comfort
Willingness to
return
Live by the numbers, ….
Challenges
Lack of consensus about what should be
measured and how
Lack of understanding of performance
measurement and metrics
Organizational structural issues
Lack of precision in measuring performance,
and
alignment issues
Determining the “bottom line” is too far away
Majority of stakeholders are too far away
Library staff find it difficult to see the “big”
And the survey said ….
Lack of a Connection
• Budget and outputs (and outcomes) are
separated
• No “bottom line” measure for libraries
• Decision-making process is bigger than
the library
• Library has neither champions nor foes
• Library benefits are not widely self-evident
Orr’s Fundamental Questions
• How good is the library?
• What good does the library do?
• How well is the library managed?
We should be a bit wary of the “little library”
…For when it is good, it is very, very good
and when it is bad,
it’s a “pretty good library for a town this size.”
Eleanor Jo Rodger
Levels of Assessment …
• Individual student
• Course
• Departmental/Program
• College or University
Types of Measures
• Direct
– Provide tangible, visible and
self-explanatory evidence of
what students have & have not
learned
• Indirect
– Capture students’ perceptions of
their knowledge & skills;
supplement direct measures;
sometimes called surrogates
Qualitative Tools
• Focus groups – open
ended
• Biography
• Phenomenology –
capture the “Aha!”
moment
• Grounded theory
• Ethnography
• Case study
Qualitative Assessment
• Provides in-depth understanding of user
responses and interactions
• Represents part of a long-term strategy of
formative evaluative
Quantitative Tools
• Surveys
• Transaction logs
• Statistics from systems
• Observations (count)
Quantitative Assessment
• Analyses to determine library impacts on
academic performance, retention rates
• Describe retention rates and GPAs in
defined populations over semesters and
users
• Compare users & non-users of library
services while adjusting for academic
preparation and background differences
• Conduct quasi-experimental designs
employing multivariate analysis of
covariance & hierarchical regression
Useful Assessment
Be cautious about cause-and-effect relationships
The Issue
• Is it: Use library resources/services and
you will get better grades.
• Or: I want to do well and so I work hard to
achieve better grades (and one way I do
that is to use library resources/services).
“Not surprisingly, librarians are keen to show
that the use of expensive, scholarly
materials
positively correlates with higher grades,
although they cannot prove that this is so.”
Deborah Goodall & David Pattern
“There is growing pressure on all academic
library managers to be more accountable for
how they use limited resources and to
achieve institutional outcomes perceived as
important by college and university
stakeholders….”
Elizabeth Mezick
Value of Information
• Expect value-in-use
• Library’s collection reflects a “potential
value”
• Collection also reflects a “future value”
• Value of local collection is declining
Valuable is not about our professional
values;
in the paradigm of the value of libraries,
we are the producers,
not the consumers of services.
Our sense of what is valuable
really doesn’t matter
much at all unless it
matches that our our customers.
Eleanor Jo Rodger
Fundamental Changes
Libraries have changed more in the past two
decades than in the prior two centuries.
Technologyis the major driver . . .
We need to recognize that all this change
has only begun, and that change is
irreversible.
Increasingly it is important
to remember that libraries
provide few unique services.
Information is woven into our
lives
Quality of Information
This fast food approach to information consumption drives
librarians crazy. “Our information is healthier and tastes
better
too” they shout. But nobody listens. We’re too busy
Googling.”
Peter Morville
Key Characteristics of
Information
Uncertainty Knowledge
Ambiguity Indeterminacy
Redundancy System dependency
Sharing Timeliness
Compression Presentation
Stability Multiple life cycles
Leakability Substitutability
Criteria for Judging Value
Customer Criteria Value Added by the Service
Ease of use Browsing, formatting, mediation service,
orientation service, ordering, physical
accessibility
Noise reduction Access (item identification, subject
description, subject summary), linkage,
precision, selectivity
Quality Accuracy, comprehensiveness, currency,
reliability, validity
Adaptability Closeness to problem, flexibility,
simplicity, stimulatory
Time savings Response speed
Cost savings Cost savings
Collections are disrupted
Atoms to bits
Nature of Information is
Changing
Scare, controlled
Expensive
Shaped by elites
One-way, mass
consumption
Slow moving
External to our
worlds
All around us
Cheap or free
Shaped by consumers
Designed for sharing,
participation &
feedback
Immediate
Embedded in our
worlds
Information
was ….
Information
is ….
Value of the Academic Library
Ifthe physical proximity of
print collections had a demonstrable
impact on researcher productivity,
no university would hesitate to
allocate prime real estate
to library stacks.
Traditional Value Proposition
Without a great
library, there can
be no great
university.
David Kinly,
President of
The University of Illiniois
1929
Universities Provide
• Private goods &
services
– Courses exchanged for
tuition
– Research completed for
funding
• The value proposition
The value to an individual or an
organization determines
Academic Libraries Provide
• Public goods and
services
Print and online resources are
shared by all, usually without
the exchange of payment
• Value proposition
The collective value of all users
must be estimated to determine
if a good or service should be
Value is determined by the user
and the
useof information
Astin’s IEO Model
Input Output
Environment
Programs
Institutional
characteristic
s
Library
Fellow students
Faculty
Place of residence
Student Learning Outcomes
Model
Intelligence
General Reasoning
Broad Abilities
Knowledge, Understanding, and
Reasoning
Abstract,
Process
Oriented
Concrete,
Content-
Oriented
Campus Culture of Learning
• What learning experiences
require use of library
resources?
• What % of students engage
in learning experiences in
the library?
• Does the library contribute
to civic learning
expectations?
• Library $ spent that
support teaching and
learning?
• Consider using flourishing
and resiliency scales to
help identify the library’s
impact.
• What % of librarians serve
as student advisors?
Define, develop, and measure
outcomes
that contribute to
institutional effectiveness
ACRL Standards for Libraries in Higher Education
Challenge
It is not how much a library
is used that matters,
rather how does the library
impact or benefit the
customer?
Perspectives on Value
Benefits
Use
Nonuse
Direct
Indirect
Option – Preservation of option for
future use by me
Existence – Perceived value and
significance
to the community
Legacy – Value of preservation for
future generations
Personal
Organizational
Financial
Impacts
Personal
Why Use the Library?
Reasons Interactions Results
For a TASK
For PERSONAL
reasons
To get an
OBJECT or
INFORMATION
To perform an
ACTIVITY
Access
RESOURCES
Use of
RESOURCES or
SERVICES
OPERATIONS
ENVIRONMENT
S
COGNITIVE results
AFFECTIVE results
ACCOMPLISHMENTS
EXPECTATIONS met
TIME aspects
MONEY estimates
Generic Learning Outcomes
Knowledge & Understanding Skills
Attitudes Enjoyment, Inspiration, Creativity
Activity, Behavior, Progression
Organizational
• Full-time students
• Live on campus
• Interact more with faculty
• Study more
• Collaborate with their
peers
Student Learning is Affected by
…
NSSE
• 5 benchmarks of effective educational
practice
– Level of academic challenge
– Active & collaborative learning
– Student-Faculty interaction
– Enriching educational experiences
– Supportive campus environment
• Student self-reported gains in intellectual &
personal development
• No overlap between self-reported data &
standardized objective tests
NSSE – Use of the Academic
Library
• 50% never used the library
• Use of libraries at small, academically
challenging liberal arts colleges are
correlated with other purposeful activities
• Library use less intensive at larger
universities
• Students who work harder use library
Assessing Student Achievement
• Direct measures
– Capstone experience
– Use of a portfolio
– Standardized exam (Collegiate
Learning Assessment)
• Indirect measures
• Gains in student
performance are
quite low
• Individual learning
is characterized
by persistence
• Notable variation
within and across
institutions
Assessment of Higher Ed
Wabash National Study
• Different instrument – CAAP
• 2,212 students
• Nearly identical results to Academically
Adrift
• 44 percent no gains in the first year
• 33 percent no gains in 4 years
• Students only study about 15 hours per
week
“One way to demonstrate the library’s
contribution is to assess whether students’
experiences with the library
directly or indirectly
contribute to desired outcomes of college.”
George D. Kuh & Robert M. Gonyea
How to Demonstrate Impact in
…
• Student enrollment
• Student experiences
• Student learning
• Student grades (GPA) &
achievement
• Student retention & graduation
• Student career success
• Faculty productivity
• Institutional reputation
• The environment
Student Enrollment
• Recruitment of prospective
students
• Matriculation of admitted students
• Recommendation of current
students
Student Enrollment
Student
Learning
• GPA
• Professional/educational test
scores
• Learning assessments
• Faculty judgments
Student Learning
Meta-analysis
• Entering student characteristics
– SES
– High school GPA
– ACT/SAT scores
• Environment - Psychosocial and study
skill factors
– Academic goals, skills and self-confidence
– Social support & engagement (acculturation)
Student Learning Occurs …
• in the classroom
• in the laboratory
• with peers
• in the student union
• in the dorm
• in the library (for some)
• online
• and
Direct Measures
• Capstone Experience
• Portfolios
• Standardized Test
• Locally-developed
test
Capstone Projects
Indirect Measures
• Surveys
• Retention, graduation rates
• Grades
• Acceptance rates into
graduate programs
• Job placement rates
• Exit interviews
• Alumni surveys
Student
Grades
Non/Low Use
University of Wollongong
Usage of Electronic Resources
WAM = Weighted Average Marks (Grades)
Other Studies
• Hong Kong Baptist University
• Georgia State University
Hope College
University of Minnesota
Gym Bags and Mortarboards
Use Campus Recreational Facilities
At least 25 times, first-
year retention increased
1%
&
5-year graduation rates
increased 2%
University of Minnesota Library
• 5,368 first-year non-transfer students
• Use of library was associated with a .23
increase in students GPA
• More use of the library, GPA also goes up
University of Minnesota Library
• Opinion surveys
• Skills testing
• Observed behaviors
Library Instruction and GPA
University of Wyoming Libraries
• Analysis of 4,489 transcripts
• Slight positive relationship between upper-
level library instruction courses and GPA –
0.075 GPA difference – that’s less than
1/10th of 1 percent
• Research statement – 44%
• Evaluate Web site – objectivity –
52%
– authority – 65%
• Presentation to persuade – 12%
Library Instruction and GPA
Hong King Baptist University
• 45 sample groups – N=31 to 1,223, study
majors
• Pairs of data
• One-fourth (11) had a positive relationship
• Results:
– 1 or 2 workshops – little impact on GPA
– 3 or 4 workshops – ½ show a positive impact
– 5 workshops (1 sample group) – 100% had a
higher GPA
Bibliographic Instruction
• Improvement in basic library skills is the
means and not the end
• Yet the means is the focus for evaluation
efforts
• Evaluation efforts focus on
– Opinion surveys
– Skills improvement
– Pre-test & post-test knowledge
• Not the impact on student achievement
Library experiences do not seem to
directly
contribute to gains in information
literacy,
to what students gain overall in college,
or
to student satisfaction.
Kuh & Gonyea
How scalable is library instruction?
Student Retention & Graduation
Attrition
Retention
Persistence
Completion
Graduation
Rates
• Fall-to-fall retention
• Graduation rates
Student Retention
Retention Concepts
• Institutional retention
– Enrolling & graduating from the same
institution
• Program retention
– Enrolling & graduating with the same
major/department/school
• System retention
– Students who leave one university yet
continue and complete post-secondary
studies elsewhere
Measures of Retention
• Persistence (Continuation rate)
– From first to second year? Entry to
graduation?
• Completion rate
– From entry to graduation (Student goals?)
• Graduation rates
– Are transfers included? Time period?
• Attrition
– Leaving university? Leaving higher ed?
Measures of Retention
• Stopout
– Leave university with the intention (and
action) of returning later to complete a
program
• Dropout
– Leave university with intention (and action) of
NOT returning
• Transfer
– Change institutions yet persist in higher
education
– May change type of institution
Why Students Leave?
• Students’ decision to leave University is influenced
by many personal factors
– Financial reasons
– Family responsibilities
– Lack of academic ability
– Poor fit, etc.
• Foundational Theories from Education / Psychology:
– Tinto’s “Model of Student Integration”
– Bean’s “Model of Student Attrition”
Tinto’s
Model of Student Integration
Pre-entry
Attributes
Goals /
Commitment
s
Institutional
Experience
s
Integration Goals /
Commitment
s
Outcome
SES
Skills &
Abilities
Quality
of
Educatio
n
Intentions
Institutional
Commitment
s
Academic System
Performance
Engagement
Extra-
Curricular
Peer group
Social System
Academic
Integration
Social
Integration
Intentions
Goal
Institutional
Match
Stay
or
Leave
Bean’s
Model of Student Attrition
Grades
Courses
Educational Goals
Major & Job Certainty
Opportunity to Transfer
Family Approval
Organization
alVariables
Personal
Variables
Environment
al
Variables
Loyalty Attitudes
Certainty
Practical
Value
Intent
Dropout
Student Retention & Graduation
• Important because … rankings,
revenues, educational achievement,
emotional well-being
• Many reasons for drop-outs are not
under the control of the university
• Engagement is the key
Indicators
• Student goal
attainment
• Course retention
• Subsequent course
work
• Fall-to-fall persistence
• Time to degree
• Degree completion
• Grad school
enrollment
• Transfer rate & success
• Employer assessment
• Academic value add
• Student satisfaction
• Professional growth
• Student involvement
• Citizenship &
engagement
Australasian Survey of Student
Engagement (AUSSE)
Curtin University
University of Huddersfield
“A high rate of attrition
is indicative of a failure
on the part of an institution
to achieve its purpose.”
Elizabeth Mezick
Student Engagement
“many students
don’t develop a
personal connection
with their institution.
And when they
don’t, they leave”
Gonzales 2010 NSSE &
CSEQ
Library Retention Studies
• Statistically significant relationships between
library expenditures, or staffing levels and
student retention
 E.g. Hiscock, 1986
Hamrick, Schuh, & Shelley, 2004
Mezick, 2007
Graduation Rates & Library
Expenditures
• Used IPEDS data on institutional
characteristics & resource allocations
• Library expenditures was strongly
correlated with graduation rates – 1.77
percent increase in graduation rates
• Greatest payoff is attributable to enhanced
library expenditures (+0.92) and instruction
(+0.80) while increased non-library
contributions were quite modest (+0.27)
Hamrick, Schuh & Shelley
Library Retention Studies
• Relationships between library use
(collections) and student retention
– Student who borrowed books = more likely to
persist
• E.g. Kramer & Kramer, 1968
• Impact of instruction
– Students involved in library skills programs
showed lower attrition rates
• E.g. Knapp, 1966
Library Retention Studies
University of Minnesota
– 77% of undergrads made use of the
libraries, 85% of grad students made use of
the libraries
– Students who used the library at least once
were 1.54 times more likely to re-enroll
Library Retention Studies
• Some library involvement in first year
experience programs; specific programs for
“at risk” groups
– NOT proven to have significant effect
• E.g. Hollis, 2001
Colton, et al, 2002
Aguilar & Keating, 2009
Love, 2009
Library Retention Studies
• Relationship between library employment
& retention
– Higher completion rate among library student
workers
• E.g. Wilder, 1990
Rushing & Poole, 2002
“If strong linkages between libraries
and student retention can be made,
then the perceived value of the library
may indeed rise.”
Steven Bell
• Some groups, some majors & seniors
engage in more library-related activities
• Academic support expenditures tend to
correlate with increased engagement
• Institutional academic challenge
correlates with library use
Student Career Success
Grad School Exams
Alumni Surveys
• Job placement rates
• First-year job salaries
• Professional/graduate school
acceptance
• Internship success
• Marketable skills
Student Success
• Integration of library resources and
services into course syllabi, Websites,
lectures, labs, reserve readings, etc.
• Faculty/librarian collaborations;
cooperative curriculum, assignment, or
assessment design
Faculty Teaching
Perceived Benefits for Teaching
• Savings
– Of own time
– Of own money
– Of other resources
• Improvements
– Teaching
– Course-related materials
– Student performance
Library Value Wheel
Impact on Faculty
• Library is the source for most journal
articles (individual subscriptions are way
down)
• If library subscriptions were unavailable –
productivity would decrease 17%
• Library is not the source of book readings
• 42% of reading material is library provided
Time
• Academics spend a lot of time reading
• Article reading inspires new thinking,
improved results, changed focus
• Award-winning academics read more
• Academics who publish more use more
library resources
Ithaka Studies
• Library services not
understood
• Library services not valued
• The Library is
disappearing
• Number of publications, number of
patents, value of technology transfer
• Tenure/promotion judgments
Faculty Research Productivity
Faculty Grants
• Number of grant proposals (funded or
unfunded)
• Value of grants funded
Assessment of Research
• Payback model – form of ROI
• Research impact
• Research utilization ladder
• Lavis decision-making impact model
• Weiss logic model
• HTA organization assessment
framework
• Societal impact framework
• Research assessment exercise
• Becker medical library model
For Most Impact Models
• Indicators of research output
• Indicators of knowledge transfer
• Indicators of implementation
• Indicators of community benefit
Faculty Productivity
• Faculty recruitment
• Institutional rankings
• Community engagement
Institutional Reputation & Prestige
Institutional Reputation
• Changes in reputational rankings affects
student & faculty recruitment
• University budget allocations to libraries
have decreased
Since the library absorbs a very small percentage of a
university budget, the contribution of the library is
disproportionately high relative to its cost to the institution.
Sharon Weiner
• Indispensable for their research
• Maintain a high-level overview of their field
• Value for money is good
• Library not available, costs would increase
40%
• Take 31% longer to locate same information
Library Value Scorecard
• Relational Capital
• Library Capital
• Library Virtue
• Library Momentum
University & the Library Can
• Attract outstanding faculty
• Retain outstanding faculty
• Foster innovative research
• Align library activities with
university goals
Value of Special Libraries
• Time saved
• Money saved
• New revenues
• Other outcomes
In addition, to ROI
• Knowledge-Value Add
• Intranet Team Forums
• Intellectual Capital
Valuation
Measurements of value
were, in fact, a
key differentiator
between
successful
and unsuccessful corporate libraries
James Matarazzo
Value of the
(Rooney-Browne, 2009b).
Social Capital
• Bonding social capital
• Bridging social capital
• Linking social capital
Social Benefits
• Basic reading literacy
• Business/career
• Information literacy
• Library as place
• Summer reading
• Local history &
genealogy
• Health & well-being
• Social cohesion
• General information
• Empowerment
• Social connection
• Education
• Employment
• Health & wellness
• eGovernment
• Community engagement
• Personal finance
Making Cities Stronger
• Building a stronger local economy
• Improving early literacy & school
readiness
• Building workforce participation
• Supporting small business
• The power of place
• Literacy
• Workforce development
• Business development
• Value to homes and
neighborhoods
Libraries/Building/Communities
• Developing social capital
– Providing a welcoming environment
– Creating a pride of place
– Attracting users from all walks of life
– Reaching out to the community
– Appreciation of cultural differences
– Building bridges to government
– Encouraging collaboration across the
community
Libraries/Building/Communities
• Overcoming the digital divide
– Making technology accessible
– Exploiting technology to benefit the
community
• Creating informed communities
– Community information
– Government information
– Providing a gateway to the world of
information
Libraries/Building/Communities
• Convenient and comfortable places of
learning
– Developing information skills
– Stimulating ideas and discussion
– Supporting vulnerable learners
– Supporting students
Outcomes
Enhanced quality of life
Enhanced enjoyment from
hobbies
Able to obtain information
Facilitates lifelong learning
Support for children’s education
Contributions
Safe and pleasant place
Supporting educational facilities
Facilitating lifelong learning
Encouraging responsible social
behavior
Ensuring access to the Internet
Tracking Value
The Engaged Library:
Chicago Stories of Community Building
•Prove that public libraries build social capital
•Identify & connect the library’s assets to the
community
•Assess & strengthen the library’s connections with
and use of community assets
•Produce a toolkit for other libraries to adopt to
•Mapping tools to perform an inventory services,
identify areas for improvement and highlight library’s
contribution to the community’s wider social,
educational, cultural and economic goals.
PLQIM
• Access to information
• Community & personal participation
• Meeting readers’ needs
• Learners’ experiences
• Ethos & values
• Organization & use of resources
• Leadership
Valuing the Collection
Dewey Subclass
Number of Titles
2010-2011 Avg
List Total Value ($)
001 - Knowledge $76.71 $0.00
002 - The book $62.45 $0.00
003 - Systems $129.77 $0.00
004 - Data processing. Computer science $89.82 $0.00
005 - Computer programming, programs, data $69.14 $0.00
006 - Special computer methods $83.60 $0.00
010 - Bibliography $73.65 $0.00
011 - Bibliographies $69.46 $0.00
012 - Bibliographies of individuals $0.00 $0.00
013 - Of works by specific classes of authors $0.00 $0.00
014 - Of anonymous and pseudonymous works $55.95 $0.00
015 - Of works from specific places $184.99 $0.00
016 - Of works on specific subjects $134.87 $0.00
017 - General subject catalogs $0.00 $0.00
018 - Catalogs arranged by author, date, etc. $0.00 $0.00
019 - Dictionary catalogs $0.00 $0.00
020 - Library and information sciences $56.06 $0.00
021 - Library relationships $62.60 $0.00
022 - Administration of the physical plant $65.50 $0.00
023 - Personnel administration $56.00 $0.00
025 - Library operations $77.02 $0.00
026 - Libraries for specific subjects $89.99 $0.00
027 - General libraries $66.25 $0.00
Joe@JoeMatthews.Org
www.joematthews.org
Joe Matthews
Library Consultant
What Are the Results
Four Year
College
Full-time
Four Year
College
Part-time
Two Year College
Stopout/Transfer
College degree – 19%
AA degree – 8%
No college degree –
60%
No college
Graduate degree –
11%

The Value & Economic Measures of Libraries

  • 1.
    The Value &Economic Measures of Libraries 10th Northumbria International Library Conference Joe Matthews July 25, 2013 Morning Session
  • 2.
  • 3.
    Outline • Performance Measures •Value • Value of Information • Value of Information Services
  • 4.
    Outline Personal value • Directmeasures • Indirect measures Organizational value • Academic libraries • Public libraries • National libraries )
  • 5.
    Few libraries existin a vacuum, accountable only to themselves. There is thus always a larger context for accessing library quality, that is, what and how well does the library contribute to achieving the overall goals of the parent constituencies? Sarah Pritchard
  • 6.
    There is nosystematic evidence collected which shows the value of academic libraries for teaching and research staff. Claire Creaser and Valerie Spezi
  • 7.
    Performance Measures Input Proces s OutputOutcome s Outcome s Library Services Individual Society Efficiency Effectivenes s Cost Effectiveness Impact VALUE Cost benefit Resource s Capability Use Beneficial effects
  • 8.
    Start with theend in mind: work backwards Refocus from the activity to the impact
  • 9.
  • 10.
    Library Control How much?How many? How economical? How prompt? Magnitude % of change last year % of overall change Cost Magnitude Change Resources used Units processed Cycle times Turnaround time Anticipatory
  • 11.
    Library & CustomersDecide How valuable? How reliable? How accurate? Effort expended Cost Benefits obtained Dependability Access Accuracy Completeness Comprehensiveness Currency
  • 12.
    Customers Decide How well?How courteous? How responsive? How satisfied? Accuracy Promptness Courtesy Expertise Attentive Welcoming Anticipatory Helpful Empathetic Expectations met Materials obtained Personal interaction Ease of use Environment Comfort Willingness to return
  • 13.
    Live by thenumbers, ….
  • 14.
    Challenges Lack of consensusabout what should be measured and how Lack of understanding of performance measurement and metrics Organizational structural issues Lack of precision in measuring performance, and alignment issues Determining the “bottom line” is too far away Majority of stakeholders are too far away Library staff find it difficult to see the “big”
  • 15.
    And the surveysaid ….
  • 16.
    Lack of aConnection • Budget and outputs (and outcomes) are separated • No “bottom line” measure for libraries • Decision-making process is bigger than the library • Library has neither champions nor foes • Library benefits are not widely self-evident
  • 17.
    Orr’s Fundamental Questions •How good is the library? • What good does the library do? • How well is the library managed?
  • 18.
    We should bea bit wary of the “little library” …For when it is good, it is very, very good and when it is bad, it’s a “pretty good library for a town this size.” Eleanor Jo Rodger
  • 20.
    Levels of Assessment… • Individual student • Course • Departmental/Program • College or University
  • 21.
    Types of Measures •Direct – Provide tangible, visible and self-explanatory evidence of what students have & have not learned • Indirect – Capture students’ perceptions of their knowledge & skills; supplement direct measures; sometimes called surrogates
  • 22.
    Qualitative Tools • Focusgroups – open ended • Biography • Phenomenology – capture the “Aha!” moment • Grounded theory • Ethnography • Case study
  • 23.
    Qualitative Assessment • Providesin-depth understanding of user responses and interactions • Represents part of a long-term strategy of formative evaluative
  • 24.
    Quantitative Tools • Surveys •Transaction logs • Statistics from systems • Observations (count)
  • 25.
    Quantitative Assessment • Analysesto determine library impacts on academic performance, retention rates • Describe retention rates and GPAs in defined populations over semesters and users • Compare users & non-users of library services while adjusting for academic preparation and background differences • Conduct quasi-experimental designs employing multivariate analysis of covariance & hierarchical regression
  • 26.
  • 27.
    Be cautious aboutcause-and-effect relationships
  • 28.
    The Issue • Isit: Use library resources/services and you will get better grades. • Or: I want to do well and so I work hard to achieve better grades (and one way I do that is to use library resources/services).
  • 29.
    “Not surprisingly, librariansare keen to show that the use of expensive, scholarly materials positively correlates with higher grades, although they cannot prove that this is so.” Deborah Goodall & David Pattern
  • 30.
    “There is growingpressure on all academic library managers to be more accountable for how they use limited resources and to achieve institutional outcomes perceived as important by college and university stakeholders….” Elizabeth Mezick
  • 34.
    Value of Information •Expect value-in-use • Library’s collection reflects a “potential value” • Collection also reflects a “future value” • Value of local collection is declining
  • 35.
    Valuable is notabout our professional values; in the paradigm of the value of libraries, we are the producers, not the consumers of services. Our sense of what is valuable really doesn’t matter much at all unless it matches that our our customers. Eleanor Jo Rodger
  • 36.
    Fundamental Changes Libraries havechanged more in the past two decades than in the prior two centuries. Technologyis the major driver . . . We need to recognize that all this change has only begun, and that change is irreversible.
  • 37.
    Increasingly it isimportant to remember that libraries provide few unique services.
  • 38.
    Information is woveninto our lives
  • 39.
    Quality of Information Thisfast food approach to information consumption drives librarians crazy. “Our information is healthier and tastes better too” they shout. But nobody listens. We’re too busy Googling.” Peter Morville
  • 40.
    Key Characteristics of Information UncertaintyKnowledge Ambiguity Indeterminacy Redundancy System dependency Sharing Timeliness Compression Presentation Stability Multiple life cycles Leakability Substitutability
  • 41.
    Criteria for JudgingValue Customer Criteria Value Added by the Service Ease of use Browsing, formatting, mediation service, orientation service, ordering, physical accessibility Noise reduction Access (item identification, subject description, subject summary), linkage, precision, selectivity Quality Accuracy, comprehensiveness, currency, reliability, validity Adaptability Closeness to problem, flexibility, simplicity, stimulatory Time savings Response speed Cost savings Cost savings
  • 42.
  • 44.
    Nature of Informationis Changing Scare, controlled Expensive Shaped by elites One-way, mass consumption Slow moving External to our worlds All around us Cheap or free Shaped by consumers Designed for sharing, participation & feedback Immediate Embedded in our worlds Information was …. Information is ….
  • 47.
    Value of theAcademic Library
  • 48.
    Ifthe physical proximityof print collections had a demonstrable impact on researcher productivity, no university would hesitate to allocate prime real estate to library stacks.
  • 49.
    Traditional Value Proposition Withouta great library, there can be no great university. David Kinly, President of The University of Illiniois 1929
  • 50.
    Universities Provide • Privategoods & services – Courses exchanged for tuition – Research completed for funding • The value proposition The value to an individual or an organization determines
  • 51.
    Academic Libraries Provide •Public goods and services Print and online resources are shared by all, usually without the exchange of payment • Value proposition The collective value of all users must be estimated to determine if a good or service should be
  • 52.
    Value is determinedby the user and the useof information
  • 53.
    Astin’s IEO Model InputOutput Environment Programs Institutional characteristic s Library Fellow students Faculty Place of residence
  • 54.
    Student Learning Outcomes Model Intelligence GeneralReasoning Broad Abilities Knowledge, Understanding, and Reasoning Abstract, Process Oriented Concrete, Content- Oriented
  • 56.
    Campus Culture ofLearning • What learning experiences require use of library resources? • What % of students engage in learning experiences in the library? • Does the library contribute to civic learning expectations? • Library $ spent that support teaching and learning? • Consider using flourishing and resiliency scales to help identify the library’s impact. • What % of librarians serve as student advisors?
  • 57.
    Define, develop, andmeasure outcomes that contribute to institutional effectiveness ACRL Standards for Libraries in Higher Education
  • 58.
    Challenge It is nothow much a library is used that matters, rather how does the library impact or benefit the customer?
  • 59.
    Perspectives on Value Benefits Use Nonuse Direct Indirect Option– Preservation of option for future use by me Existence – Perceived value and significance to the community Legacy – Value of preservation for future generations Personal Organizational Financial Impacts
  • 60.
  • 61.
    Why Use theLibrary? Reasons Interactions Results For a TASK For PERSONAL reasons To get an OBJECT or INFORMATION To perform an ACTIVITY Access RESOURCES Use of RESOURCES or SERVICES OPERATIONS ENVIRONMENT S COGNITIVE results AFFECTIVE results ACCOMPLISHMENTS EXPECTATIONS met TIME aspects MONEY estimates
  • 62.
    Generic Learning Outcomes Knowledge& Understanding Skills Attitudes Enjoyment, Inspiration, Creativity Activity, Behavior, Progression
  • 63.
  • 64.
    • Full-time students •Live on campus • Interact more with faculty • Study more • Collaborate with their peers Student Learning is Affected by …
  • 65.
    NSSE • 5 benchmarksof effective educational practice – Level of academic challenge – Active & collaborative learning – Student-Faculty interaction – Enriching educational experiences – Supportive campus environment • Student self-reported gains in intellectual & personal development • No overlap between self-reported data & standardized objective tests
  • 66.
    NSSE – Useof the Academic Library • 50% never used the library • Use of libraries at small, academically challenging liberal arts colleges are correlated with other purposeful activities • Library use less intensive at larger universities • Students who work harder use library
  • 68.
    Assessing Student Achievement •Direct measures – Capstone experience – Use of a portfolio – Standardized exam (Collegiate Learning Assessment) • Indirect measures
  • 69.
    • Gains instudent performance are quite low • Individual learning is characterized by persistence • Notable variation within and across institutions Assessment of Higher Ed
  • 70.
    Wabash National Study •Different instrument – CAAP • 2,212 students • Nearly identical results to Academically Adrift • 44 percent no gains in the first year • 33 percent no gains in 4 years • Students only study about 15 hours per week
  • 71.
    “One way todemonstrate the library’s contribution is to assess whether students’ experiences with the library directly or indirectly contribute to desired outcomes of college.” George D. Kuh & Robert M. Gonyea
  • 73.
    How to DemonstrateImpact in … • Student enrollment • Student experiences • Student learning • Student grades (GPA) & achievement • Student retention & graduation • Student career success • Faculty productivity • Institutional reputation • The environment
  • 74.
  • 75.
    • Recruitment ofprospective students • Matriculation of admitted students • Recommendation of current students Student Enrollment
  • 76.
  • 77.
    • GPA • Professional/educationaltest scores • Learning assessments • Faculty judgments Student Learning
  • 78.
    Meta-analysis • Entering studentcharacteristics – SES – High school GPA – ACT/SAT scores • Environment - Psychosocial and study skill factors – Academic goals, skills and self-confidence – Social support & engagement (acculturation)
  • 79.
    Student Learning Occurs… • in the classroom • in the laboratory • with peers • in the student union • in the dorm • in the library (for some) • online • and
  • 81.
    Direct Measures • CapstoneExperience • Portfolios • Standardized Test • Locally-developed test
  • 82.
  • 83.
    Indirect Measures • Surveys •Retention, graduation rates • Grades • Acceptance rates into graduate programs • Job placement rates • Exit interviews • Alumni surveys
  • 84.
  • 87.
  • 88.
  • 89.
    Usage of ElectronicResources WAM = Weighted Average Marks (Grades)
  • 90.
    Other Studies • HongKong Baptist University • Georgia State University
  • 91.
  • 92.
    University of Minnesota GymBags and Mortarboards Use Campus Recreational Facilities At least 25 times, first- year retention increased 1% & 5-year graduation rates increased 2%
  • 94.
    University of MinnesotaLibrary • 5,368 first-year non-transfer students • Use of library was associated with a .23 increase in students GPA • More use of the library, GPA also goes up
  • 95.
  • 97.
    • Opinion surveys •Skills testing • Observed behaviors
  • 98.
    Library Instruction andGPA University of Wyoming Libraries • Analysis of 4,489 transcripts • Slight positive relationship between upper- level library instruction courses and GPA – 0.075 GPA difference – that’s less than 1/10th of 1 percent
  • 99.
    • Research statement– 44% • Evaluate Web site – objectivity – 52% – authority – 65% • Presentation to persuade – 12%
  • 100.
    Library Instruction andGPA Hong King Baptist University • 45 sample groups – N=31 to 1,223, study majors • Pairs of data • One-fourth (11) had a positive relationship • Results: – 1 or 2 workshops – little impact on GPA – 3 or 4 workshops – ½ show a positive impact – 5 workshops (1 sample group) – 100% had a higher GPA
  • 101.
    Bibliographic Instruction • Improvementin basic library skills is the means and not the end • Yet the means is the focus for evaluation efforts • Evaluation efforts focus on – Opinion surveys – Skills improvement – Pre-test & post-test knowledge • Not the impact on student achievement
  • 102.
    Library experiences donot seem to directly contribute to gains in information literacy, to what students gain overall in college, or to student satisfaction. Kuh & Gonyea
  • 103.
    How scalable islibrary instruction?
  • 104.
    Student Retention &Graduation Attrition Retention Persistence Completion Graduation Rates
  • 105.
    • Fall-to-fall retention •Graduation rates Student Retention
  • 106.
    Retention Concepts • Institutionalretention – Enrolling & graduating from the same institution • Program retention – Enrolling & graduating with the same major/department/school • System retention – Students who leave one university yet continue and complete post-secondary studies elsewhere
  • 107.
    Measures of Retention •Persistence (Continuation rate) – From first to second year? Entry to graduation? • Completion rate – From entry to graduation (Student goals?) • Graduation rates – Are transfers included? Time period? • Attrition – Leaving university? Leaving higher ed?
  • 108.
    Measures of Retention •Stopout – Leave university with the intention (and action) of returning later to complete a program • Dropout – Leave university with intention (and action) of NOT returning • Transfer – Change institutions yet persist in higher education – May change type of institution
  • 109.
    Why Students Leave? •Students’ decision to leave University is influenced by many personal factors – Financial reasons – Family responsibilities – Lack of academic ability – Poor fit, etc. • Foundational Theories from Education / Psychology: – Tinto’s “Model of Student Integration” – Bean’s “Model of Student Attrition”
  • 110.
    Tinto’s Model of StudentIntegration Pre-entry Attributes Goals / Commitment s Institutional Experience s Integration Goals / Commitment s Outcome SES Skills & Abilities Quality of Educatio n Intentions Institutional Commitment s Academic System Performance Engagement Extra- Curricular Peer group Social System Academic Integration Social Integration Intentions Goal Institutional Match Stay or Leave
  • 111.
    Bean’s Model of StudentAttrition Grades Courses Educational Goals Major & Job Certainty Opportunity to Transfer Family Approval Organization alVariables Personal Variables Environment al Variables Loyalty Attitudes Certainty Practical Value Intent Dropout
  • 113.
    Student Retention &Graduation • Important because … rankings, revenues, educational achievement, emotional well-being • Many reasons for drop-outs are not under the control of the university • Engagement is the key
  • 114.
    Indicators • Student goal attainment •Course retention • Subsequent course work • Fall-to-fall persistence • Time to degree • Degree completion • Grad school enrollment • Transfer rate & success • Employer assessment • Academic value add • Student satisfaction • Professional growth • Student involvement • Citizenship & engagement
  • 115.
    Australasian Survey ofStudent Engagement (AUSSE)
  • 116.
  • 117.
  • 118.
    “A high rateof attrition is indicative of a failure on the part of an institution to achieve its purpose.” Elizabeth Mezick
  • 119.
    Student Engagement “many students don’tdevelop a personal connection with their institution. And when they don’t, they leave” Gonzales 2010 NSSE & CSEQ
  • 120.
    Library Retention Studies •Statistically significant relationships between library expenditures, or staffing levels and student retention  E.g. Hiscock, 1986 Hamrick, Schuh, & Shelley, 2004 Mezick, 2007
  • 121.
    Graduation Rates &Library Expenditures • Used IPEDS data on institutional characteristics & resource allocations • Library expenditures was strongly correlated with graduation rates – 1.77 percent increase in graduation rates • Greatest payoff is attributable to enhanced library expenditures (+0.92) and instruction (+0.80) while increased non-library contributions were quite modest (+0.27) Hamrick, Schuh & Shelley
  • 122.
    Library Retention Studies •Relationships between library use (collections) and student retention – Student who borrowed books = more likely to persist • E.g. Kramer & Kramer, 1968 • Impact of instruction – Students involved in library skills programs showed lower attrition rates • E.g. Knapp, 1966
  • 123.
    Library Retention Studies Universityof Minnesota – 77% of undergrads made use of the libraries, 85% of grad students made use of the libraries – Students who used the library at least once were 1.54 times more likely to re-enroll
  • 124.
    Library Retention Studies •Some library involvement in first year experience programs; specific programs for “at risk” groups – NOT proven to have significant effect • E.g. Hollis, 2001 Colton, et al, 2002 Aguilar & Keating, 2009 Love, 2009
  • 125.
    Library Retention Studies •Relationship between library employment & retention – Higher completion rate among library student workers • E.g. Wilder, 1990 Rushing & Poole, 2002
  • 126.
    “If strong linkagesbetween libraries and student retention can be made, then the perceived value of the library may indeed rise.” Steven Bell
  • 127.
    • Some groups,some majors & seniors engage in more library-related activities • Academic support expenditures tend to correlate with increased engagement • Institutional academic challenge correlates with library use
  • 128.
    Student Career Success GradSchool Exams Alumni Surveys
  • 129.
    • Job placementrates • First-year job salaries • Professional/graduate school acceptance • Internship success • Marketable skills Student Success
  • 131.
    • Integration oflibrary resources and services into course syllabi, Websites, lectures, labs, reserve readings, etc. • Faculty/librarian collaborations; cooperative curriculum, assignment, or assessment design Faculty Teaching
  • 132.
    Perceived Benefits forTeaching • Savings – Of own time – Of own money – Of other resources • Improvements – Teaching – Course-related materials – Student performance
  • 133.
  • 135.
    Impact on Faculty •Library is the source for most journal articles (individual subscriptions are way down) • If library subscriptions were unavailable – productivity would decrease 17% • Library is not the source of book readings • 42% of reading material is library provided
  • 136.
    Time • Academics spenda lot of time reading • Article reading inspires new thinking, improved results, changed focus • Award-winning academics read more • Academics who publish more use more library resources
  • 137.
    Ithaka Studies • Libraryservices not understood • Library services not valued • The Library is disappearing
  • 138.
    • Number ofpublications, number of patents, value of technology transfer • Tenure/promotion judgments Faculty Research Productivity Faculty Grants • Number of grant proposals (funded or unfunded) • Value of grants funded
  • 139.
    Assessment of Research •Payback model – form of ROI • Research impact • Research utilization ladder • Lavis decision-making impact model • Weiss logic model • HTA organization assessment framework • Societal impact framework • Research assessment exercise • Becker medical library model
  • 140.
    For Most ImpactModels • Indicators of research output • Indicators of knowledge transfer • Indicators of implementation • Indicators of community benefit
  • 142.
  • 143.
    • Faculty recruitment •Institutional rankings • Community engagement Institutional Reputation & Prestige
  • 144.
    Institutional Reputation • Changesin reputational rankings affects student & faculty recruitment • University budget allocations to libraries have decreased Since the library absorbs a very small percentage of a university budget, the contribution of the library is disproportionately high relative to its cost to the institution. Sharon Weiner
  • 145.
    • Indispensable fortheir research • Maintain a high-level overview of their field • Value for money is good • Library not available, costs would increase 40% • Take 31% longer to locate same information
  • 146.
    Library Value Scorecard •Relational Capital • Library Capital • Library Virtue • Library Momentum
  • 147.
    University & theLibrary Can • Attract outstanding faculty • Retain outstanding faculty • Foster innovative research • Align library activities with university goals
  • 148.
    Value of SpecialLibraries • Time saved • Money saved • New revenues • Other outcomes
  • 149.
    In addition, toROI • Knowledge-Value Add • Intranet Team Forums • Intellectual Capital Valuation
  • 150.
    Measurements of value were,in fact, a key differentiator between successful and unsuccessful corporate libraries James Matarazzo
  • 151.
  • 152.
  • 153.
    Social Capital • Bondingsocial capital • Bridging social capital • Linking social capital
  • 154.
    Social Benefits • Basicreading literacy • Business/career • Information literacy • Library as place • Summer reading • Local history & genealogy • Health & well-being • Social cohesion • General information • Empowerment
  • 155.
    • Social connection •Education • Employment • Health & wellness • eGovernment • Community engagement • Personal finance
  • 156.
    Making Cities Stronger •Building a stronger local economy • Improving early literacy & school readiness • Building workforce participation • Supporting small business • The power of place
  • 157.
    • Literacy • Workforcedevelopment • Business development • Value to homes and neighborhoods
  • 158.
    Libraries/Building/Communities • Developing socialcapital – Providing a welcoming environment – Creating a pride of place – Attracting users from all walks of life – Reaching out to the community – Appreciation of cultural differences – Building bridges to government – Encouraging collaboration across the community
  • 159.
    Libraries/Building/Communities • Overcoming thedigital divide – Making technology accessible – Exploiting technology to benefit the community • Creating informed communities – Community information – Government information – Providing a gateway to the world of information
  • 160.
    Libraries/Building/Communities • Convenient andcomfortable places of learning – Developing information skills – Stimulating ideas and discussion – Supporting vulnerable learners – Supporting students
  • 161.
    Outcomes Enhanced quality oflife Enhanced enjoyment from hobbies Able to obtain information Facilitates lifelong learning Support for children’s education
  • 162.
    Contributions Safe and pleasantplace Supporting educational facilities Facilitating lifelong learning Encouraging responsible social behavior Ensuring access to the Internet
  • 163.
    Tracking Value The EngagedLibrary: Chicago Stories of Community Building •Prove that public libraries build social capital •Identify & connect the library’s assets to the community •Assess & strengthen the library’s connections with and use of community assets •Produce a toolkit for other libraries to adopt to •Mapping tools to perform an inventory services, identify areas for improvement and highlight library’s contribution to the community’s wider social, educational, cultural and economic goals.
  • 165.
    PLQIM • Access toinformation • Community & personal participation • Meeting readers’ needs • Learners’ experiences • Ethos & values • Organization & use of resources • Leadership
  • 167.
    Valuing the Collection DeweySubclass Number of Titles 2010-2011 Avg List Total Value ($) 001 - Knowledge $76.71 $0.00 002 - The book $62.45 $0.00 003 - Systems $129.77 $0.00 004 - Data processing. Computer science $89.82 $0.00 005 - Computer programming, programs, data $69.14 $0.00 006 - Special computer methods $83.60 $0.00 010 - Bibliography $73.65 $0.00 011 - Bibliographies $69.46 $0.00 012 - Bibliographies of individuals $0.00 $0.00 013 - Of works by specific classes of authors $0.00 $0.00 014 - Of anonymous and pseudonymous works $55.95 $0.00 015 - Of works from specific places $184.99 $0.00 016 - Of works on specific subjects $134.87 $0.00 017 - General subject catalogs $0.00 $0.00 018 - Catalogs arranged by author, date, etc. $0.00 $0.00 019 - Dictionary catalogs $0.00 $0.00 020 - Library and information sciences $56.06 $0.00 021 - Library relationships $62.60 $0.00 022 - Administration of the physical plant $65.50 $0.00 023 - Personnel administration $56.00 $0.00 025 - Library operations $77.02 $0.00 026 - Libraries for specific subjects $89.99 $0.00 027 - General libraries $66.25 $0.00
  • 169.
  • 170.
    What Are theResults Four Year College Full-time Four Year College Part-time Two Year College Stopout/Transfer College degree – 19% AA degree – 8% No college degree – 60% No college Graduate degree – 11%

Editor's Notes

  • #3 You can download one and buy the other
  • #7 Claire Creaser and Valerie Spezi. Working Together. June 2012. UK: Loughborough University.Libraries are busy measuring activity and not measuring value
  • #8 Richard Orr
  • #9 Focus on outcomes not process
  • #10 Not all impacts are positiveNot all impacts are intendedNot all impacts are immediateDifficulty in separating library impact from other influences
  • #11 The How Questions
  • #14 Allan Pratt and Ellen Altman. Live by the Numbers, Die by the Numbers
  • #16 2/3rds of managers responsible for library budgets have no idea of how to evaluate or value the library
  • #18 How good is the library? Quality and capabilitiesWhat good does the library do? Benefits, Impacts - ValueHow well is the library managed? Efficiency - benchmarkingHow can we move from bad to good?
  • #19 New Zealand Libraries, March 1990
  • #20 What are some of the Tools for Assessment - Evaluation
  • #22 Direct method – the financial savings method is used widely to monetize the direct use benefits of public libraries.As such, it undercounts benefits that have had an estimated value assigned to it Not so in academic libraries
  • #23 Focus groups – open ended – standard, guided, exploratoryEthnography – work study, photo essays, mapping dairies, etc.University of Rochester –they “know” their customers
  • #25 Survey - random sample best, set questions (no follow up), statistical analysis, representative sample, response ratesExplore - How was it?, What do you do?, What do you want?, What did you do?
  • #27 TriangulationFlickeAGrinberg http://www.flickr.com/photos/agrinberg/4893259336/
  • #28 Correlation does not mean cause-and-effect
  • #30 Deborah Goodall & David Pattern . Academic library non/low use and undergraduate student achievement. Library Management, 32 (3), 2011, 159-170.p. 161
  • #32 DefinitionsA nounExchange for or equivalenceMonetary or material worthUsefulness, utilityPrinciple, standard, or qualityToll, cost or priceDarkness or lightness of color A verbEstimate the worth of something (appraise)Regard highly (esteem)Assign a value to something Other definitions depending on the fieldRegardless of context, defining value is a complex issue with its own philosophical discipline; axiology (Cram, 1999, p.11). Axiology, or Value Theory defines three different dimensions of value; extrinsic value, systematic value and intrinsic value (Hartman, 1969, p. 114). Thus, there are a number of different value types, including personal value, aesthetic value, religious value, spiritual value; and ethical value. Bequest value – willingness to pay for the endowment of the good or service for future generationsGoogle images - add_value.jpgonproductmanagement.net
  • #33 Adam SmithValue-in-exchangeValue-in-use (utility theory)Google image adam‑smith.jpgblog.braintraffic.com
  • #34 Value is a moving targetWhat was valuable vs.What is valuable vs.What will be valuable
  • #36 Eleanor Jo Rodger. Value & Vision. American Libraries, November 2002, 50-52.Ideas of value have changedMoving target, constantly needs assessmentUsefulness, quality, availability, imageHistoric is not valuableDoesn't’t correspond to staff ideas of importanceIs not about our professional valuesDoing wrong things well does not create value
  • #39 Mobile technology is the needle, and social networks are the thread (materials being woven)
  • #41 Douglas Badenoch et al
  • #42 Robert Taylor
  • #44 http://matthew.reidsrow.com/As a result Discovery happens elsewhere
  • #47 Libraries are so screwedValue of the local collections is being diminished
  • #48 Hope College Library
  • #49 A large local inventory was a hallmark of academic reputationWe no longer live in that world.
  • #51 Photo Flickr.com401K College
  • #52 Flickr Timtom.ch Trinity College Library
  • #53 Two different people receive different value when using the same item
  • #54 Similar to Robert Orr’s Input-Process-Output-Outcomes modelImpact of any one characteristic of the University environment is clearly, at best, indirectInput are the entering student characteristicsOutput are the graduating student characteristicsSimilar to Orr’s Input, Process, Output, Process model
  • #55 Richard Shavelson. Measuring College Learning Responsibility: Accountability in a New Era. Stanford, CA: Stanford University Press, 2010, pg 13
  • #56 Jon Hufford Can the Library Contribute to the Campus Culture of Learning 2013Library must contribute to the parent institution’s mission and goals
  • #60 Libraries building communities – 75% of users and nonusers agreed that the library is a good place for facilitating social interaction
  • #61 Personal Perspectives
  • #62 TefkoSaracevic and Paul Kantor
  • #63 Gates Foundation
  • #64 Organizational Perspective
  • #65 NSSE results
  • #66 Pascarella, Seifert, and Blaich. How Effective are the NSSE Benchmarks in Predicting Important Educational Outcomes? Change, January 2010.NSSE data is reliable yet there are still concerns about use of the data
  • #67 N=380,000 NSSE dataGeorge Kuh and Robert Gonyea. The Role of the Academic Library in Promoting Student Engagement in Leaning. College & Research Libraries, July 2003, 256-282.
  • #68 The Halo EffectGary Pike – The Constant Error of the Halo – For freshmen – halo error accounts for half of the explained varianceFor seniors – one quarter to one half of the explained varianceSelf-reported gains in student achievement and college experiencesPhil Rosenzweig – The Halo Effect – Jim Collins Good to Great
  • #70 Richard Arum and JosipaRoksa. Academically Adrift: Limited Learning on College Campuses. Chicago: University of Chicago Press, 2011.Almost half (45%) showed no improvement – using CLA before and after data – after 2 years35% showed no improvement over 4 yearsLiberal arts majors do better than other majorsTo gauge summative performance authentically, the CLA presents realistic problems that require students to analyze complex materials and determine the relevance to the task and credibility.  Students' written responses to the tasks are evaluated to assess their abilities to think critically, reason analytically, solve problems and communicate clearly and cogently.  Scores are aggregated to the institutional level to provide a signal to the institution about how their students as a whole are performing. Whether CLA actually measures what it says it measures is another matter
  • #71 Pascarella et al. How Robust Are the Findings of Academically Adrift? Change, May-June 2011CAAP - Collegiate Assessment of Academic Proficiency
  • #73 Sept 2010
  • #74 Megan’s categories – all her suggestions rely on indirect measures or surrogates
  • #75 Google backtoschool_XS.jpgusd261.com
  • #76 ACRL Value Report possible surrogate measuresChoice of college (from the students perspective) has a big impact on how long it takes to graduate with a BA, on being accepted into a high quality grad schoolAs well as amount of income over your lifetime. Private vs publicOne study – Gary Reynolds. The Impact of Facilities on Recruitment & Retention of Students. New Directions for Institutional Research, 135, Fall 2007.– showed that the library was the 2nd or 3rd most important reason why a university was selectedPartnering with Student Affairs – campus tour offices – Connecting with parentsMore recently, Lombard The Role of the Academic Library in College Choice. The Journal of Academic Librarianship, July 2012, 237-41.62% lib. no factor, & another 29% the lib. Was only a minor factor. 9% either an important factor or deciding factor
  • #77 Google C09LRN1.jpgcsuchico.edu
  • #78 ACRL Value Report possible surrogate measures
  • #79 Acculturation – learning how to function (and succeed) in their new environmentTechnology & bureaucracy are the biggest problems
  • #80 So assessment of student learning is difficult So too is the assessment of the library’s contribution to student learning
  • #81 Google 123RF Portrait of happy young people sitting in pub, drinking beer, looking at camera, smiling.
  • #82 Standardized test – Collegiate Assessment of Academic Proficiency (CAAP)Measure of Academic Proficiency and Progress (MAPP)the Collegiate Leaning Assessment (CLA) test has three components:Make an argumentCritique an argumentPerformance task – prepare a briefing reportEssays are scored using a rubricThe institution is the primary unit of analysis
  • #83 Derek Rodriquez – PhD uses rubrics to assess the impact of student capstone projects
  • #85 De Jager 2002, Zhong & Alexander 2007, Julien & Boon 2004, Wong & Webb 2011Jim Self 1987 no correlation between use of reserve collections and gradesLibrary-related interactions – Dickensen 2006Behaviors – Poll 2003, Poll & Payner 2006
  • #86 Good newsUK Library Impact Data Project
  • #87 UK Library Impact Data Project
  • #88 Book borrowing by students at Huddersfield University in the UK
  • #89 University of WollongongData into the Library Cube – R squared = .91The Library Cube provides the information needed to support continuous improvement in three areas: collection development; academic relationships; and marketing.The Library has seen a positive correlation between borrowing activity and academic performance
  • #90 Univ of Wollongong Aus School of CommerceAs use of library increases, grades go up
  • #91 Reported in College & Research Libraries
  • #92 Small study but interesting results
  • #93 Regression Analysis -
  • #94 led to $59 million expansion
  • #98 Megan Oakleaf – RAILS Project
  • #99 Melissa Bowles-Terry. Library Instruction and Academic Success: A Mixed-Methods Assessment of a Library Instruction Program. Evidence Based Library and Information Practice, 7(1), 2012.
  • #100 6,300 students in the sample ICT skills 2007
  • #101 Hong King Baptist University – Wong and Cmor CR&L Sept 2011
  • #102 Wong Chan and Chu. JAL, July 2006More recently,Reinsfelder. Citation Analysis as a Tool to Measure the Impact of Individual Research Consultants. C&RL, May 2012, 263-277. Found that as number of sources improved, the grade improved yet other research found either no correlations or negative correlations.
  • #103 Kuh & Gonyea. The role of the academic library in promoting student engagement in learning.College & Research Libraries, 64 (7), July 2003, 256-82.300,000 student respondents – NSSE data
  • #105 Many confusing terms to describe the same thingRetention rates range from 60 to 80%Do you know the retention rate for your university?
  • #106 ACRL Value Report surrogate measures
  • #107 In the 2005 book “College Student Retention” edited by Alan Seidman, Linda Hagedornhas a great chapter that explains the differences between various student retention concepts
  • #108 Defined by US National Center for Education Statistics  institutionsretain; individualspersistPersistence: from entry to graduation? From first to second year?Completion: from entry to grad? What about student goals upon entering?Graduation rates: time period? What about transfers? Can only really belong to one institution – so transfer school X captures the student in their graduation rates; beginning school Y calls the student a non-persister or a dropoutAttrition: leaving the system? Leaving the institution?So just a few more things to think about when you are exploring the student retention literature.
  • #109 Retention and drop out rates are NOT dichotomous – students might leave during one time period, but then come backStopout; Drop out; TransferVoluntary / Involuntary – how is this (IS this?) accounted for in student retention stats?Non-persistence is not always a bad thing. Retention theorist Alexander Astin believes student GOALS coming in, and INTENTIONS are most significant. (e.g. did that student only intend to pick up one language course at the community college? Did that student travelling far from home only intend to spend one year at the institution for the experience before transferring to a more affordable institution?
  • #111 On-campus undergraduate students
  • #112 On-campus undergraduate students
  • #113 Carroll et al – graduate distant education student Retention Model
  • #114 Develop a personal connection with the university – especially in the first yearGlasgow Caledonia Univ – highest retention and fastest progression rates among students who have high use of eResources Crawford et al 2004Social integration, academic integrationTemple University – Reasons to drop outLost financial aid/change in financial situation reason for dropping outAlternative textbook project – eBooks
  • #115 Association for the Study of Higher Ed (ASHE) report
  • #116 2008 AUSSE data – more you use the library more likely to NOT consider leavingDeparture intention“How libraries and librarians can support student engagement”
  • #117 Curtin University – sample of 4,461 students66% had NOT borrowed an item were more likely to withdrawThose that HAD accessed eResources were more likely to remain in schoolStudents with low SES DO use computer workstations in the library
  • #118 Early warning system! In the UK Compare Current vs Dropout
  • #120 Engagement is particularly important for the first-year student
  • #121 Why – data is easily accessibleJane E Hiscock, 1986Long Island UniversityLibrary Expenditures increased retentionHamrick, Schuh, and Shelley, 2004Iowa State University Predicting graduation rates based on resource allocation and other institutional characteristics.Found library expenditures (not counting materials) significantly related to graduation ratesCAUSAL RELATIONSHIP: very difficult to prove!! Focus instead on showing statistically significant differences.Mezick, 2007Long Island University (Brookville, NY)Analyze relationships to both library expenditures and number of professional library staff to student persistence. Strongest relationships:Library expenditures (overall) and retention at undergraduate institutionsLibrary professional staff and retention at doctoral institutions
  • #123 Lloyd A. Kramer & Martha B. Kramer, 1968California State Polytechnic CollegeStatistically significant correlation between library use (in terms of book borrowing) and persistence from 1st to 2nd year<CLICK>Patricia B. Knapp, 1966Monteith College (Wayne State University, MI)Students involved in library skills program showed lower attrition, higher grades
  • #126 Large body of work that supports the idea that campus jobs generally promote persistence – Astin, TerenziniStanley Wilder, 1990; Darla Rushing & Deborah Poole, 2002Louisiana State University & Loyola University, New OrleansRelationship between employment in the library and student completionWill Weston San Diego State Univ 2010
  • #127 The problem however is that almost all studies make the library the focus of the investigation and not student retention (and student success)
  • #128 NSSE - Students tend to over-report their experiences and their skills
  • #130 ACRL Value Report surrogate measures
  • #131 What is the impact of the library on the faculty?Flickr AKMA Seabury Faculty
  • #134 Nitecki and Abels
  • #135 Creaser & Spezi. Working Together: Evolving value for academic libraries. June 2012.
  • #136 Tenopir and Valentine 2012Back files are important
  • #137 Time spent reading represents an exchange value – about 25 days per yearCarol Tenopir ALA Midwinter 2012
  • #138 Ithaka plus Cluff & Murrah 1987 JALFlickr Ben Heine We All Disappear Someday
  • #139 ACRL Value Report surrogate measures
  • #142 Creaser & Spezi. Working Together: Evolving value for academic libraries. June 2012.For researchers - Help with lit searching – huge opportunity
  • #143 Jason Priem – Univ of North Carolina – Chapel Hill Altmetrics– use social media
  • #145 US News & World ReportStudents from better schools get into better graduate schoolsWeiner JAL Jan 2009 Total library expenditure is related to US News Peer Assessment ScoresBudgets down from 3.7% to 2.5% over 10 years
  • #146 AustraliaLibrary provides access to information resources that are:
  • #147 Stephen Towne#1 – Relational capital – reputation and reach of the library beyond the organizational walls# 2 – Library Capital Tangible assets – collections, services, facilities Intangible assets Meta-assets – catalogs, discovery tools, finding aids Organizational capital – corporate knowledge Human capital - narrative in annuals reports where staff competence and value is celebrated# 3 – Library Virtue Contribution to research, learning, employability, professional and vocational intent, other common goods# 4 – Lib Momentum – prepare for a different future Capital assets developed early, capital saved or gained Facilitation of research capital Facilitation of learning capital Facilitation of quality Capital saved by sustainability
  • #148 Work together to …
  • #149 Outsell report 2007Avg time saved per interaction – 9.5 hours (35% of all library interactions)Money saved – projects + centralized purchasing to reduce duplication – Avg $3,000 per interaction (20% of lib interactions) Revenue generated - $7,000 per interaction (19% of all lib interactions)Decisions supported – 68% of the respondentsConfidentiality – in-house serviceLibrary as a revenue generatorContribution to decision makingImproved productivityImproving qualityFacilitating communication (honest broker)Role in risk managementTimeliness of information
  • #150 Frank Portugal. Valuing Information Intangibles. Washington, DC: Special Libraries Association, 2000.Knowledge-Value Add – helps managers create value. Uses a surrogate measure for intangible value to determine how a sub-process contributes to the final product or service (time required to learn a sub-process, number of words needed to describe a sub-process). Value is determined by assessing the cost of each sub-process.Intranet Team Forums – The use of forum and chat software – track how information evolves into knowledge and gets incorporated in products and services. Estimate information and knowledge costs and compare to expected revenues (cost savings). Identify library’s contribution.Intellectual Capital Valuation – Measures are developed for four areas:Customer FocusProcess FocusRenewal & Development FocusHuman Focus
  • #151 The Value of Corporate Libraries
  • #153 Public Library Assets
  • #156 US Impact Study – 50,000 surveys – used by nearly half of all visitors who come to use technology – a sought after service
  • #157 Urban Libraries Council. Making Cities Stronger: Public Library Contributions to Local Economic Development, 2007.
  • #159 Australian project
  • #162 Top 5 OutcomesAverage time less than 30 minutes. Attracted by the collections.
  • #163 Top 5 Contributions2008. Average time less than 30 minutes. Attracted by the collections and services.
  • #164 Urban Libraries Council 2006represent a step towards a more ethnography based approach to measuring the value of public libraries and digital services.
  • #165 Scotland<CLICK>
  • #166 6 point scale 1 = inadequate, 6 = excellentEthos & values = high quality services to allLeadership – innovative & entrepreneurial
  • #167 List your take aways
  • #168 LC – for insurance purposes
  • #171 85% of US population HS grads; 50+% some college1980 data AA = 6%; College degree = 19% no degree – 75%2010 data AA = 8%, College degree – 19%,