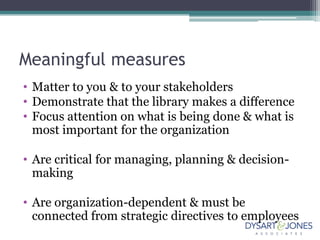
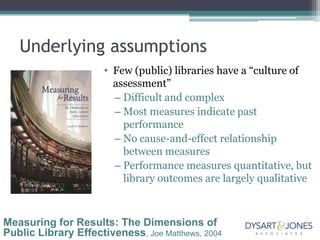
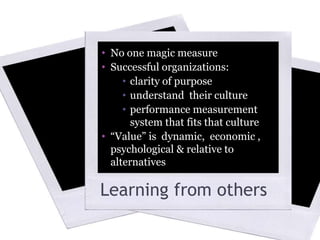
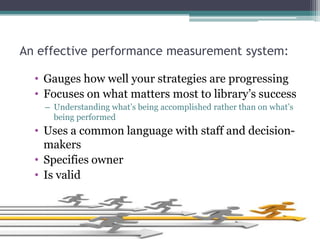
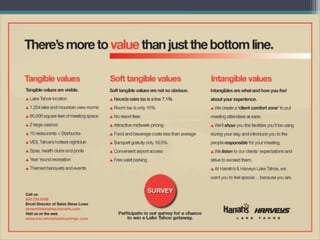
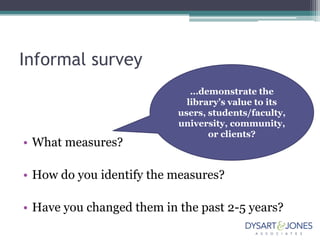
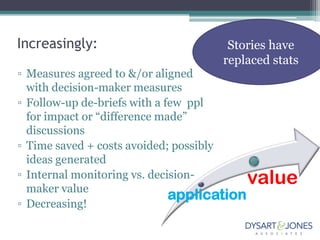
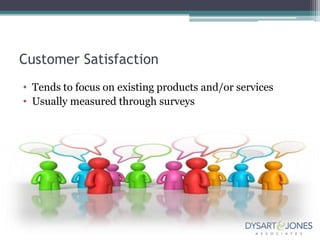
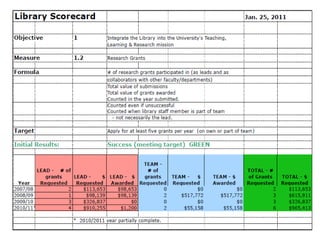
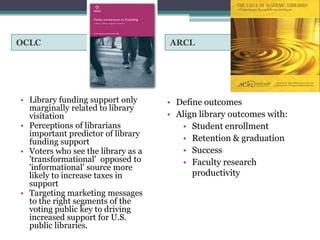
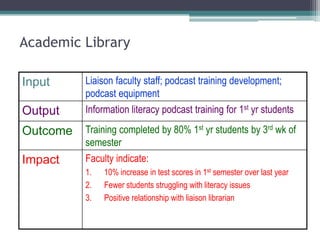
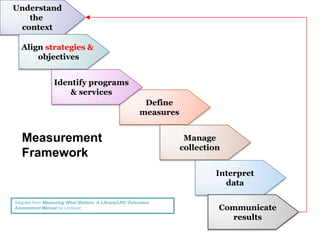
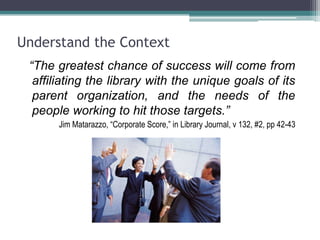
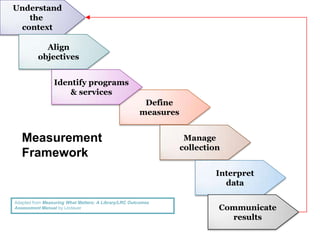
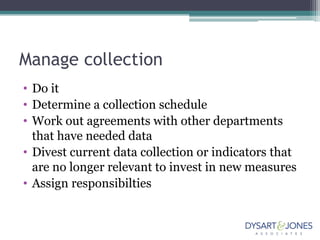
Performance MeasuresIllustrating Value to Your CommunityRebecca Jones, MLSrebecca@dysartjones.com905.731.5836www.dysartjones.com
Can we talk?How’s your value measuring up?Attribution: Michiel1972 at nl.wikipedia
Meaningful measuresMatter to you & to your stakeholders
Demonstrate that the library makes a difference
Focus attention on what is being done & what is most important for the organization
Are critical for managing, planning & decision-making
Are organization-dependent & must be connected from strategic directives to employees  Underlying assumptionsFew (public) libraries have a “culture of assessment”
Difficult and complex
Most measures indicate past performance
No cause-and-effect relationship between measures
Performance measures quantitative, but library outcomes are largely qualitativeMeasuring for Results: The Dimensions of Public Library Effectiveness, Joe Matthews, 2004
Underlying assumptionsIdentifying & illustrating value depends on conversations
The first conversation shouldn’t be when measures are presented
“More” isn’t necessarily better
In fact, “more” clouds the issue and the message
There are two types of measuresoperational & management purposesStrategic & stakeholder purposes
Measures   Are, by definition, based on a “beginning” or monitors results against an agreed-to objective or value
Questions driving measuresWhat’s the library doing?
How much is it doing?
How well is it doing it?
Who is it doing it for?The real questionWhat difference did the library make?
No one magic measure
Successful organizations:
clarity of purpose
understand  their culture
performance measurement system that fits that culture
“Value” is  dynamic,  economic , psychological & relative to alternativesLearning from others
An effective performance measurement system:Gauges how well your strategies are progressing
Focuses on what matters most to library’s success
Understanding what’s being accomplished rather than on what’s being performed
Uses a common language with staff and decision-makers
Specifies owner
Is valid
Informal survey…demonstrate the library’s value to its users, students/faculty, university, community, or clients?What measures?  How do you identify the measures? Have you changed them in the past 2-5 years?
Stories have replaced statsIncreasingly:Measures agreed to &/or aligned with decision-maker measuresFollow-up de-briefs with a few  ppl for impact or “difference made” discussionsTime saved + costs avoided; possibly ideas generatedInternal monitoring vs. decision-maker valueDecreasing!
We need to measure new things in new waysStories of ImpacteatStatisticsfor breakfast
Usage Statistics
Customer SatisfactionTends to focus on existing products and/or services
Usually measured through surveysBalanced ScorecardCustomer PerspectiveHow do we look to our clients?Goals      MeasuresInnovation PerspectiveHow can we improve & create value?Goals      MeasuresInternal PerspectiveWhat must we excel at?Goals      MeasuresFinancial PerspectiveHow do we look to our funders or stakeholders?Goals      MeasuresKaplan & Norton
Benefits of Scorecard“…a clear understanding of what drives value within your area and what doesn’t………….……..greater insight into senior management’s strategic plans…….and a better knowledge not only of the strategic role you play within the organization but how you can enhance that role and sit at the decision-making table”Joseph DeFeo, Measuring What Matters.Industrial Management, v.42,n.3, May 2000
ARL’s Balanced Scorecard ProjectCollaborative project with Ascendant Strategy Management GroupParticipating libraries: Johns Hopkins UniversityMcMaster University,University of VirginiaUniversity of Washington. To assist, train, and facilitate use in a small number of ARL librariesTest the value of a collaborative model for learning about and implementing the new tool.
User PerspectiveHow well is the library meeting the needs of our users? Internal Process PerspectiveHow do the library's internal processes function to efficiently deliver library collections and services? Finance PerspectiveHow well are the library's finances managed to achieve our mission? Learning/Growth PerspectiveHow well is the library positioned to ensure that goals are met in the future?
OCLCARCLLibrary funding support only marginally related to library visitation Perceptions of librarians important predictor of library funding support Voters who see the library as a 'transformational'  opposed to 'informational' source more likely to increase taxes in support Targeting marketing messages to the right segments of the voting public key to driving increased support for U.S. public libraries. Define outcomes
Align library outcomes with:
Student enrollment
Retention & graduation
Success
Faculty research productivity  “…less than 1% of the state budget, yet libraries serve 57% of the state’s population (10.6 million library card holders), or 75% of households in New York”Starting with Glen Holt & Charles McClure’s work on public library ROI the figures consistently range from $1:$4 -$1:$6
Return on InvestmentCalculation comparing the cost data (budget, user time spent, other direct costs, etc.) with the financial benefits (user time saved, savings in consolidated buying, etc.)
When the financial benefits outweigh the costs, a positive ROI is demonstrated.Cost-Benefit AnalysisStresses the benefits associated with an activityDeveloping the cost data relatively straightforward….developing a benefit value difficult but certainly not impossibleMost frequently focuses on time or money saved for the user, or opportunities pursuedGlen Holt; Dr. Charles McClure

CIL 2011 Performance Measures: Illustrating Value to Your Community for web

  • 1.
    Performance MeasuresIllustrating Valueto Your CommunityRebecca Jones, MLSrebecca@dysartjones.com905.731.5836www.dysartjones.com
  • 2.
    Can we talk?How’syour value measuring up?Attribution: Michiel1972 at nl.wikipedia
  • 3.
    Meaningful measuresMatter toyou & to your stakeholders
  • 4.
    Demonstrate that thelibrary makes a difference
  • 5.
    Focus attention onwhat is being done & what is most important for the organization
  • 6.
    Are critical formanaging, planning & decision-making
  • 7.
    Are organization-dependent &must be connected from strategic directives to employees Underlying assumptionsFew (public) libraries have a “culture of assessment”
  • 8.
  • 9.
    Most measures indicatepast performance
  • 10.
  • 11.
    Performance measures quantitative,but library outcomes are largely qualitativeMeasuring for Results: The Dimensions of Public Library Effectiveness, Joe Matthews, 2004
  • 12.
    Underlying assumptionsIdentifying &illustrating value depends on conversations
  • 13.
    The first conversationshouldn’t be when measures are presented
  • 14.
  • 15.
    In fact, “more”clouds the issue and the message
  • 16.
    There are twotypes of measuresoperational & management purposesStrategic & stakeholder purposes
  • 17.
    Measures Are, by definition, based on a “beginning” or monitors results against an agreed-to objective or value
  • 18.
  • 19.
    How much isit doing?
  • 20.
    How well isit doing it?
  • 21.
    Who is itdoing it for?The real questionWhat difference did the library make?
  • 22.
  • 23.
  • 24.
  • 25.
  • 26.
    performance measurement systemthat fits that culture
  • 27.
    “Value” is dynamic, economic , psychological & relative to alternativesLearning from others
  • 28.
    An effective performancemeasurement system:Gauges how well your strategies are progressing
  • 29.
    Focuses on whatmatters most to library’s success
  • 30.
    Understanding what’s beingaccomplished rather than on what’s being performed
  • 31.
    Uses a commonlanguage with staff and decision-makers
  • 32.
  • 33.
  • 34.
    Informal survey…demonstrate thelibrary’s value to its users, students/faculty, university, community, or clients?What measures? How do you identify the measures? Have you changed them in the past 2-5 years?
  • 36.
    Stories have replacedstatsIncreasingly:Measures agreed to &/or aligned with decision-maker measuresFollow-up de-briefs with a few ppl for impact or “difference made” discussionsTime saved + costs avoided; possibly ideas generatedInternal monitoring vs. decision-maker valueDecreasing!
  • 37.
    We need tomeasure new things in new waysStories of ImpacteatStatisticsfor breakfast
  • 38.
  • 39.
    Customer SatisfactionTends tofocus on existing products and/or services
  • 40.
    Usually measured throughsurveysBalanced ScorecardCustomer PerspectiveHow do we look to our clients?Goals MeasuresInnovation PerspectiveHow can we improve & create value?Goals MeasuresInternal PerspectiveWhat must we excel at?Goals MeasuresFinancial PerspectiveHow do we look to our funders or stakeholders?Goals MeasuresKaplan & Norton
  • 41.
    Benefits of Scorecard“…aclear understanding of what drives value within your area and what doesn’t………….……..greater insight into senior management’s strategic plans…….and a better knowledge not only of the strategic role you play within the organization but how you can enhance that role and sit at the decision-making table”Joseph DeFeo, Measuring What Matters.Industrial Management, v.42,n.3, May 2000
  • 42.
    ARL’s Balanced ScorecardProjectCollaborative project with Ascendant Strategy Management GroupParticipating libraries: Johns Hopkins UniversityMcMaster University,University of VirginiaUniversity of Washington. To assist, train, and facilitate use in a small number of ARL librariesTest the value of a collaborative model for learning about and implementing the new tool.
  • 43.
    User PerspectiveHow wellis the library meeting the needs of our users? Internal Process PerspectiveHow do the library's internal processes function to efficiently deliver library collections and services? Finance PerspectiveHow well are the library's finances managed to achieve our mission? Learning/Growth PerspectiveHow well is the library positioned to ensure that goals are met in the future?
  • 46.
    OCLCARCLLibrary funding supportonly marginally related to library visitation Perceptions of librarians important predictor of library funding support Voters who see the library as a 'transformational' opposed to 'informational' source more likely to increase taxes in support Targeting marketing messages to the right segments of the voting public key to driving increased support for U.S. public libraries. Define outcomes
  • 47.
  • 48.
  • 49.
  • 50.
  • 51.
    Faculty research productivity “…less than 1% of the state budget, yet libraries serve 57% of the state’s population (10.6 million library card holders), or 75% of households in New York”Starting with Glen Holt & Charles McClure’s work on public library ROI the figures consistently range from $1:$4 -$1:$6
  • 52.
    Return on InvestmentCalculationcomparing the cost data (budget, user time spent, other direct costs, etc.) with the financial benefits (user time saved, savings in consolidated buying, etc.)
  • 53.
    When the financialbenefits outweigh the costs, a positive ROI is demonstrated.Cost-Benefit AnalysisStresses the benefits associated with an activityDeveloping the cost data relatively straightforward….developing a benefit value difficult but certainly not impossibleMost frequently focuses on time or money saved for the user, or opportunities pursuedGlen Holt; Dr. Charles McClure

Editor's Notes

  • #6 Ulla’s book
  • #8 Press the easy button
  • #15 I’m factoring into this what Jane & I see & hear from clients- A few with more impact
  • #19 Aligns measures with strategies to track progress, reinforce accountability and prioritize improvement opportunitiesA “system” of measures based on 4 perspectives:customer internalfinancialInnovationLimits measures to those most criticalIn the past, libraries focused on the internal process perspective (cost, time, quality) to measure their activities and services and implement change. Yet, a big shift from the internal process perspective measurements to the customer perspective measurements (how much the customer is satisfied by the service) was noticed in the last two decades. However, the implementation of the balanced scorecard in libraries did not occur until the early 21st century where many libraries, NGO’s, and governmental agencies took the initiative in applying BSC in their institutions. One successful experience took place at the University of Virginia library that developed a plan to implement the balanced scorecard in 2001.
  • #21 McMaster is one of four libraries in North America participating in the Association of Research Libraries’ (ARL) Library Scorecard Pilot, based on the Balanced Scorecard framework created by Harvard business professors Robert S. Kaplan and David P. Norton. The Scorecard allows us to examine our current and future performance based on four balanced perspectives (the user, staff learning and growth, internal processes and financial health). We have identified 10 objectives, each of which corresponds directly to one of the 4 perspectives above. The objectives are also linked to one of 25 measures, some, standardized tools that can be benchmarked against other libraries (e.g. LIBQUAL results), others, in-house instruments designed to capture aspects unique to our local environment.We have set targets for each measure and have scored ourselves as green (meeting the target), yellow (approaching the target, but not there yet), or red (not meeting the target).  To view our progress, please visit:  library.mcmaster.ca/library-scorecard.
  • #25 OCLC was awarded a grant from the Bill and Melinda Gates Foundation to explore attitudes and perceptions about library funding and to evaluate the potential of a large-scale marketing and advocacy campaign to increase public library funding in the U.S. The findings of this research are now available in the OCLC report, From Awareness to Funding: A study of library support in America. Though this study was based on data from the United States, there are findings in the report that could be applicable to any library seeking to understand the connections between public perceptions and library supportARCL – very first recommendation:Define outcomes
  • #29 The Economic Value ofThe Free LibraryIn PhiladelphiaOctober 21, 2010Fels Research & ConsultingUniversity of Pennsylvania, Fels Institute of GovernmentDeborah Diamond, Ph.D., Senior ConsultantKevin C. Gillen, Ph.D., Research FellowUniversity of Pennsylvania, Institute for Urban ResearchMarissa Litman, AssociateDavid Thornburgh, Executive DirectorA traditional economic impact/economic value assessment of the Library was part of the answer to this question. However, in order to really answer the question “what’s the Library worth,” the team at Fels looked at the Library’s value in relation to the experiences that people have with the Library and the reasons they use it. In other words, the “value” question has to be answered in the context of Library usage. What’s the value of the Library to job seekers? To business owners? To parents of school children? Measuring the value of the Library in the context of the Library’s mission and the ways it adds value to people’s lives was intended to make the economic impact and value story easier to understand and more meaningful. Using circulation data, in-depth customer interviews, online and hard copy surveys, and field research, the team at Fels assessed the Library in four areas: Literacy, Workforce Development, Business Development, and Value to Homes and Neighborhoods. Their findings, detailed in the PDF of the study below, show that the Free Library provided millions of dollars in economic impact to the City of Philadelphia in FY 2010.Literacy, Workforce Development, BusinessDevelopment, and Value to Homes and Neighborhoods.Literacy The economic value of the Library services that help Philadelphians learn to read andacquire working skills totals $21.8 million for FY10, comprised of:◦ $18.4 million in literacy-related reading & lending◦ $2.6 million in literacy related programming◦ $818,000 in literacy-related online activities 10% of survey respondents report “ I couldn’t have learned to read without thelibrary,” meaning an estimated 10,788 people attribute their ability to read to the FreeLibrary. 13% of survey respondents report they taught someone else to read and could nothave done it without the Free Library, meaning 14,024 people attribute their beingable to teach someone to read to the Library.Workforce Development The economic value of the Library services that help Philadelphians locate jobopportunities and develop career skills totals $6 million for FY10, comprised of:◦ $2.2 million in career development book-reading & lending◦ $2.1 million in job-finding online activities, including workforce database usageand online job searching/prep◦ $1.7 million job-readiness and workforce-related programming Fels estimates that 979 Philadelphians found jobs directly as a result of the resourcesprovided by the Library in FY10.◦ 979 entry-level jobs translates into $30.4 million in earned income in one year(at an average entry-level salary for Philadelphia), generating $1.2 millionannually in wage tax revenue for the cityBusiness Development The economic value of the Library services that help Philadelphians develop orenhance their own businesses totals $3.8 million for FY10, comprised of: $2.9 million in business development online and database activities $819,285 in business development book-reading & lending $55,385 in business development programming 8% of survey respondents report that they could not have started, grown or improved theirbusiness without the Free Library, resulting in an estimated 8,630 businesses that benefitedfrom Free Library business development services.Fels Institute of Government, University of PennsylvaniaFels Research & ConsultingThe Economic Value of the Free Library in Philadelphia
  • #54 U of VirginiaJim Self, the director of management information services at the University of Virginia library, stated that the balanced scorecard helped librarians to better control statistical operations by limiting the number of metrics between four and eight per perspective. Also, two targets for each metric were defined to measure achievements. Self believed that the “intelligibility” of the balanced scorecard allowed the library to assess its yearly performance by looking at the overall performance pie chart and by comparing charts of different perspectives in order to understand how well the library is doing and locate places that need improvements.1. The first step is in examining the library’s mission statement and reformulating it, if required, to make it as clear and simple as possible. The mission statement should be at the center of the balanced scorecard project. Then, a plan of work, relating the mission statement to the four perspectives of the BSC, should be drafted. Librarians must ask for example: what kind of financial changes do we need to realize the goal stated in the mission statement? Or what are the internal changes needed to increase staff performance? These questions will help defining the performance metrics for each perspective to be used for measuring the actual performance of the library.2. The balanced scorecard project manager presents the performance metrics to all people involved in the project by organizing meetings with the public and the library managers. The objectives of these meetings are to create awareness of the goals of the BSC project and to gain support from people involved in the process.3. The BSC project manager chooses a reasonable number of metrics for each perspective (3 to 6 metrics), ensures that the chosen metrics are measurable, and defines one or more targets for each metric. Different methods can be used to gather the data.4. The performance metrics will be used to measure the performance of the library from different perspectives and stimulate employees and managers to think how the library should react in light of the gathered data, and the results must improve performance in the future.5. The last step is to disseminate the findings to the concerned people including employees, managers, community, and funders. The distribution of the results has both internal and external values. It gives employees a clear idea about their actual performance and what it should be done to improve performance in the future. In addition, sharing the results with the public raises awareness of the library’s future services and plans within the community. In addition, the results will provide funders with exact figures on how the funds are used by the library and their effects on users.