Download to read offline

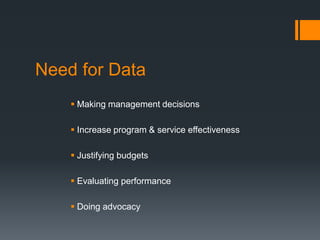
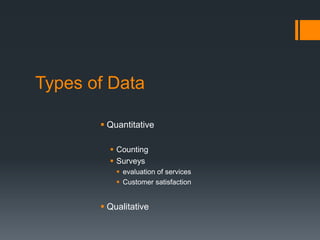


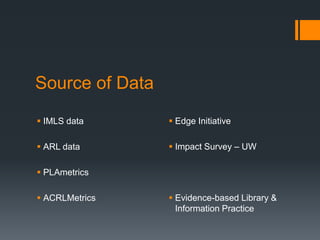
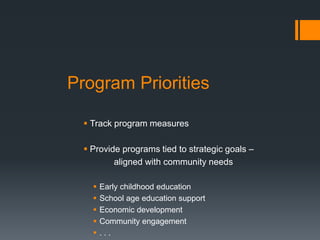
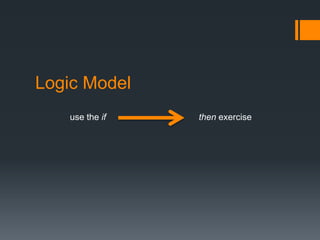
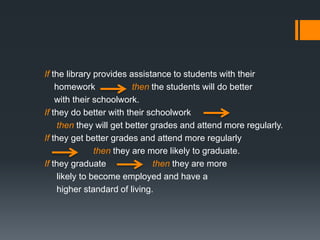
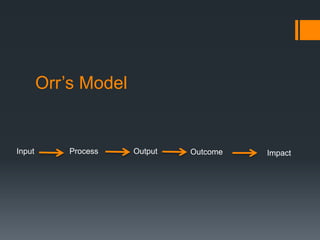
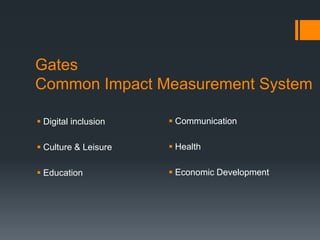

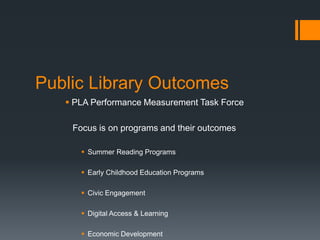

The document discusses the importance of data collection and analysis in libraries to enhance decision-making, improve service effectiveness, justify budgets, and measure performance. It outlines different types of data and perspectives from both users and libraries on satisfaction, responsiveness, and value, emphasizing the need for evidence-based practices. Additionally, it highlights the necessity of defining relevant outcomes to demonstrate the library's value in the community, using logical models to track impact and align programs with strategic goals.


![ONFH[AVN HIP] -TRIPLE REGIME -A NOVAL SURGICAL CONCEPT .pptx](https://cdn.slidesharecdn.com/ss_thumbnails/onfhavnhip2026koaconcalicutdrgokuldevdrmashraf-260210064517-213ec005-thumbnail.jpg?width=640&height=640&fit=bounds)