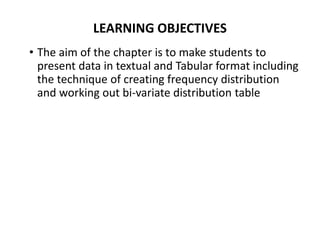
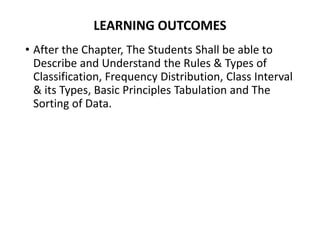
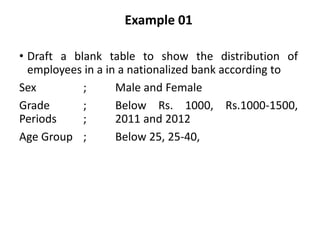
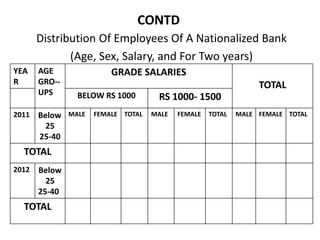
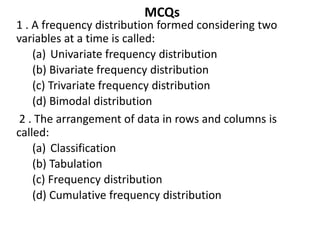
SlideShare a Scribd company logo
PROGRAMME B.COM
SUBJECT
QUANTITATIVE TECHNIQUE – I
SEMESTER III
UNIVERSITY VIJAYANAGAR SRI
KRISHNADEVARAYA UNIVERSITY,
BALLARI
SESSION 16
RECAP
• Tabulation of Data, Meaning, Objectives & Rules for
Tabulation
LEARNING OBJECTIVES
• The aim of the chapter is to make students to
present data in textual and Tabular format including
the technique of creating frequency distribution
and working out bi-variate distribution table
LEARNING OUTCOMES
• After the Chapter, The Students Shall be able to
Describe and Understand the Rules & Types of
Classification, Frequency Distribution, Class Interval
& its Types, Basic Principles Tabulation and The
Sorting of Data.
SESSION - 16
• Types of Tables, Preparation of Blank Table and
Problems - 01
Types of Tables
• Statistical tables can be classified under two general
categories, namely, general tables and summary
tables.
General tables contain a collection of detailed
information including all that is relevant to the
subject or theme.
Summary tables are designed to serve some
specific purposes. They are smaller in size than
general tables, emphasize on some aspect of data
and are generally incorporated within the text.
CONTD
• The statistical tables may further be classified into two
broad classes namely simple tables and complex
tables.
 A simple table summarizes information on a
single characteristic and is also called a univariate
table.
 A complex table summarizes the complicated
information and presents them into two or more
interrelated categories.
Preparation of Blank Table
FORMAT OF TABLE
TITLE HEAD NOTE
Footnote Table Number Source
STUB HEADING CAPTION
COLUMN HEADING / COLUMN HEADING
SUB
ENTRIES
BODY
Example 01
• Draft a blank table to show the distribution of
employees in a in a nationalized bank according to
Sex ; Male and Female
Grade ; Below Rs. 1000, Rs.1000-1500,
Periods ; 2011 and 2012
Age Group ; Below 25, 25-40,
CONTD
Distribution Of Employees Of A Nationalized Bank
(Age, Sex, Salary, and For Two years)
YEA
R
AGE
GRO--
UPS
GRADE SALARIES
TOTAL
BELOW RS 1000 RS 1000- 1500
2011 Below
25
25-40
MALE FEMALE TOTAL MALE FEMALE TOTAL MALE FEMALE TOTAL
TOTAL
2012 Below
25
25-40
TOTAL
SUMMARY
As we already discussed and learnt today on
Classifications and Tabulation as below
• Types of Tables, Preparation of Blank Table and
Problems 01
MCQs
1 . A frequency distribution formed considering two
variables at a time is called:
(a) Univariate frequency distribution
(b) Bivariate frequency distribution
(c) Trivariate frequency distribution
(d) Bimodal distribution
2 . The arrangement of data in rows and columns is
called:
(a) Classification
(b) Tabulation
(c) Frequency distribution
(d) Cumulative frequency distribution
MCQs
3 . When the qualitative or quantitative raw data are
classified according to one characteristic, the
tabulation of different groups is called:
(a) Dichotomy
(b) Manifold-division
(c) Bivariate
(d) One-way
4 . A statistical table consists of at least:
(a) Two parts
(b) Three parts
(c) Four parts
(d) Five parts
MCQs
5 . In a statistical table, prefatory note is shown:
(a) Below the body
(b) Box head `
(c) Foot note
(d) Below the title
CONTD
ANSWERS
1. B
2. B
3. D
4. C
5. D
REFERENCES
• S.P. Gupta, Sultan Chand and Sons Publications, 2017
• S. C. Gupta, Himalaya Publishing House,
Fundamentals of Statistics, 2018
• R.S.N Pillai and Bagavathi, S.Chand publications, 2010
THANK YOU

More Related Content

Similar to Tabulation 2

ANALYSIS OF DATA.pptx
ANALYSIS OF DATA.pptxANALYSIS OF DATA.pptx
ANALYSIS OF DATA.pptx
PRADEEP ABOTHU
 
Classification of data
Classification of dataClassification of data
Classification of data
RekhaChoudhary24
 
Important Quantitative Methods by MBA Classes in Mumbai
Important Quantitative Methods by MBA Classes in MumbaiImportant Quantitative Methods by MBA Classes in Mumbai
Important Quantitative Methods by MBA Classes in Mumbai
seomiamia
 
Quantitative Analysis for Business Decision - Chapter 2
Quantitative Analysis for Business Decision - Chapter 2Quantitative Analysis for Business Decision - Chapter 2
Quantitative Analysis for Business Decision - Chapter 2
kishoressrinivas
 
1.3 data processing
1.3 data processing1.3 data processing
1.3 data processing
LeenaKP
 
Classification of Data
Classification of DataClassification of Data
Classification of Data
AkkiMaruthi
 
Classification Theory
Classification Theory Classification Theory
Classification Theory
AkkiMaruthi2
 
Tabulation and Classification
Tabulation and ClassificationTabulation and Classification
Tabulation and Classification
AkkiMaruthi2
 
frequency distribution table 2
frequency distribution table 2frequency distribution table 2
frequency distribution table 2
AkkiMaruthi2
 
Frequency Distribution Table 2
Frequency Distribution Table 2Frequency Distribution Table 2
Frequency Distribution Table 2
AkkiMaruthi2
 
Organisation of data
Organisation of dataOrganisation of data
Organisation of data
Sonam Omar
 
day1.ppt
day1.pptday1.ppt
day1.ppt
ChemOyasan1
 
Bi variate frequency distribution table 1
Bi variate frequency distribution table 1Bi variate frequency distribution table 1
Bi variate frequency distribution table 1
AkkiMaruthi2
 
Bivariate table 1
Bivariate table 1Bivariate table 1
Bivariate table 1
AkkiMaruthi2
 
MCA_UNIT-3_Computer Oriented Numerical Statistical Methods
MCA_UNIT-3_Computer Oriented Numerical Statistical MethodsMCA_UNIT-3_Computer Oriented Numerical Statistical Methods
MCA_UNIT-3_Computer Oriented Numerical Statistical Methods
Rai University
 
Ch 3 Organisation of Data 1 (1).pptx
Ch 3 Organisation of Data 1 (1).pptxCh 3 Organisation of Data 1 (1).pptx
Ch 3 Organisation of Data 1 (1).pptx
syedmohd9
 
Research methods module 5 msf
Research methods module 5 msfResearch methods module 5 msf
Research methods module 5 msf
Independent
 
Research methods module 5 msf
Research methods module 5 msfResearch methods module 5 msf
Research methods module 5 msf
Independent
 
Processing of data in research
Processing of data in researchProcessing of data in research
Processing of data in research
HazirAli
 
R03 | Basics of Reporting - Report Setup Part 1 (MCUI)
R03 | Basics of Reporting - Report Setup Part 1 (MCUI)R03 | Basics of Reporting - Report Setup Part 1 (MCUI)
R03 | Basics of Reporting - Report Setup Part 1 (MCUI)
Maintenance Connection
 

Similar to Tabulation 2 (20)

ANALYSIS OF DATA.pptx
ANALYSIS OF DATA.pptxANALYSIS OF DATA.pptx
ANALYSIS OF DATA.pptx
 
Classification of data
Classification of dataClassification of data
Classification of data
 
Important Quantitative Methods by MBA Classes in Mumbai
Important Quantitative Methods by MBA Classes in MumbaiImportant Quantitative Methods by MBA Classes in Mumbai
Important Quantitative Methods by MBA Classes in Mumbai
 
Quantitative Analysis for Business Decision - Chapter 2
Quantitative Analysis for Business Decision - Chapter 2Quantitative Analysis for Business Decision - Chapter 2
Quantitative Analysis for Business Decision - Chapter 2
 
1.3 data processing
1.3 data processing1.3 data processing
1.3 data processing
 
Classification of Data
Classification of DataClassification of Data
Classification of Data
 
Classification Theory
Classification Theory Classification Theory
Classification Theory
 
Tabulation and Classification
Tabulation and ClassificationTabulation and Classification
Tabulation and Classification
 
frequency distribution table 2
frequency distribution table 2frequency distribution table 2
frequency distribution table 2
 
Frequency Distribution Table 2
Frequency Distribution Table 2Frequency Distribution Table 2
Frequency Distribution Table 2
 
Organisation of data
Organisation of dataOrganisation of data
Organisation of data
 
day1.ppt
day1.pptday1.ppt
day1.ppt
 
Bi variate frequency distribution table 1
Bi variate frequency distribution table 1Bi variate frequency distribution table 1
Bi variate frequency distribution table 1
 
Bivariate table 1
Bivariate table 1Bivariate table 1
Bivariate table 1
 
MCA_UNIT-3_Computer Oriented Numerical Statistical Methods
MCA_UNIT-3_Computer Oriented Numerical Statistical MethodsMCA_UNIT-3_Computer Oriented Numerical Statistical Methods
MCA_UNIT-3_Computer Oriented Numerical Statistical Methods
 
Ch 3 Organisation of Data 1 (1).pptx
Ch 3 Organisation of Data 1 (1).pptxCh 3 Organisation of Data 1 (1).pptx
Ch 3 Organisation of Data 1 (1).pptx
 
Research methods module 5 msf
Research methods module 5 msfResearch methods module 5 msf
Research methods module 5 msf
 
Research methods module 5 msf
Research methods module 5 msfResearch methods module 5 msf
Research methods module 5 msf
 
Processing of data in research
Processing of data in researchProcessing of data in research
Processing of data in research
 
R03 | Basics of Reporting - Report Setup Part 1 (MCUI)
R03 | Basics of Reporting - Report Setup Part 1 (MCUI)R03 | Basics of Reporting - Report Setup Part 1 (MCUI)
R03 | Basics of Reporting - Report Setup Part 1 (MCUI)
 

More from AkkiMaruthi2

Bi variate Table 2
Bi variate Table 2Bi variate Table 2
Bi variate Table 2
AkkiMaruthi2
 
Frequency Distribution Table 4
Frequency Distribution Table 4Frequency Distribution Table 4
Frequency Distribution Table 4
AkkiMaruthi2
 
Frequency Distribution Table 5
Frequency Distribution Table 5Frequency Distribution Table 5
Frequency Distribution Table 5
AkkiMaruthi2
 
Mean, median & mode 2
Mean, median & mode 2Mean, median & mode 2
Mean, median & mode 2
AkkiMaruthi2
 
KPC skewness 1
KPC skewness 1KPC skewness 1
KPC skewness 1
AkkiMaruthi2
 
mean median mode 3
mean median mode 3mean median mode 3
mean median mode 3
AkkiMaruthi2
 
Mean, median & mode 1
Mean, median & mode 1Mean, median & mode 1
Mean, median & mode 1
AkkiMaruthi2
 
Range, Q.D and Co-efficient 2
Range, Q.D and Co-efficient 2Range, Q.D and Co-efficient 2
Range, Q.D and Co-efficient 2
AkkiMaruthi2
 
graphical representation 1
graphical representation 1graphical representation 1
graphical representation 1
AkkiMaruthi2
 
KPC skewness 2
KPC skewness 2KPC skewness 2
KPC skewness 2
AkkiMaruthi2
 
graphical representation 4
graphical representation 4graphical representation 4
graphical representation 4
AkkiMaruthi2
 
graphical representation 5
graphical representation 5graphical representation 5
graphical representation 5
AkkiMaruthi2
 
graphical representation 2
graphical representation 2graphical representation 2
graphical representation 2
AkkiMaruthi2
 
Measures of Dispersion
Measures of DispersionMeasures of Dispersion
Measures of Dispersion
AkkiMaruthi2
 
Missing frequency 1
Missing frequency 1Missing frequency 1
Missing frequency 1
AkkiMaruthi2
 
diagrams theory
diagrams theorydiagrams theory
diagrams theory
AkkiMaruthi2
 
KPC skewness 2
KPC skewness 2KPC skewness 2
KPC skewness 2
AkkiMaruthi2
 
Diagrams part 2
Diagrams part 2Diagrams part 2
Diagrams part 2
AkkiMaruthi2
 
Mean Deviation and Co- efficient
Mean Deviation and Co- efficientMean Deviation and Co- efficient
Mean Deviation and Co- efficient
AkkiMaruthi2
 
graphical representation 6
graphical representation 6graphical representation 6
graphical representation 6
AkkiMaruthi2
 

More from AkkiMaruthi2 (20)

Bi variate Table 2
Bi variate Table 2Bi variate Table 2
Bi variate Table 2
 
Frequency Distribution Table 4
Frequency Distribution Table 4Frequency Distribution Table 4
Frequency Distribution Table 4
 
Frequency Distribution Table 5
Frequency Distribution Table 5Frequency Distribution Table 5
Frequency Distribution Table 5
 
Mean, median & mode 2
Mean, median & mode 2Mean, median & mode 2
Mean, median & mode 2
 
KPC skewness 1
KPC skewness 1KPC skewness 1
KPC skewness 1
 
mean median mode 3
mean median mode 3mean median mode 3
mean median mode 3
 
Mean, median & mode 1
Mean, median & mode 1Mean, median & mode 1
Mean, median & mode 1
 
Range, Q.D and Co-efficient 2
Range, Q.D and Co-efficient 2Range, Q.D and Co-efficient 2
Range, Q.D and Co-efficient 2
 
graphical representation 1
graphical representation 1graphical representation 1
graphical representation 1
 
KPC skewness 2
KPC skewness 2KPC skewness 2
KPC skewness 2
 
graphical representation 4
graphical representation 4graphical representation 4
graphical representation 4
 
graphical representation 5
graphical representation 5graphical representation 5
graphical representation 5
 
graphical representation 2
graphical representation 2graphical representation 2
graphical representation 2
 
Measures of Dispersion
Measures of DispersionMeasures of Dispersion
Measures of Dispersion
 
Missing frequency 1
Missing frequency 1Missing frequency 1
Missing frequency 1
 
diagrams theory
diagrams theorydiagrams theory
diagrams theory
 
KPC skewness 2
KPC skewness 2KPC skewness 2
KPC skewness 2
 
Diagrams part 2
Diagrams part 2Diagrams part 2
Diagrams part 2
 
Mean Deviation and Co- efficient
Mean Deviation and Co- efficientMean Deviation and Co- efficient
Mean Deviation and Co- efficient
 
graphical representation 6
graphical representation 6graphical representation 6
graphical representation 6
 

Recently uploaded

How to Fix the Import Error in the Odoo 17
How to Fix the Import Error in the Odoo 17How to Fix the Import Error in the Odoo 17
How to Fix the Import Error in the Odoo 17
Celine George
 
LAND USE LAND COVER AND NDVI OF MIRZAPUR DISTRICT, UP
LAND USE LAND COVER AND NDVI OF MIRZAPUR DISTRICT, UPLAND USE LAND COVER AND NDVI OF MIRZAPUR DISTRICT, UP
LAND USE LAND COVER AND NDVI OF MIRZAPUR DISTRICT, UP
RAHUL
 
Liberal Approach to the Study of Indian Politics.pdf
Liberal Approach to the Study of Indian Politics.pdfLiberal Approach to the Study of Indian Politics.pdf
Liberal Approach to the Study of Indian Politics.pdf
WaniBasim
 
spot a liar (Haiqa 146).pptx Technical writhing and presentation skills
spot a liar (Haiqa 146).pptx Technical writhing and presentation skillsspot a liar (Haiqa 146).pptx Technical writhing and presentation skills
spot a liar (Haiqa 146).pptx Technical writhing and presentation skills
haiqairshad
 
UGC NET Exam Paper 1- Unit 1:Teaching Aptitude
UGC NET Exam Paper 1- Unit 1:Teaching AptitudeUGC NET Exam Paper 1- Unit 1:Teaching Aptitude
UGC NET Exam Paper 1- Unit 1:Teaching Aptitude
S. Raj Kumar
 
คำศัพท์ คำพื้นฐานการอ่าน ภาษาอังกฤษ ระดับชั้น ม.1
คำศัพท์ คำพื้นฐานการอ่าน ภาษาอังกฤษ ระดับชั้น ม.1คำศัพท์ คำพื้นฐานการอ่าน ภาษาอังกฤษ ระดับชั้น ม.1
คำศัพท์ คำพื้นฐานการอ่าน ภาษาอังกฤษ ระดับชั้น ม.1
สมใจ จันสุกสี
 
Pollock and Snow "DEIA in the Scholarly Landscape, Session One: Setting Expec...
Pollock and Snow "DEIA in the Scholarly Landscape, Session One: Setting Expec...Pollock and Snow "DEIA in the Scholarly Landscape, Session One: Setting Expec...
Pollock and Snow "DEIA in the Scholarly Landscape, Session One: Setting Expec...
National Information Standards Organization (NISO)
 
Main Java[All of the Base Concepts}.docx
Main Java[All of the Base Concepts}.docxMain Java[All of the Base Concepts}.docx
Main Java[All of the Base Concepts}.docx
adhitya5119
 
Leveraging Generative AI to Drive Nonprofit Innovation
Leveraging Generative AI to Drive Nonprofit InnovationLeveraging Generative AI to Drive Nonprofit Innovation
Leveraging Generative AI to Drive Nonprofit Innovation
TechSoup
 
What is Digital Literacy? A guest blog from Andy McLaughlin, University of Ab...
What is Digital Literacy? A guest blog from Andy McLaughlin, University of Ab...What is Digital Literacy? A guest blog from Andy McLaughlin, University of Ab...
What is Digital Literacy? A guest blog from Andy McLaughlin, University of Ab...
GeorgeMilliken2
 
Reimagining Your Library Space: How to Increase the Vibes in Your Library No ...
Reimagining Your Library Space: How to Increase the Vibes in Your Library No ...Reimagining Your Library Space: How to Increase the Vibes in Your Library No ...
Reimagining Your Library Space: How to Increase the Vibes in Your Library No ...
Diana Rendina
 
Cognitive Development Adolescence Psychology
Cognitive Development Adolescence PsychologyCognitive Development Adolescence Psychology
Cognitive Development Adolescence Psychology
paigestewart1632
 
Advanced Java[Extra Concepts, Not Difficult].docx
Advanced Java[Extra Concepts, Not Difficult].docxAdvanced Java[Extra Concepts, Not Difficult].docx
Advanced Java[Extra Concepts, Not Difficult].docx
adhitya5119
 
ANATOMY AND BIOMECHANICS OF HIP JOINT.pdf
ANATOMY AND BIOMECHANICS OF HIP JOINT.pdfANATOMY AND BIOMECHANICS OF HIP JOINT.pdf
ANATOMY AND BIOMECHANICS OF HIP JOINT.pdf
Priyankaranawat4
 
BÀI TẬP BỔ TRỢ TIẾNG ANH LỚP 9 CẢ NĂM - GLOBAL SUCCESS - NĂM HỌC 2024-2025 - ...
BÀI TẬP BỔ TRỢ TIẾNG ANH LỚP 9 CẢ NĂM - GLOBAL SUCCESS - NĂM HỌC 2024-2025 - ...BÀI TẬP BỔ TRỢ TIẾNG ANH LỚP 9 CẢ NĂM - GLOBAL SUCCESS - NĂM HỌC 2024-2025 - ...
BÀI TẬP BỔ TRỢ TIẾNG ANH LỚP 9 CẢ NĂM - GLOBAL SUCCESS - NĂM HỌC 2024-2025 - ...
Nguyen Thanh Tu Collection
 
BBR 2024 Summer Sessions Interview Training
BBR  2024 Summer Sessions Interview TrainingBBR  2024 Summer Sessions Interview Training
BBR 2024 Summer Sessions Interview Training
Katrina Pritchard
 
Digital Artefact 1 - Tiny Home Environmental Design
Digital Artefact 1 - Tiny Home Environmental DesignDigital Artefact 1 - Tiny Home Environmental Design
Digital Artefact 1 - Tiny Home Environmental Design
amberjdewit93
 
South African Journal of Science: Writing with integrity workshop (2024)
South African Journal of Science: Writing with integrity workshop (2024)South African Journal of Science: Writing with integrity workshop (2024)
South African Journal of Science: Writing with integrity workshop (2024)
Academy of Science of South Africa
 
NEWSPAPERS - QUESTION 1 - REVISION POWERPOINT.pptx
NEWSPAPERS - QUESTION 1 - REVISION POWERPOINT.pptxNEWSPAPERS - QUESTION 1 - REVISION POWERPOINT.pptx
NEWSPAPERS - QUESTION 1 - REVISION POWERPOINT.pptx
iammrhaywood
 
Chapter 4 - Islamic Financial Institutions in Malaysia.pptx
Chapter 4 - Islamic Financial Institutions in Malaysia.pptxChapter 4 - Islamic Financial Institutions in Malaysia.pptx
Chapter 4 - Islamic Financial Institutions in Malaysia.pptx
Mohd Adib Abd Muin, Senior Lecturer at Universiti Utara Malaysia
 

Recently uploaded (20)

How to Fix the Import Error in the Odoo 17
How to Fix the Import Error in the Odoo 17How to Fix the Import Error in the Odoo 17
How to Fix the Import Error in the Odoo 17
 
LAND USE LAND COVER AND NDVI OF MIRZAPUR DISTRICT, UP
LAND USE LAND COVER AND NDVI OF MIRZAPUR DISTRICT, UPLAND USE LAND COVER AND NDVI OF MIRZAPUR DISTRICT, UP
LAND USE LAND COVER AND NDVI OF MIRZAPUR DISTRICT, UP
 
Liberal Approach to the Study of Indian Politics.pdf
Liberal Approach to the Study of Indian Politics.pdfLiberal Approach to the Study of Indian Politics.pdf
Liberal Approach to the Study of Indian Politics.pdf
 
spot a liar (Haiqa 146).pptx Technical writhing and presentation skills
spot a liar (Haiqa 146).pptx Technical writhing and presentation skillsspot a liar (Haiqa 146).pptx Technical writhing and presentation skills
spot a liar (Haiqa 146).pptx Technical writhing and presentation skills
 
UGC NET Exam Paper 1- Unit 1:Teaching Aptitude
UGC NET Exam Paper 1- Unit 1:Teaching AptitudeUGC NET Exam Paper 1- Unit 1:Teaching Aptitude
UGC NET Exam Paper 1- Unit 1:Teaching Aptitude
 
คำศัพท์ คำพื้นฐานการอ่าน ภาษาอังกฤษ ระดับชั้น ม.1
คำศัพท์ คำพื้นฐานการอ่าน ภาษาอังกฤษ ระดับชั้น ม.1คำศัพท์ คำพื้นฐานการอ่าน ภาษาอังกฤษ ระดับชั้น ม.1
คำศัพท์ คำพื้นฐานการอ่าน ภาษาอังกฤษ ระดับชั้น ม.1
 
Pollock and Snow "DEIA in the Scholarly Landscape, Session One: Setting Expec...
Pollock and Snow "DEIA in the Scholarly Landscape, Session One: Setting Expec...Pollock and Snow "DEIA in the Scholarly Landscape, Session One: Setting Expec...
Pollock and Snow "DEIA in the Scholarly Landscape, Session One: Setting Expec...
 
Main Java[All of the Base Concepts}.docx
Main Java[All of the Base Concepts}.docxMain Java[All of the Base Concepts}.docx
Main Java[All of the Base Concepts}.docx
 
Leveraging Generative AI to Drive Nonprofit Innovation
Leveraging Generative AI to Drive Nonprofit InnovationLeveraging Generative AI to Drive Nonprofit Innovation
Leveraging Generative AI to Drive Nonprofit Innovation
 
What is Digital Literacy? A guest blog from Andy McLaughlin, University of Ab...
What is Digital Literacy? A guest blog from Andy McLaughlin, University of Ab...What is Digital Literacy? A guest blog from Andy McLaughlin, University of Ab...
What is Digital Literacy? A guest blog from Andy McLaughlin, University of Ab...
 
Reimagining Your Library Space: How to Increase the Vibes in Your Library No ...
Reimagining Your Library Space: How to Increase the Vibes in Your Library No ...Reimagining Your Library Space: How to Increase the Vibes in Your Library No ...
Reimagining Your Library Space: How to Increase the Vibes in Your Library No ...
 
Cognitive Development Adolescence Psychology
Cognitive Development Adolescence PsychologyCognitive Development Adolescence Psychology
Cognitive Development Adolescence Psychology
 
Advanced Java[Extra Concepts, Not Difficult].docx
Advanced Java[Extra Concepts, Not Difficult].docxAdvanced Java[Extra Concepts, Not Difficult].docx
Advanced Java[Extra Concepts, Not Difficult].docx
 
ANATOMY AND BIOMECHANICS OF HIP JOINT.pdf
ANATOMY AND BIOMECHANICS OF HIP JOINT.pdfANATOMY AND BIOMECHANICS OF HIP JOINT.pdf
ANATOMY AND BIOMECHANICS OF HIP JOINT.pdf
 
BÀI TẬP BỔ TRỢ TIẾNG ANH LỚP 9 CẢ NĂM - GLOBAL SUCCESS - NĂM HỌC 2024-2025 - ...
BÀI TẬP BỔ TRỢ TIẾNG ANH LỚP 9 CẢ NĂM - GLOBAL SUCCESS - NĂM HỌC 2024-2025 - ...BÀI TẬP BỔ TRỢ TIẾNG ANH LỚP 9 CẢ NĂM - GLOBAL SUCCESS - NĂM HỌC 2024-2025 - ...
BÀI TẬP BỔ TRỢ TIẾNG ANH LỚP 9 CẢ NĂM - GLOBAL SUCCESS - NĂM HỌC 2024-2025 - ...
 
BBR 2024 Summer Sessions Interview Training
BBR  2024 Summer Sessions Interview TrainingBBR  2024 Summer Sessions Interview Training
BBR 2024 Summer Sessions Interview Training
 
Digital Artefact 1 - Tiny Home Environmental Design
Digital Artefact 1 - Tiny Home Environmental DesignDigital Artefact 1 - Tiny Home Environmental Design
Digital Artefact 1 - Tiny Home Environmental Design
 
South African Journal of Science: Writing with integrity workshop (2024)
South African Journal of Science: Writing with integrity workshop (2024)South African Journal of Science: Writing with integrity workshop (2024)
South African Journal of Science: Writing with integrity workshop (2024)
 
NEWSPAPERS - QUESTION 1 - REVISION POWERPOINT.pptx
NEWSPAPERS - QUESTION 1 - REVISION POWERPOINT.pptxNEWSPAPERS - QUESTION 1 - REVISION POWERPOINT.pptx
NEWSPAPERS - QUESTION 1 - REVISION POWERPOINT.pptx
 
Chapter 4 - Islamic Financial Institutions in Malaysia.pptx
Chapter 4 - Islamic Financial Institutions in Malaysia.pptxChapter 4 - Islamic Financial Institutions in Malaysia.pptx
Chapter 4 - Islamic Financial Institutions in Malaysia.pptx
 

Tabulation 2

  • 1. PROGRAMME B.COM SUBJECT QUANTITATIVE TECHNIQUE – I SEMESTER III UNIVERSITY VIJAYANAGAR SRI KRISHNADEVARAYA UNIVERSITY, BALLARI SESSION 16
  • 2. RECAP • Tabulation of Data, Meaning, Objectives & Rules for Tabulation
  • 3. LEARNING OBJECTIVES • The aim of the chapter is to make students to present data in textual and Tabular format including the technique of creating frequency distribution and working out bi-variate distribution table
  • 4. LEARNING OUTCOMES • After the Chapter, The Students Shall be able to Describe and Understand the Rules & Types of Classification, Frequency Distribution, Class Interval & its Types, Basic Principles Tabulation and The Sorting of Data.
  • 5. SESSION - 16 • Types of Tables, Preparation of Blank Table and Problems - 01
  • 6. Types of Tables • Statistical tables can be classified under two general categories, namely, general tables and summary tables. General tables contain a collection of detailed information including all that is relevant to the subject or theme. Summary tables are designed to serve some specific purposes. They are smaller in size than general tables, emphasize on some aspect of data and are generally incorporated within the text.
  • 7. CONTD • The statistical tables may further be classified into two broad classes namely simple tables and complex tables.  A simple table summarizes information on a single characteristic and is also called a univariate table.  A complex table summarizes the complicated information and presents them into two or more interrelated categories.
  • 8. Preparation of Blank Table FORMAT OF TABLE TITLE HEAD NOTE Footnote Table Number Source STUB HEADING CAPTION COLUMN HEADING / COLUMN HEADING SUB ENTRIES BODY
  • 9. Example 01 • Draft a blank table to show the distribution of employees in a in a nationalized bank according to Sex ; Male and Female Grade ; Below Rs. 1000, Rs.1000-1500, Periods ; 2011 and 2012 Age Group ; Below 25, 25-40,
  • 10. CONTD Distribution Of Employees Of A Nationalized Bank (Age, Sex, Salary, and For Two years) YEA R AGE GRO-- UPS GRADE SALARIES TOTAL BELOW RS 1000 RS 1000- 1500 2011 Below 25 25-40 MALE FEMALE TOTAL MALE FEMALE TOTAL MALE FEMALE TOTAL TOTAL 2012 Below 25 25-40 TOTAL
  • 11. SUMMARY As we already discussed and learnt today on Classifications and Tabulation as below • Types of Tables, Preparation of Blank Table and Problems 01
  • 12. MCQs 1 . A frequency distribution formed considering two variables at a time is called: (a) Univariate frequency distribution (b) Bivariate frequency distribution (c) Trivariate frequency distribution (d) Bimodal distribution 2 . The arrangement of data in rows and columns is called: (a) Classification (b) Tabulation (c) Frequency distribution (d) Cumulative frequency distribution
  • 13. MCQs 3 . When the qualitative or quantitative raw data are classified according to one characteristic, the tabulation of different groups is called: (a) Dichotomy (b) Manifold-division (c) Bivariate (d) One-way 4 . A statistical table consists of at least: (a) Two parts (b) Three parts (c) Four parts (d) Five parts
  • 14. MCQs 5 . In a statistical table, prefatory note is shown: (a) Below the body (b) Box head ` (c) Foot note (d) Below the title
  • 16. REFERENCES • S.P. Gupta, Sultan Chand and Sons Publications, 2017 • S. C. Gupta, Himalaya Publishing House, Fundamentals of Statistics, 2018 • R.S.N Pillai and Bagavathi, S.Chand publications, 2010