SlideShare a Scribd company logo
1 of 15
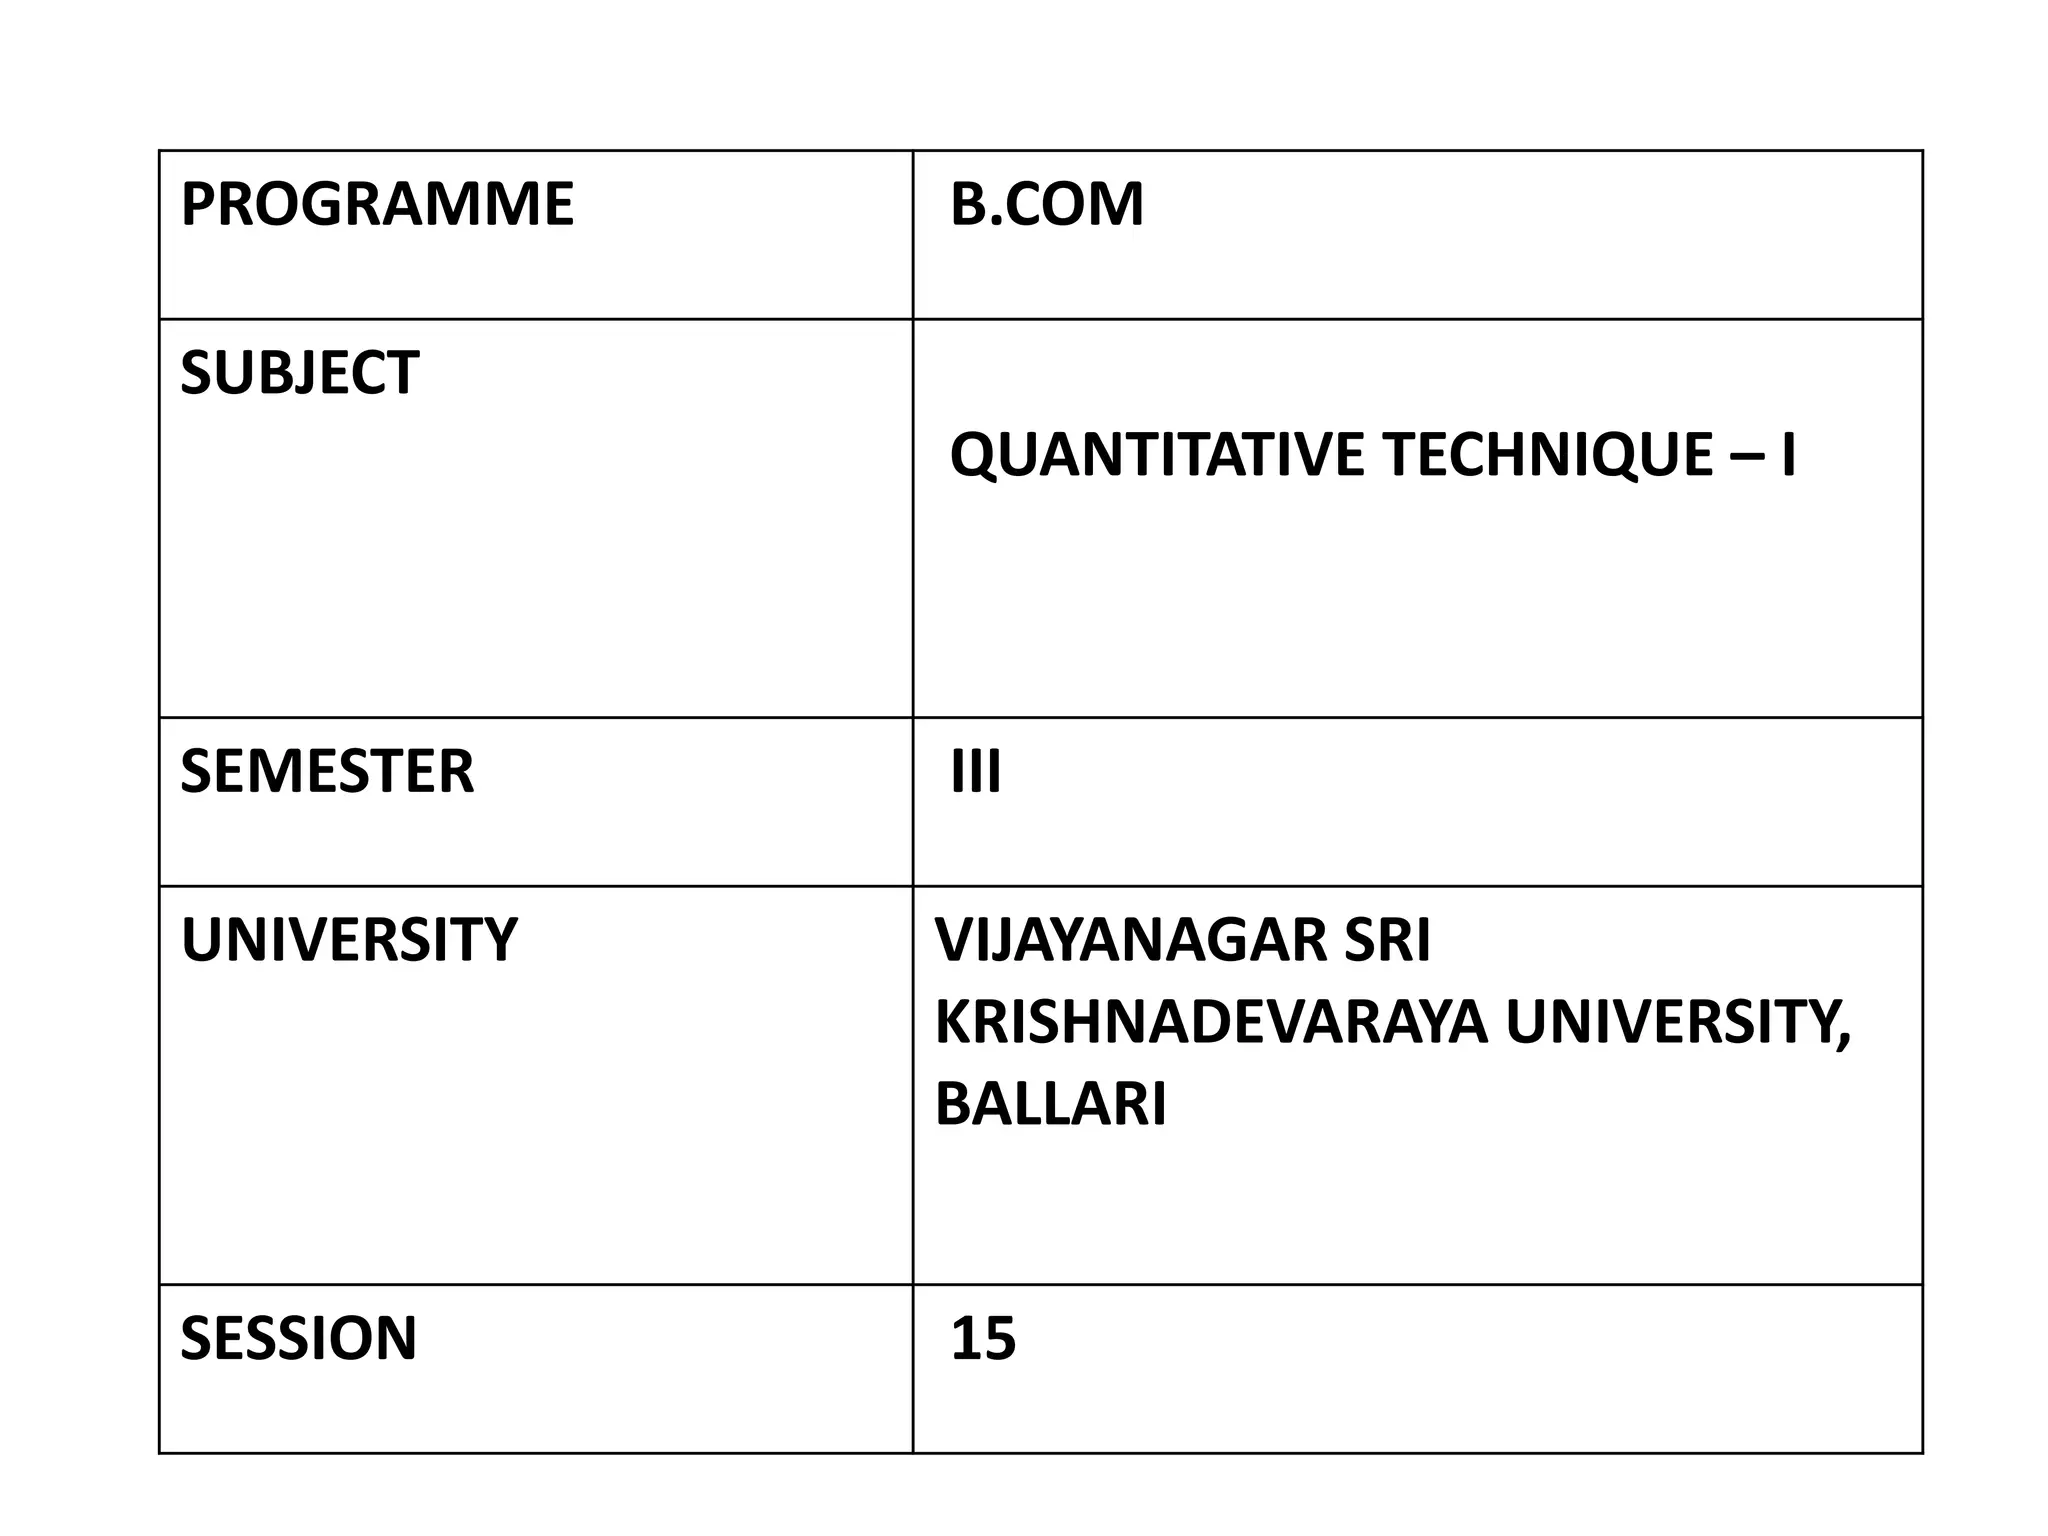
PROGRAMME B.COM
SUBJECT
QUANTITATIVE TECHNIQUE – I
SEMESTER III
UNIVERSITY VIJAYANAGAR SRI
KRISHNADEVARAYA UNIVERSITY,
BALLARI
SESSION 15
RECAP
• Bi-Variate Frequency Distribution Table Problems –02
LEARNING OBJECTIVES
• The aim of the chapter is to make students to
present data in textual and Tabular format including
the technique of creating frequency distribution
and working out bi-variate distribution table
LEARNING OUTCOMES
• After the Chapter, The Students Shall be able to
Describe and Understand the Rules & Types of
Classification, Frequency Distribution, Class Interval
& its Types, Basic Principles Tabulation and The
Sorting of Data.
SESSION - 15
• Tabulation of Data, Meaning, Objectives & Rules for
Tabulation
Meaning of Tabulation of Data
• Simply classifying the gathered data is not achieve the
objective, unless they kept in a systematic way.
Keeping the data in a horizontal rows and vertical
columns systematically is called tabulation.
• Prof- Neiswanger defines “ a statistical table is a
systematic organization of data in a columns and rows.
• In one sentence we can say that tabulation is the
process of presenting the data in a table
Objectives of Tabulation
• To Simplify the Complex Data
• To Bring Out Essential Features of the Data
• To Facilitate Comparison
• To Facilitate Statistical Analysis
• To Saving of Space
• To help reference
• To present facts in the minimum of space
Rules for Tabulation
• The size of the table should be suitable to the size of
the paper
• Captions and Stubs should be arranged in some
systematic order
• The unit of measurement should be clearly defined
such as “Rs in Crore”
• Figures may be rounded
• The table should not be overloaded with unnecessary
details
• Table should be complete and self explanatory
• A table should be attractive and draw the attention
of the reader.
• Using of abbreviations should be avoided
SUMMARY
As we already discussed and learnt today on
Classifications and Tabulation as below
• Tabulation of Data
• Meaning, Objectives of tabulation
• Rules for Tabulation
MCQs
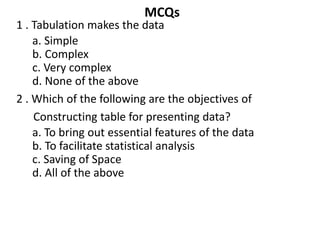
1 . Tabulation makes the data
a. Simple
b. Complex
c. Very complex
d. None of the above
2 . Which of the following are the objectives of
Constructing table for presenting data?
a. To bring out essential features of the data
b. To facilitate statistical analysis
c. Saving of Space
d. All of the above
MCQs
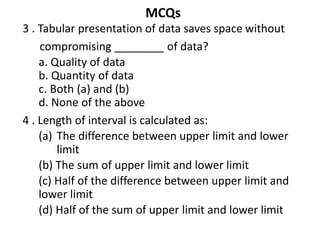
3 . Tabular presentation of data saves space without
compromising ________ of data?
a. Quality of data
b. Quantity of data
c. Both (a) and (b)
d. None of the above
4 . Length of interval is calculated as:
(a) The difference between upper limit and lower
limit
(b) The sum of upper limit and lower limit
(c) Half of the difference between upper limit and
lower limit
(d) Half of the sum of upper limit and lower limit
MCQs
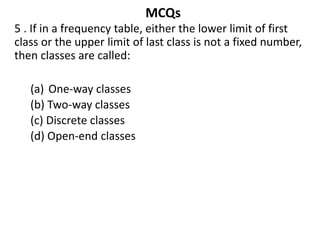
5 . If in a frequency table, either the lower limit of first
class or the upper limit of last class is not a fixed number,
then classes are called:
(a) One-way classes
(b) Two-way classes
(c) Discrete classes
(d) Open-end classes
CONTD
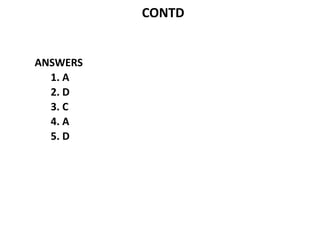
ANSWERS
1. A
2. D
3. C
4. A
5. D
REFERENCES
• S.P. Gupta, Sultan Chand and Sons Publications, 2017
• S. C. Gupta, Himalaya Publishing House,
Fundamentals of Statistics, 2018
• R.S.N Pillai and Bagavathi, S.Chand publications, 2010
THANK YOU

More Related Content

Similar to Tabulation theory

collectionandrepresentationofdata1-200904192336.pptx
collectionandrepresentationofdata1-200904192336.pptxcollectionandrepresentationofdata1-200904192336.pptx
collectionandrepresentationofdata1-200904192336.pptx
aibakimito
 

Similar to Tabulation theory (20)

DBMS Relational Data Model .pptx
DBMS Relational Data Model .pptxDBMS Relational Data Model .pptx
DBMS Relational Data Model .pptx
 
Frequency Distribution Table 3
Frequency Distribution Table 3Frequency Distribution Table 3
Frequency Distribution Table 3
 
frequency distribution table 3
frequency distribution table 3frequency distribution table 3
frequency distribution table 3
 
Data presenattaion we can read this document..pptx
Data presenattaion  we can read this document..pptxData presenattaion  we can read this document..pptx
Data presenattaion we can read this document..pptx
 
Unit 4 editing and coding (2)
Unit 4 editing and coding (2)Unit 4 editing and coding (2)
Unit 4 editing and coding (2)
 
1. Data Process.pptx
1. Data Process.pptx1. Data Process.pptx
1. Data Process.pptx
 
collectionandrepresentationofdata1-200904192336.pptx
collectionandrepresentationofdata1-200904192336.pptxcollectionandrepresentationofdata1-200904192336.pptx
collectionandrepresentationofdata1-200904192336.pptx
 
Tabular and Graphical Representation of Data
Tabular and Graphical Representation of Data Tabular and Graphical Representation of Data
Tabular and Graphical Representation of Data
 
DATA PROCESSING on marketing research...
DATA PROCESSING on marketing research...DATA PROCESSING on marketing research...
DATA PROCESSING on marketing research...
 
Results and discussion
Results and discussionResults and discussion
Results and discussion
 
Data processing.pdf
Data processing.pdfData processing.pdf
Data processing.pdf
 
research methodology presentation-6.pptx
research methodology presentation-6.pptxresearch methodology presentation-6.pptx
research methodology presentation-6.pptx
 
Diagrams part 2
Diagrams part 2Diagrams part 2
Diagrams part 2
 
Chapter_2_-_Collection_and_Presentation_of_Data-1.pptx
Chapter_2_-_Collection_and_Presentation_of_Data-1.pptxChapter_2_-_Collection_and_Presentation_of_Data-1.pptx
Chapter_2_-_Collection_and_Presentation_of_Data-1.pptx
 
Data Visualization in Excel
Data Visualization in ExcelData Visualization in Excel
Data Visualization in Excel
 
frequency distribution table 1
frequency distribution table 1frequency distribution table 1
frequency distribution table 1
 
Frequency Distribution Table 1
Frequency Distribution Table 1Frequency Distribution Table 1
Frequency Distribution Table 1
 
Using Large-Scale LMS Data Portal Data to Improve Teaching and Learning (at K...
Using Large-Scale LMS Data Portal Data to Improve Teaching and Learning (at K...Using Large-Scale LMS Data Portal Data to Improve Teaching and Learning (at K...
Using Large-Scale LMS Data Portal Data to Improve Teaching and Learning (at K...
 
Data Analysis technique, data collection, data analysis
Data Analysis technique, data collection, data analysisData Analysis technique, data collection, data analysis
Data Analysis technique, data collection, data analysis
 
Chapter 11 Data Analysis Classification and Tabulation
Chapter 11 Data Analysis Classification and TabulationChapter 11 Data Analysis Classification and Tabulation
Chapter 11 Data Analysis Classification and Tabulation
 

More from AkkiMaruthi2

More from AkkiMaruthi2 (20)

Bi variate Table 2
Bi variate Table 2Bi variate Table 2
Bi variate Table 2
 
Classification Theory
Classification Theory Classification Theory
Classification Theory
 
tabulation 3
tabulation 3tabulation 3
tabulation 3
 
Bivariate table 1
Bivariate table 1Bivariate table 1
Bivariate table 1
 
Frequency Distribution Table 4
Frequency Distribution Table 4Frequency Distribution Table 4
Frequency Distribution Table 4
 
Frequency Distribution Table 5
Frequency Distribution Table 5Frequency Distribution Table 5
Frequency Distribution Table 5
 
Frequency Distribution Table 2
Frequency Distribution Table 2Frequency Distribution Table 2
Frequency Distribution Table 2
 
Mean, median & mode 2
Mean, median & mode 2Mean, median & mode 2
Mean, median & mode 2
 
KPC skewness 1
KPC skewness 1KPC skewness 1
KPC skewness 1
 
mean median mode 3
mean median mode 3mean median mode 3
mean median mode 3
 
Mean, median & mode 1
Mean, median & mode 1Mean, median & mode 1
Mean, median & mode 1
 
Range, Q.D and Co-efficient 2
Range, Q.D and Co-efficient 2Range, Q.D and Co-efficient 2
Range, Q.D and Co-efficient 2
 
graphical representation 1
graphical representation 1graphical representation 1
graphical representation 1
 
KPC skewness 2
KPC skewness 2KPC skewness 2
KPC skewness 2
 
graphical representation 4
graphical representation 4graphical representation 4
graphical representation 4
 
graphical representation 5
graphical representation 5graphical representation 5
graphical representation 5
 
graphical representation 2
graphical representation 2graphical representation 2
graphical representation 2
 
Measures of Dispersion
Measures of DispersionMeasures of Dispersion
Measures of Dispersion
 
Missing frequency 1
Missing frequency 1Missing frequency 1
Missing frequency 1
 
KPC skewness 2
KPC skewness 2KPC skewness 2
KPC skewness 2
 

Recently uploaded

Jual Obat Aborsi Hongkong ( Asli No.1 ) 085657271886 Obat Penggugur Kandungan...
Jual Obat Aborsi Hongkong ( Asli No.1 ) 085657271886 Obat Penggugur Kandungan...Jual Obat Aborsi Hongkong ( Asli No.1 ) 085657271886 Obat Penggugur Kandungan...
Jual Obat Aborsi Hongkong ( Asli No.1 ) 085657271886 Obat Penggugur Kandungan...
ZurliaSoop
 
1029 - Danh muc Sach Giao Khoa 10 . pdf
1029 -  Danh muc Sach Giao Khoa 10 . pdf1029 -  Danh muc Sach Giao Khoa 10 . pdf
1029 - Danh muc Sach Giao Khoa 10 . pdf
QucHHunhnh
 
Vishram Singh - Textbook of Anatomy Upper Limb and Thorax.. Volume 1 (1).pdf
Vishram Singh - Textbook of Anatomy  Upper Limb and Thorax.. Volume 1 (1).pdfVishram Singh - Textbook of Anatomy  Upper Limb and Thorax.. Volume 1 (1).pdf
Vishram Singh - Textbook of Anatomy Upper Limb and Thorax.. Volume 1 (1).pdf
ssuserdda66b
 
1029-Danh muc Sach Giao Khoa khoi 6.pdf
1029-Danh muc Sach Giao Khoa khoi  6.pdf1029-Danh muc Sach Giao Khoa khoi  6.pdf
1029-Danh muc Sach Giao Khoa khoi 6.pdf
QucHHunhnh
 
Activity 01 - Artificial Culture (1).pdf
Activity 01 - Artificial Culture (1).pdfActivity 01 - Artificial Culture (1).pdf
Activity 01 - Artificial Culture (1).pdf
ciinovamais
 

Recently uploaded (20)

Jual Obat Aborsi Hongkong ( Asli No.1 ) 085657271886 Obat Penggugur Kandungan...
Jual Obat Aborsi Hongkong ( Asli No.1 ) 085657271886 Obat Penggugur Kandungan...Jual Obat Aborsi Hongkong ( Asli No.1 ) 085657271886 Obat Penggugur Kandungan...
Jual Obat Aborsi Hongkong ( Asli No.1 ) 085657271886 Obat Penggugur Kandungan...
 
1029 - Danh muc Sach Giao Khoa 10 . pdf
1029 -  Danh muc Sach Giao Khoa 10 . pdf1029 -  Danh muc Sach Giao Khoa 10 . pdf
1029 - Danh muc Sach Giao Khoa 10 . pdf
 
Towards a code of practice for AI in AT.pptx
Towards a code of practice for AI in AT.pptxTowards a code of practice for AI in AT.pptx
Towards a code of practice for AI in AT.pptx
 
Dyslexia AI Workshop for Slideshare.pptx
Dyslexia AI Workshop for Slideshare.pptxDyslexia AI Workshop for Slideshare.pptx
Dyslexia AI Workshop for Slideshare.pptx
 
Vishram Singh - Textbook of Anatomy Upper Limb and Thorax.. Volume 1 (1).pdf
Vishram Singh - Textbook of Anatomy  Upper Limb and Thorax.. Volume 1 (1).pdfVishram Singh - Textbook of Anatomy  Upper Limb and Thorax.. Volume 1 (1).pdf
Vishram Singh - Textbook of Anatomy Upper Limb and Thorax.. Volume 1 (1).pdf
 
On National Teacher Day, meet the 2024-25 Kenan Fellows
On National Teacher Day, meet the 2024-25 Kenan FellowsOn National Teacher Day, meet the 2024-25 Kenan Fellows
On National Teacher Day, meet the 2024-25 Kenan Fellows
 
ICT Role in 21st Century Education & its Challenges.pptx
ICT Role in 21st Century Education & its Challenges.pptxICT Role in 21st Century Education & its Challenges.pptx
ICT Role in 21st Century Education & its Challenges.pptx
 
1029-Danh muc Sach Giao Khoa khoi 6.pdf
1029-Danh muc Sach Giao Khoa khoi  6.pdf1029-Danh muc Sach Giao Khoa khoi  6.pdf
1029-Danh muc Sach Giao Khoa khoi 6.pdf
 
This PowerPoint helps students to consider the concept of infinity.
This PowerPoint helps students to consider the concept of infinity.This PowerPoint helps students to consider the concept of infinity.
This PowerPoint helps students to consider the concept of infinity.
 
How to Manage Global Discount in Odoo 17 POS
How to Manage Global Discount in Odoo 17 POSHow to Manage Global Discount in Odoo 17 POS
How to Manage Global Discount in Odoo 17 POS
 
UGC NET Paper 1 Mathematical Reasoning & Aptitude.pdf
UGC NET Paper 1 Mathematical Reasoning & Aptitude.pdfUGC NET Paper 1 Mathematical Reasoning & Aptitude.pdf
UGC NET Paper 1 Mathematical Reasoning & Aptitude.pdf
 
Making communications land - Are they received and understood as intended? we...
Making communications land - Are they received and understood as intended? we...Making communications land - Are they received and understood as intended? we...
Making communications land - Are they received and understood as intended? we...
 
Single or Multiple melodic lines structure
Single or Multiple melodic lines structureSingle or Multiple melodic lines structure
Single or Multiple melodic lines structure
 
Spatium Project Simulation student brief
Spatium Project Simulation student briefSpatium Project Simulation student brief
Spatium Project Simulation student brief
 
Mehran University Newsletter Vol-X, Issue-I, 2024
Mehran University Newsletter Vol-X, Issue-I, 2024Mehran University Newsletter Vol-X, Issue-I, 2024
Mehran University Newsletter Vol-X, Issue-I, 2024
 
Accessible Digital Futures project (20/03/2024)
Accessible Digital Futures project (20/03/2024)Accessible Digital Futures project (20/03/2024)
Accessible Digital Futures project (20/03/2024)
 
Activity 01 - Artificial Culture (1).pdf
Activity 01 - Artificial Culture (1).pdfActivity 01 - Artificial Culture (1).pdf
Activity 01 - Artificial Culture (1).pdf
 
Micro-Scholarship, What it is, How can it help me.pdf
Micro-Scholarship, What it is, How can it help me.pdfMicro-Scholarship, What it is, How can it help me.pdf
Micro-Scholarship, What it is, How can it help me.pdf
 
FSB Advising Checklist - Orientation 2024
FSB Advising Checklist - Orientation 2024FSB Advising Checklist - Orientation 2024
FSB Advising Checklist - Orientation 2024
 
Unit-IV- Pharma. Marketing Channels.pptx
Unit-IV- Pharma. Marketing Channels.pptxUnit-IV- Pharma. Marketing Channels.pptx
Unit-IV- Pharma. Marketing Channels.pptx
 

Tabulation theory

  • 1. PROGRAMME B.COM SUBJECT QUANTITATIVE TECHNIQUE – I SEMESTER III UNIVERSITY VIJAYANAGAR SRI KRISHNADEVARAYA UNIVERSITY, BALLARI SESSION 15
  • 2. RECAP • Bi-Variate Frequency Distribution Table Problems –02
  • 3. LEARNING OBJECTIVES • The aim of the chapter is to make students to present data in textual and Tabular format including the technique of creating frequency distribution and working out bi-variate distribution table
  • 4. LEARNING OUTCOMES • After the Chapter, The Students Shall be able to Describe and Understand the Rules & Types of Classification, Frequency Distribution, Class Interval & its Types, Basic Principles Tabulation and The Sorting of Data.
  • 5. SESSION - 15 • Tabulation of Data, Meaning, Objectives & Rules for Tabulation
  • 6. Meaning of Tabulation of Data • Simply classifying the gathered data is not achieve the objective, unless they kept in a systematic way. Keeping the data in a horizontal rows and vertical columns systematically is called tabulation. • Prof- Neiswanger defines “ a statistical table is a systematic organization of data in a columns and rows. • In one sentence we can say that tabulation is the process of presenting the data in a table
  • 7. Objectives of Tabulation • To Simplify the Complex Data • To Bring Out Essential Features of the Data • To Facilitate Comparison • To Facilitate Statistical Analysis • To Saving of Space • To help reference • To present facts in the minimum of space
  • 8. Rules for Tabulation • The size of the table should be suitable to the size of the paper • Captions and Stubs should be arranged in some systematic order • The unit of measurement should be clearly defined such as “Rs in Crore” • Figures may be rounded • The table should not be overloaded with unnecessary details • Table should be complete and self explanatory • A table should be attractive and draw the attention of the reader. • Using of abbreviations should be avoided
  • 9. SUMMARY As we already discussed and learnt today on Classifications and Tabulation as below • Tabulation of Data • Meaning, Objectives of tabulation • Rules for Tabulation
  • 10. MCQs 1 . Tabulation makes the data a. Simple b. Complex c. Very complex d. None of the above 2 . Which of the following are the objectives of Constructing table for presenting data? a. To bring out essential features of the data b. To facilitate statistical analysis c. Saving of Space d. All of the above
  • 11. MCQs 3 . Tabular presentation of data saves space without compromising ________ of data? a. Quality of data b. Quantity of data c. Both (a) and (b) d. None of the above 4 . Length of interval is calculated as: (a) The difference between upper limit and lower limit (b) The sum of upper limit and lower limit (c) Half of the difference between upper limit and lower limit (d) Half of the sum of upper limit and lower limit
  • 12. MCQs 5 . If in a frequency table, either the lower limit of first class or the upper limit of last class is not a fixed number, then classes are called: (a) One-way classes (b) Two-way classes (c) Discrete classes (d) Open-end classes
  • 14. REFERENCES • S.P. Gupta, Sultan Chand and Sons Publications, 2017 • S. C. Gupta, Himalaya Publishing House, Fundamentals of Statistics, 2018 • R.S.N Pillai and Bagavathi, S.Chand publications, 2010