This document contains examples of different types of tabular data presentations:
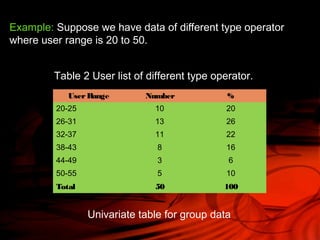
- Univariate tables use one variable to organize data into rows and columns, such as user numbers for different mobile operators.
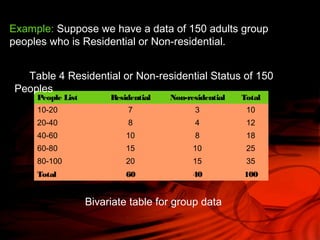
- Bivariate tables use two variables, like the number of rich and middle class cellphone users of different brands.
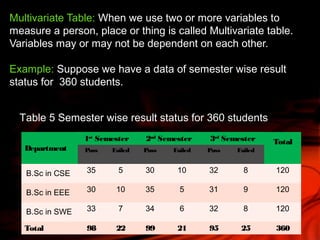
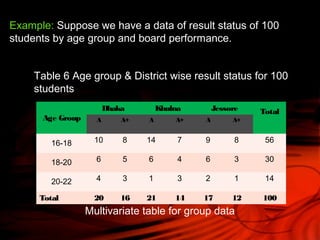
- Multivariate tables use two or more variables, for example semester-wise results for students organized by department, age group, and school board performance.
Tabular presentations clearly organize data without losing information, and are useful for database design, cascading style sheets, Excel sheets, and representing data in word documents.