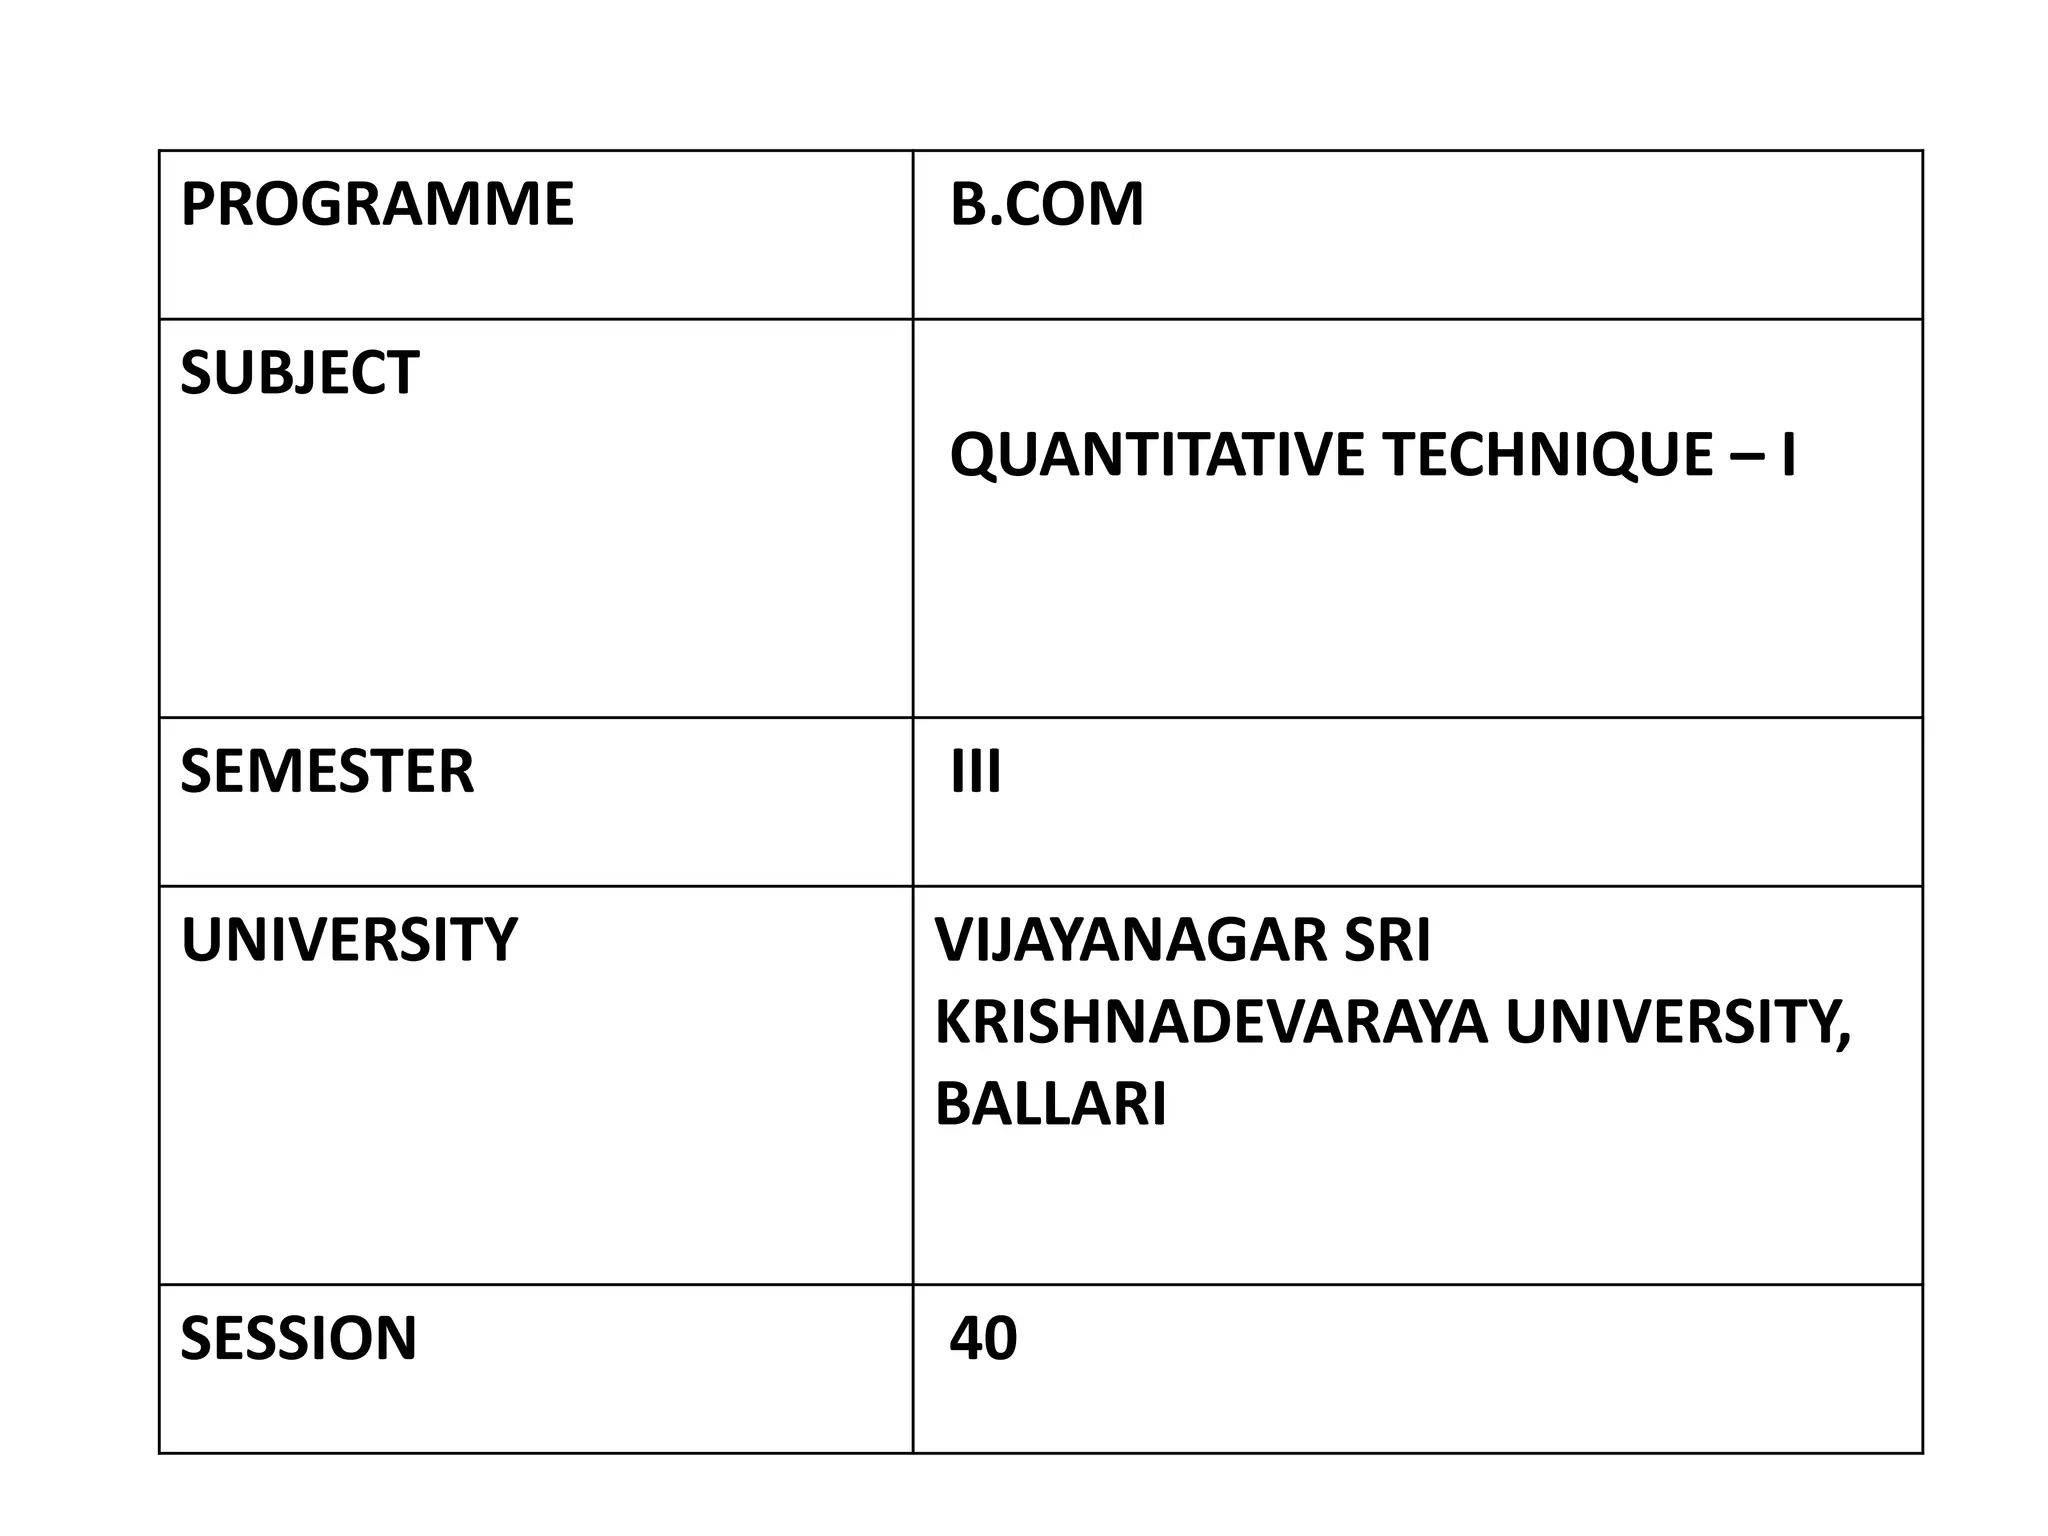
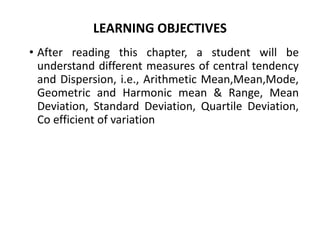
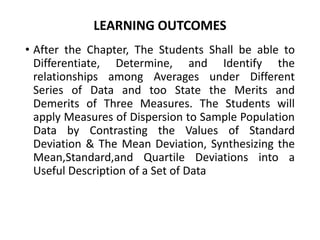
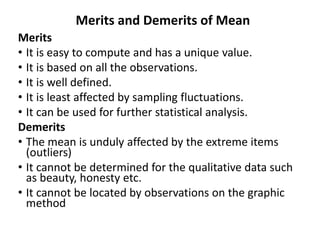
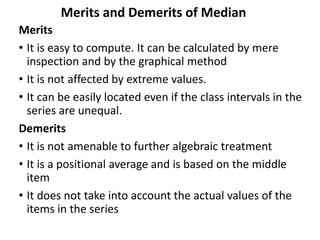
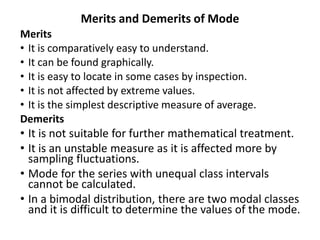
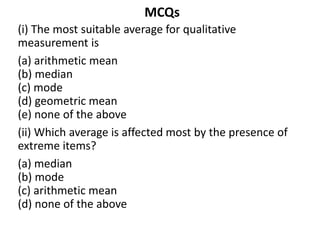
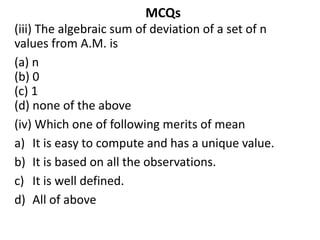
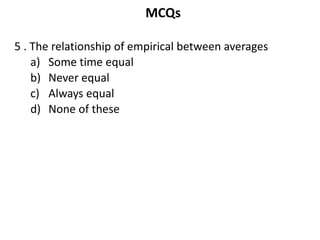
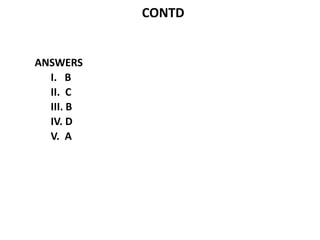
SlideShare a Scribd company logo
1 of 14
PROGRAMME B.COM
SUBJECT
QUANTITATIVE TECHNIQUE – I
SEMESTER III
UNIVERSITY VIJAYANAGAR SRI
KRISHNADEVARAYA UNIVERSITY,
BALLARI
SESSION 40
RECAP
• Missing Frequencies in Mean and Median Under
Continuous Series Problems ---- 01
LEARNING OBJECTIVES
• After reading this chapter, a student will be
understand different measures of central tendency
and Dispersion, i.e., Arithmetic Mean,Mean,Mode,
Geometric and Harmonic mean & Range, Mean
Deviation, Standard Deviation, Quartile Deviation,
Co efficient of variation
LEARNING OUTCOMES
• After the Chapter, The Students Shall be able to
Differentiate, Determine, and Identify the
relationships among Averages under Different
Series of Data and too State the Merits and
Demerits of Three Measures. The Students will
apply Measures of Dispersion to Sample Population
Data by Contrasting the Values of Standard
Deviation & The Mean Deviation, Synthesizing the
Mean,Standard,and Quartile Deviations into a
Useful Description of a Set of Data
SESSION - 40
• Merits & Demerits of Mean, Median and Mode
Merits and Demerits of Mean
Merits
• It is easy to compute and has a unique value.
• It is based on all the observations.
• It is well defined.
• It is least affected by sampling fluctuations.
• It can be used for further statistical analysis.
Demerits
• The mean is unduly affected by the extreme items
(outliers)
• It cannot be determined for the qualitative data such
as beauty, honesty etc.
• It cannot be located by observations on the graphic
method
Merits and Demerits of Median
Merits
• It is easy to compute. It can be calculated by mere
inspection and by the graphical method
• It is not affected by extreme values.
• It can be easily located even if the class intervals in the
series are unequal.
Demerits
• It is not amenable to further algebraic treatment
• It is a positional average and is based on the middle
item
• It does not take into account the actual values of the
items in the series
Merits and Demerits of Mode
Merits
• It is comparatively easy to understand.
• It can be found graphically.
• It is easy to locate in some cases by inspection.
• It is not affected by extreme values.
• It is the simplest descriptive measure of average.
Demerits
• It is not suitable for further mathematical treatment.
• It is an unstable measure as it is affected more by
sampling fluctuations.
• Mode for the series with unequal class intervals
cannot be calculated.
• In a bimodal distribution, there are two modal classes
and it is difficult to determine the values of the mode.
MCQs
(i) The most suitable average for qualitative
measurement is
(a) arithmetic mean
(b) median
(c) mode
(d) geometric mean
(e) none of the above
(ii) Which average is affected most by the presence of
extreme items?
(a) median
(b) mode
(c) arithmetic mean
(d) none of the above
MCQs
(iii) The algebraic sum of deviation of a set of n
values from A.M. is
(a) n
(b) 0
(c) 1
(d) none of the above
(iv) Which one of following merits of mean
a) It is easy to compute and has a unique value.
b) It is based on all the observations.
c) It is well defined.
d) All of above
MCQs
5 . The relationship of empirical between averages
a) Some time equal
b) Never equal
c) Always equal
d) None of these
CONTD
ANSWERS
I. B
II. C
III. B
IV. D
V. A
REFERENCES
• S.P. Gupta, Sultan Chand and Sons Publications, 2017
• S. C. Gupta, Himalaya Publishing House,
Fundamentals of Statistics, 2018
• R.S.N Pillai and Bagavathi, S.Chand publications, 2010
THANK YOU

More Related Content

Similar to mean median mode 3

Course module bridge course in maths
Course module bridge course in mathsCourse module bridge course in maths
Course module bridge course in maths
harleen235
 
Course module bridge course in maths
Course module bridge course in mathsCourse module bridge course in maths
Course module bridge course in maths
harleen235
 
Course module maths
Course module mathsCourse module maths
Course module maths
harleen235
 

Similar to mean median mode 3 (20)

Basic geostatistics
Basic geostatisticsBasic geostatistics
Basic geostatistics
 
Measure of Central Tendency
Measure of Central TendencyMeasure of Central Tendency
Measure of Central Tendency
 
measures of central tendency.pptx
measures of central tendency.pptxmeasures of central tendency.pptx
measures of central tendency.pptx
 
Basics of Statistical Analysis
Basics of Statistical AnalysisBasics of Statistical Analysis
Basics of Statistical Analysis
 
correlation and regrating for (1).pptx
correlation and regrating for   (1).pptxcorrelation and regrating for   (1).pptx
correlation and regrating for (1).pptx
 
Course module bridge course in maths
Course module bridge course in mathsCourse module bridge course in maths
Course module bridge course in maths
 
Course module bridge course in maths
Course module bridge course in mathsCourse module bridge course in maths
Course module bridge course in maths
 
Research Methodology
Research MethodologyResearch Methodology
Research Methodology
 
Module 1_Theory.pdf
Module 1_Theory.pdfModule 1_Theory.pdf
Module 1_Theory.pdf
 
Mean, median & mode 2
Mean, median & mode 2Mean, median & mode 2
Mean, median & mode 2
 
Course module maths
Course module mathsCourse module maths
Course module maths
 
CHAPTER 2 - NORM, CORRELATION AND REGRESSION.ppt
CHAPTER 2  - NORM, CORRELATION AND REGRESSION.pptCHAPTER 2  - NORM, CORRELATION AND REGRESSION.ppt
CHAPTER 2 - NORM, CORRELATION AND REGRESSION.ppt
 
BMS.ppt
BMS.pptBMS.ppt
BMS.ppt
 
computer application in pharmaceutical research
computer application in pharmaceutical researchcomputer application in pharmaceutical research
computer application in pharmaceutical research
 
3. Statistical Analysis.pptx
3. Statistical Analysis.pptx3. Statistical Analysis.pptx
3. Statistical Analysis.pptx
 
Introduction to Statistics .pdf
Introduction to Statistics .pdfIntroduction to Statistics .pdf
Introduction to Statistics .pdf
 
Missing frequency 1
Missing frequency 1Missing frequency 1
Missing frequency 1
 
Statistics ( central tendency / average)
Statistics ( central tendency / average)Statistics ( central tendency / average)
Statistics ( central tendency / average)
 
Central tendency and Measure of Dispersion
Central tendency and Measure of DispersionCentral tendency and Measure of Dispersion
Central tendency and Measure of Dispersion
 
CHE Seminar 20 November 2013
CHE Seminar 20 November 2013CHE Seminar 20 November 2013
CHE Seminar 20 November 2013
 

More from AkkiMaruthi2

More from AkkiMaruthi2 (20)

Bi variate Table 2
Bi variate Table 2Bi variate Table 2
Bi variate Table 2
 
Tabulation 2
Tabulation 2Tabulation 2
Tabulation 2
 
Classification Theory
Classification Theory Classification Theory
Classification Theory
 
tabulation 3
tabulation 3tabulation 3
tabulation 3
 
Blank Table 1
Blank Table 1Blank Table 1
Blank Table 1
 
Bivariate table 1
Bivariate table 1Bivariate table 1
Bivariate table 1
 
Frequency Distribution Table 4
Frequency Distribution Table 4Frequency Distribution Table 4
Frequency Distribution Table 4
 
Frequency Distribution Table 5
Frequency Distribution Table 5Frequency Distribution Table 5
Frequency Distribution Table 5
 
Frequency Distribution Table 3
Frequency Distribution Table 3Frequency Distribution Table 3
Frequency Distribution Table 3
 
Frequency Distribution Table 2
Frequency Distribution Table 2Frequency Distribution Table 2
Frequency Distribution Table 2
 
Frequency Distribution Table 1
Frequency Distribution Table 1Frequency Distribution Table 1
Frequency Distribution Table 1
 
KPC skewness 1
KPC skewness 1KPC skewness 1
KPC skewness 1
 
Range, Q.D and Co-efficient 2
Range, Q.D and Co-efficient 2Range, Q.D and Co-efficient 2
Range, Q.D and Co-efficient 2
 
graphical representation 1
graphical representation 1graphical representation 1
graphical representation 1
 
KPC skewness 2
KPC skewness 2KPC skewness 2
KPC skewness 2
 
graphical representation 4
graphical representation 4graphical representation 4
graphical representation 4
 
graphical representation 5
graphical representation 5graphical representation 5
graphical representation 5
 
graphical representation 2
graphical representation 2graphical representation 2
graphical representation 2
 
diagrams theory
diagrams theorydiagrams theory
diagrams theory
 
KPC skewness 2
KPC skewness 2KPC skewness 2
KPC skewness 2
 

Recently uploaded

Recently uploaded (20)

General Principles of Intellectual Property: Concepts of Intellectual Proper...
General Principles of Intellectual Property: Concepts of Intellectual  Proper...General Principles of Intellectual Property: Concepts of Intellectual  Proper...
General Principles of Intellectual Property: Concepts of Intellectual Proper...
 
REMIFENTANIL: An Ultra short acting opioid.pptx
REMIFENTANIL: An Ultra short acting opioid.pptxREMIFENTANIL: An Ultra short acting opioid.pptx
REMIFENTANIL: An Ultra short acting opioid.pptx
 
Google Gemini An AI Revolution in Education.pptx
Google Gemini An AI Revolution in Education.pptxGoogle Gemini An AI Revolution in Education.pptx
Google Gemini An AI Revolution in Education.pptx
 
How to Give a Domain for a Field in Odoo 17
How to Give a Domain for a Field in Odoo 17How to Give a Domain for a Field in Odoo 17
How to Give a Domain for a Field in Odoo 17
 
Sociology 101 Demonstration of Learning Exhibit
Sociology 101 Demonstration of Learning ExhibitSociology 101 Demonstration of Learning Exhibit
Sociology 101 Demonstration of Learning Exhibit
 
Single or Multiple melodic lines structure
Single or Multiple melodic lines structureSingle or Multiple melodic lines structure
Single or Multiple melodic lines structure
 
Unit 3 Emotional Intelligence and Spiritual Intelligence.pdf
Unit 3 Emotional Intelligence and Spiritual Intelligence.pdfUnit 3 Emotional Intelligence and Spiritual Intelligence.pdf
Unit 3 Emotional Intelligence and Spiritual Intelligence.pdf
 
Spatium Project Simulation student brief
Spatium Project Simulation student briefSpatium Project Simulation student brief
Spatium Project Simulation student brief
 
Mehran University Newsletter Vol-X, Issue-I, 2024
Mehran University Newsletter Vol-X, Issue-I, 2024Mehran University Newsletter Vol-X, Issue-I, 2024
Mehran University Newsletter Vol-X, Issue-I, 2024
 
HMCS Vancouver Pre-Deployment Brief - May 2024 (Web Version).pptx
HMCS Vancouver Pre-Deployment Brief - May 2024 (Web Version).pptxHMCS Vancouver Pre-Deployment Brief - May 2024 (Web Version).pptx
HMCS Vancouver Pre-Deployment Brief - May 2024 (Web Version).pptx
 
Wellbeing inclusion and digital dystopias.pptx
Wellbeing inclusion and digital dystopias.pptxWellbeing inclusion and digital dystopias.pptx
Wellbeing inclusion and digital dystopias.pptx
 
Jamworks pilot and AI at Jisc (20/03/2024)
Jamworks pilot and AI at Jisc (20/03/2024)Jamworks pilot and AI at Jisc (20/03/2024)
Jamworks pilot and AI at Jisc (20/03/2024)
 
TỔNG ÔN TẬP THI VÀO LỚP 10 MÔN TIẾNG ANH NĂM HỌC 2023 - 2024 CÓ ĐÁP ÁN (NGỮ Â...
TỔNG ÔN TẬP THI VÀO LỚP 10 MÔN TIẾNG ANH NĂM HỌC 2023 - 2024 CÓ ĐÁP ÁN (NGỮ Â...TỔNG ÔN TẬP THI VÀO LỚP 10 MÔN TIẾNG ANH NĂM HỌC 2023 - 2024 CÓ ĐÁP ÁN (NGỮ Â...
TỔNG ÔN TẬP THI VÀO LỚP 10 MÔN TIẾNG ANH NĂM HỌC 2023 - 2024 CÓ ĐÁP ÁN (NGỮ Â...
 
Basic Civil Engineering first year Notes- Chapter 4 Building.pptx
Basic Civil Engineering first year Notes- Chapter 4 Building.pptxBasic Civil Engineering first year Notes- Chapter 4 Building.pptx
Basic Civil Engineering first year Notes- Chapter 4 Building.pptx
 
Python Notes for mca i year students osmania university.docx
Python Notes for mca i year students osmania university.docxPython Notes for mca i year students osmania university.docx
Python Notes for mca i year students osmania university.docx
 
SOC 101 Demonstration of Learning Presentation
SOC 101 Demonstration of Learning PresentationSOC 101 Demonstration of Learning Presentation
SOC 101 Demonstration of Learning Presentation
 
2024-NATIONAL-LEARNING-CAMP-AND-OTHER.pptx
2024-NATIONAL-LEARNING-CAMP-AND-OTHER.pptx2024-NATIONAL-LEARNING-CAMP-AND-OTHER.pptx
2024-NATIONAL-LEARNING-CAMP-AND-OTHER.pptx
 
Accessible Digital Futures project (20/03/2024)
Accessible Digital Futures project (20/03/2024)Accessible Digital Futures project (20/03/2024)
Accessible Digital Futures project (20/03/2024)
 
On National Teacher Day, meet the 2024-25 Kenan Fellows
On National Teacher Day, meet the 2024-25 Kenan FellowsOn National Teacher Day, meet the 2024-25 Kenan Fellows
On National Teacher Day, meet the 2024-25 Kenan Fellows
 
Interdisciplinary_Insights_Data_Collection_Methods.pptx
Interdisciplinary_Insights_Data_Collection_Methods.pptxInterdisciplinary_Insights_Data_Collection_Methods.pptx
Interdisciplinary_Insights_Data_Collection_Methods.pptx
 

mean median mode 3

  • 1. PROGRAMME B.COM SUBJECT QUANTITATIVE TECHNIQUE – I SEMESTER III UNIVERSITY VIJAYANAGAR SRI KRISHNADEVARAYA UNIVERSITY, BALLARI SESSION 40
  • 2. RECAP • Missing Frequencies in Mean and Median Under Continuous Series Problems ---- 01
  • 3. LEARNING OBJECTIVES • After reading this chapter, a student will be understand different measures of central tendency and Dispersion, i.e., Arithmetic Mean,Mean,Mode, Geometric and Harmonic mean & Range, Mean Deviation, Standard Deviation, Quartile Deviation, Co efficient of variation
  • 4. LEARNING OUTCOMES • After the Chapter, The Students Shall be able to Differentiate, Determine, and Identify the relationships among Averages under Different Series of Data and too State the Merits and Demerits of Three Measures. The Students will apply Measures of Dispersion to Sample Population Data by Contrasting the Values of Standard Deviation & The Mean Deviation, Synthesizing the Mean,Standard,and Quartile Deviations into a Useful Description of a Set of Data
  • 5. SESSION - 40 • Merits & Demerits of Mean, Median and Mode
  • 6. Merits and Demerits of Mean Merits • It is easy to compute and has a unique value. • It is based on all the observations. • It is well defined. • It is least affected by sampling fluctuations. • It can be used for further statistical analysis. Demerits • The mean is unduly affected by the extreme items (outliers) • It cannot be determined for the qualitative data such as beauty, honesty etc. • It cannot be located by observations on the graphic method
  • 7. Merits and Demerits of Median Merits • It is easy to compute. It can be calculated by mere inspection and by the graphical method • It is not affected by extreme values. • It can be easily located even if the class intervals in the series are unequal. Demerits • It is not amenable to further algebraic treatment • It is a positional average and is based on the middle item • It does not take into account the actual values of the items in the series
  • 8. Merits and Demerits of Mode Merits • It is comparatively easy to understand. • It can be found graphically. • It is easy to locate in some cases by inspection. • It is not affected by extreme values. • It is the simplest descriptive measure of average. Demerits • It is not suitable for further mathematical treatment. • It is an unstable measure as it is affected more by sampling fluctuations. • Mode for the series with unequal class intervals cannot be calculated. • In a bimodal distribution, there are two modal classes and it is difficult to determine the values of the mode.
  • 9. MCQs (i) The most suitable average for qualitative measurement is (a) arithmetic mean (b) median (c) mode (d) geometric mean (e) none of the above (ii) Which average is affected most by the presence of extreme items? (a) median (b) mode (c) arithmetic mean (d) none of the above
  • 10. MCQs (iii) The algebraic sum of deviation of a set of n values from A.M. is (a) n (b) 0 (c) 1 (d) none of the above (iv) Which one of following merits of mean a) It is easy to compute and has a unique value. b) It is based on all the observations. c) It is well defined. d) All of above
  • 11. MCQs 5 . The relationship of empirical between averages a) Some time equal b) Never equal c) Always equal d) None of these
  • 13. REFERENCES • S.P. Gupta, Sultan Chand and Sons Publications, 2017 • S. C. Gupta, Himalaya Publishing House, Fundamentals of Statistics, 2018 • R.S.N Pillai and Bagavathi, S.Chand publications, 2010