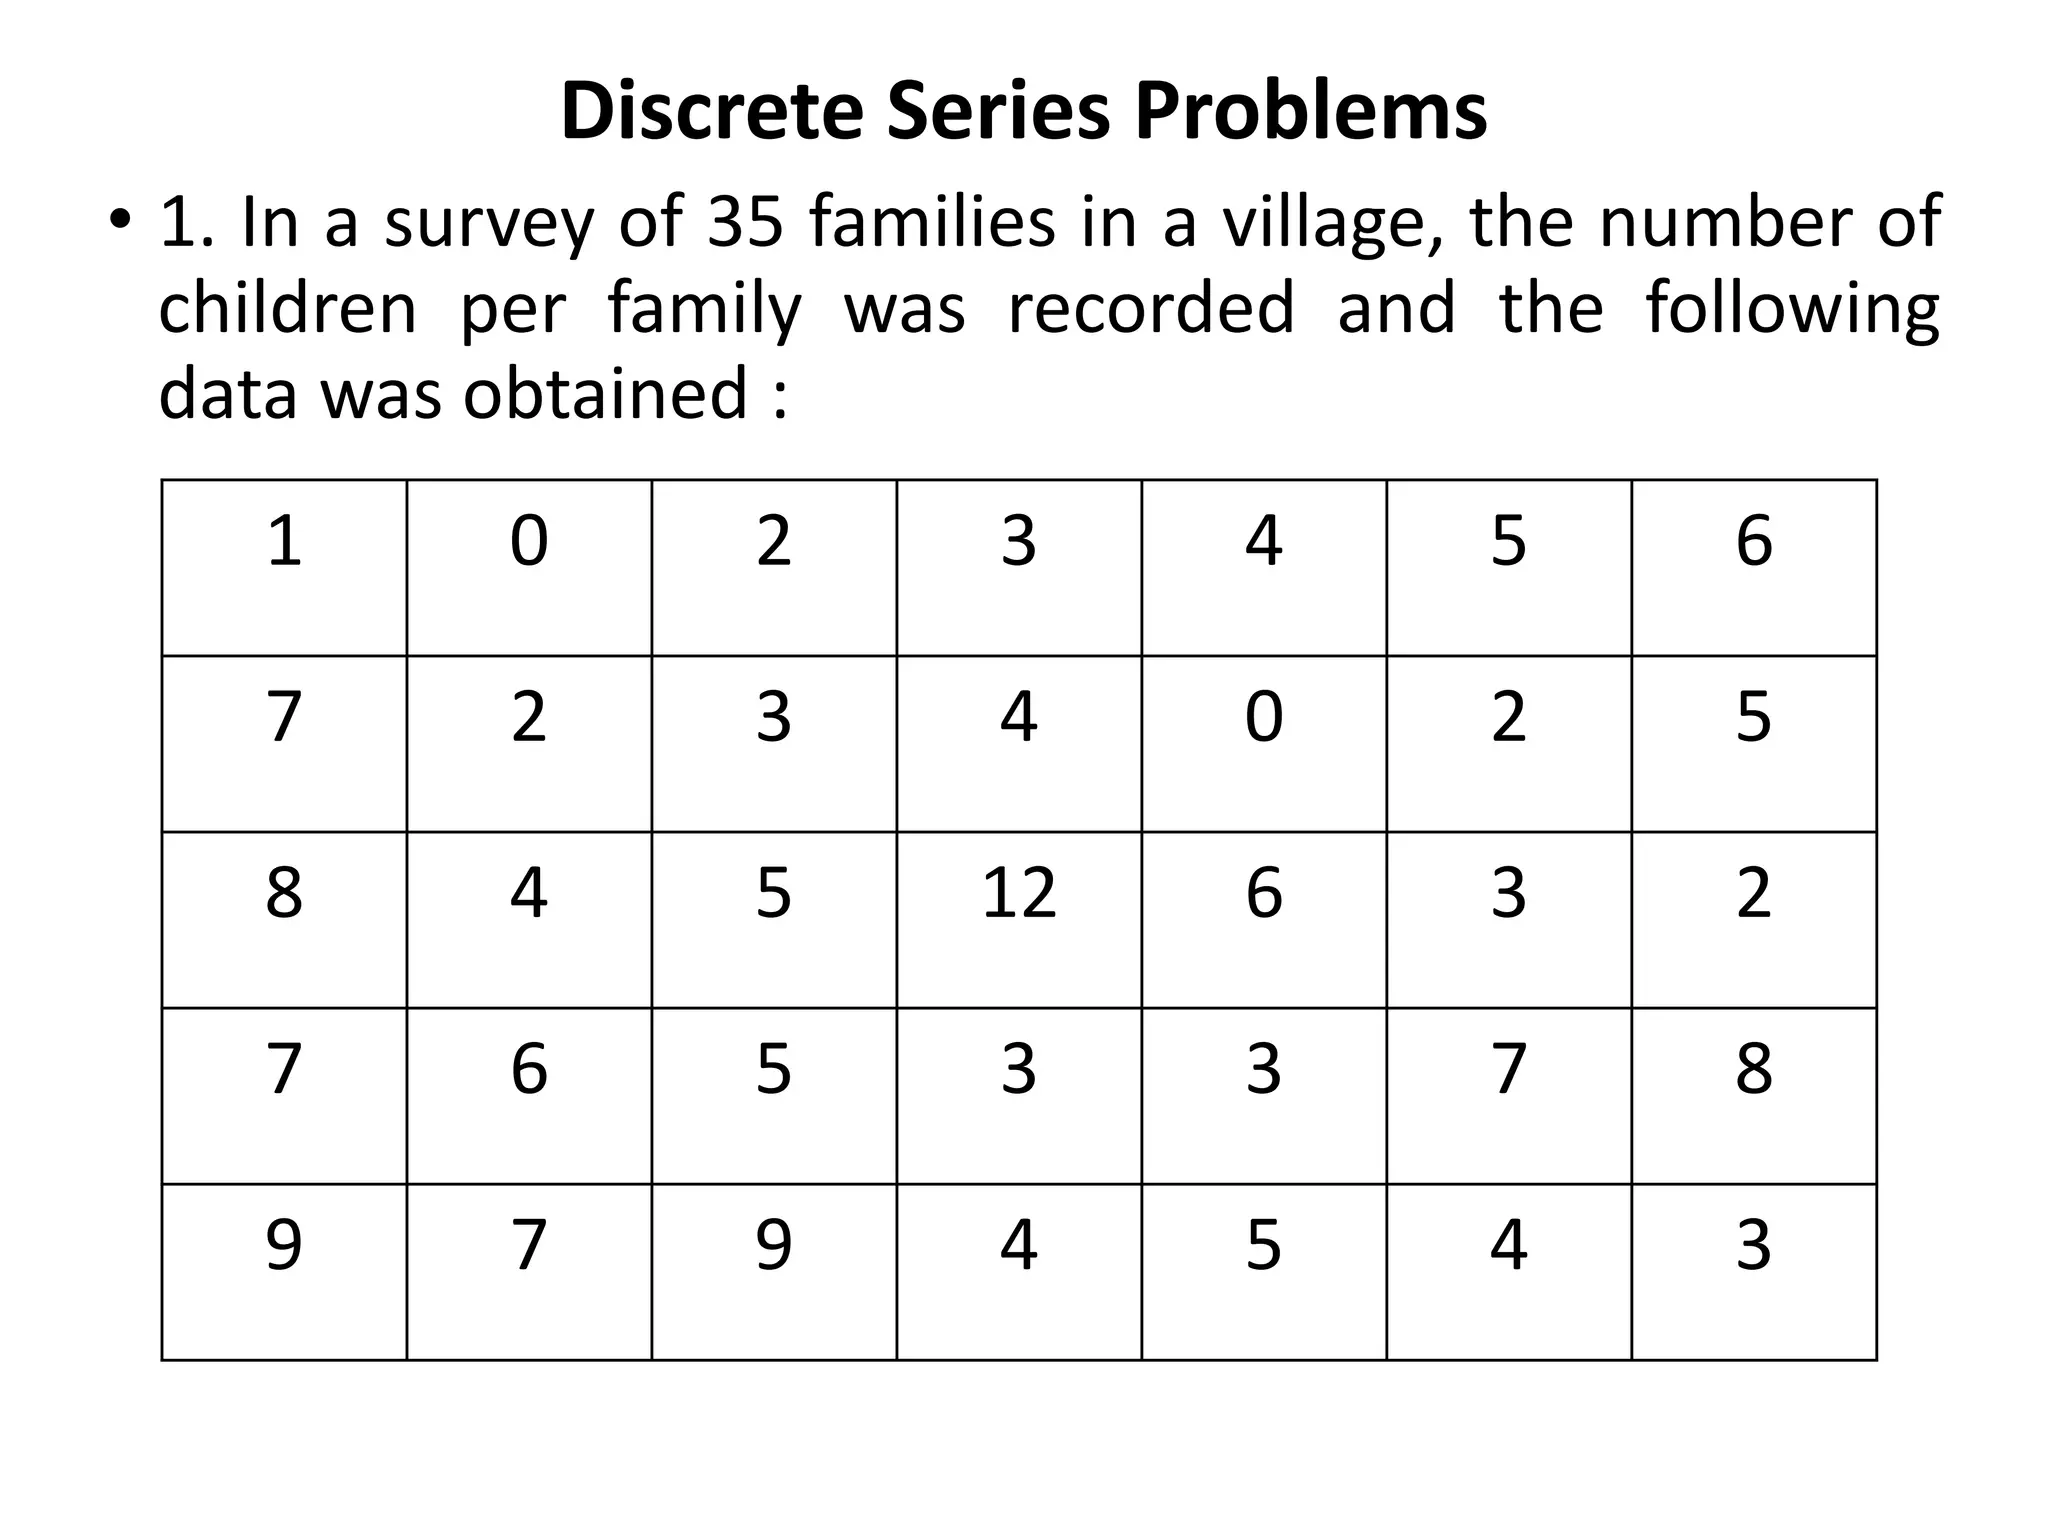
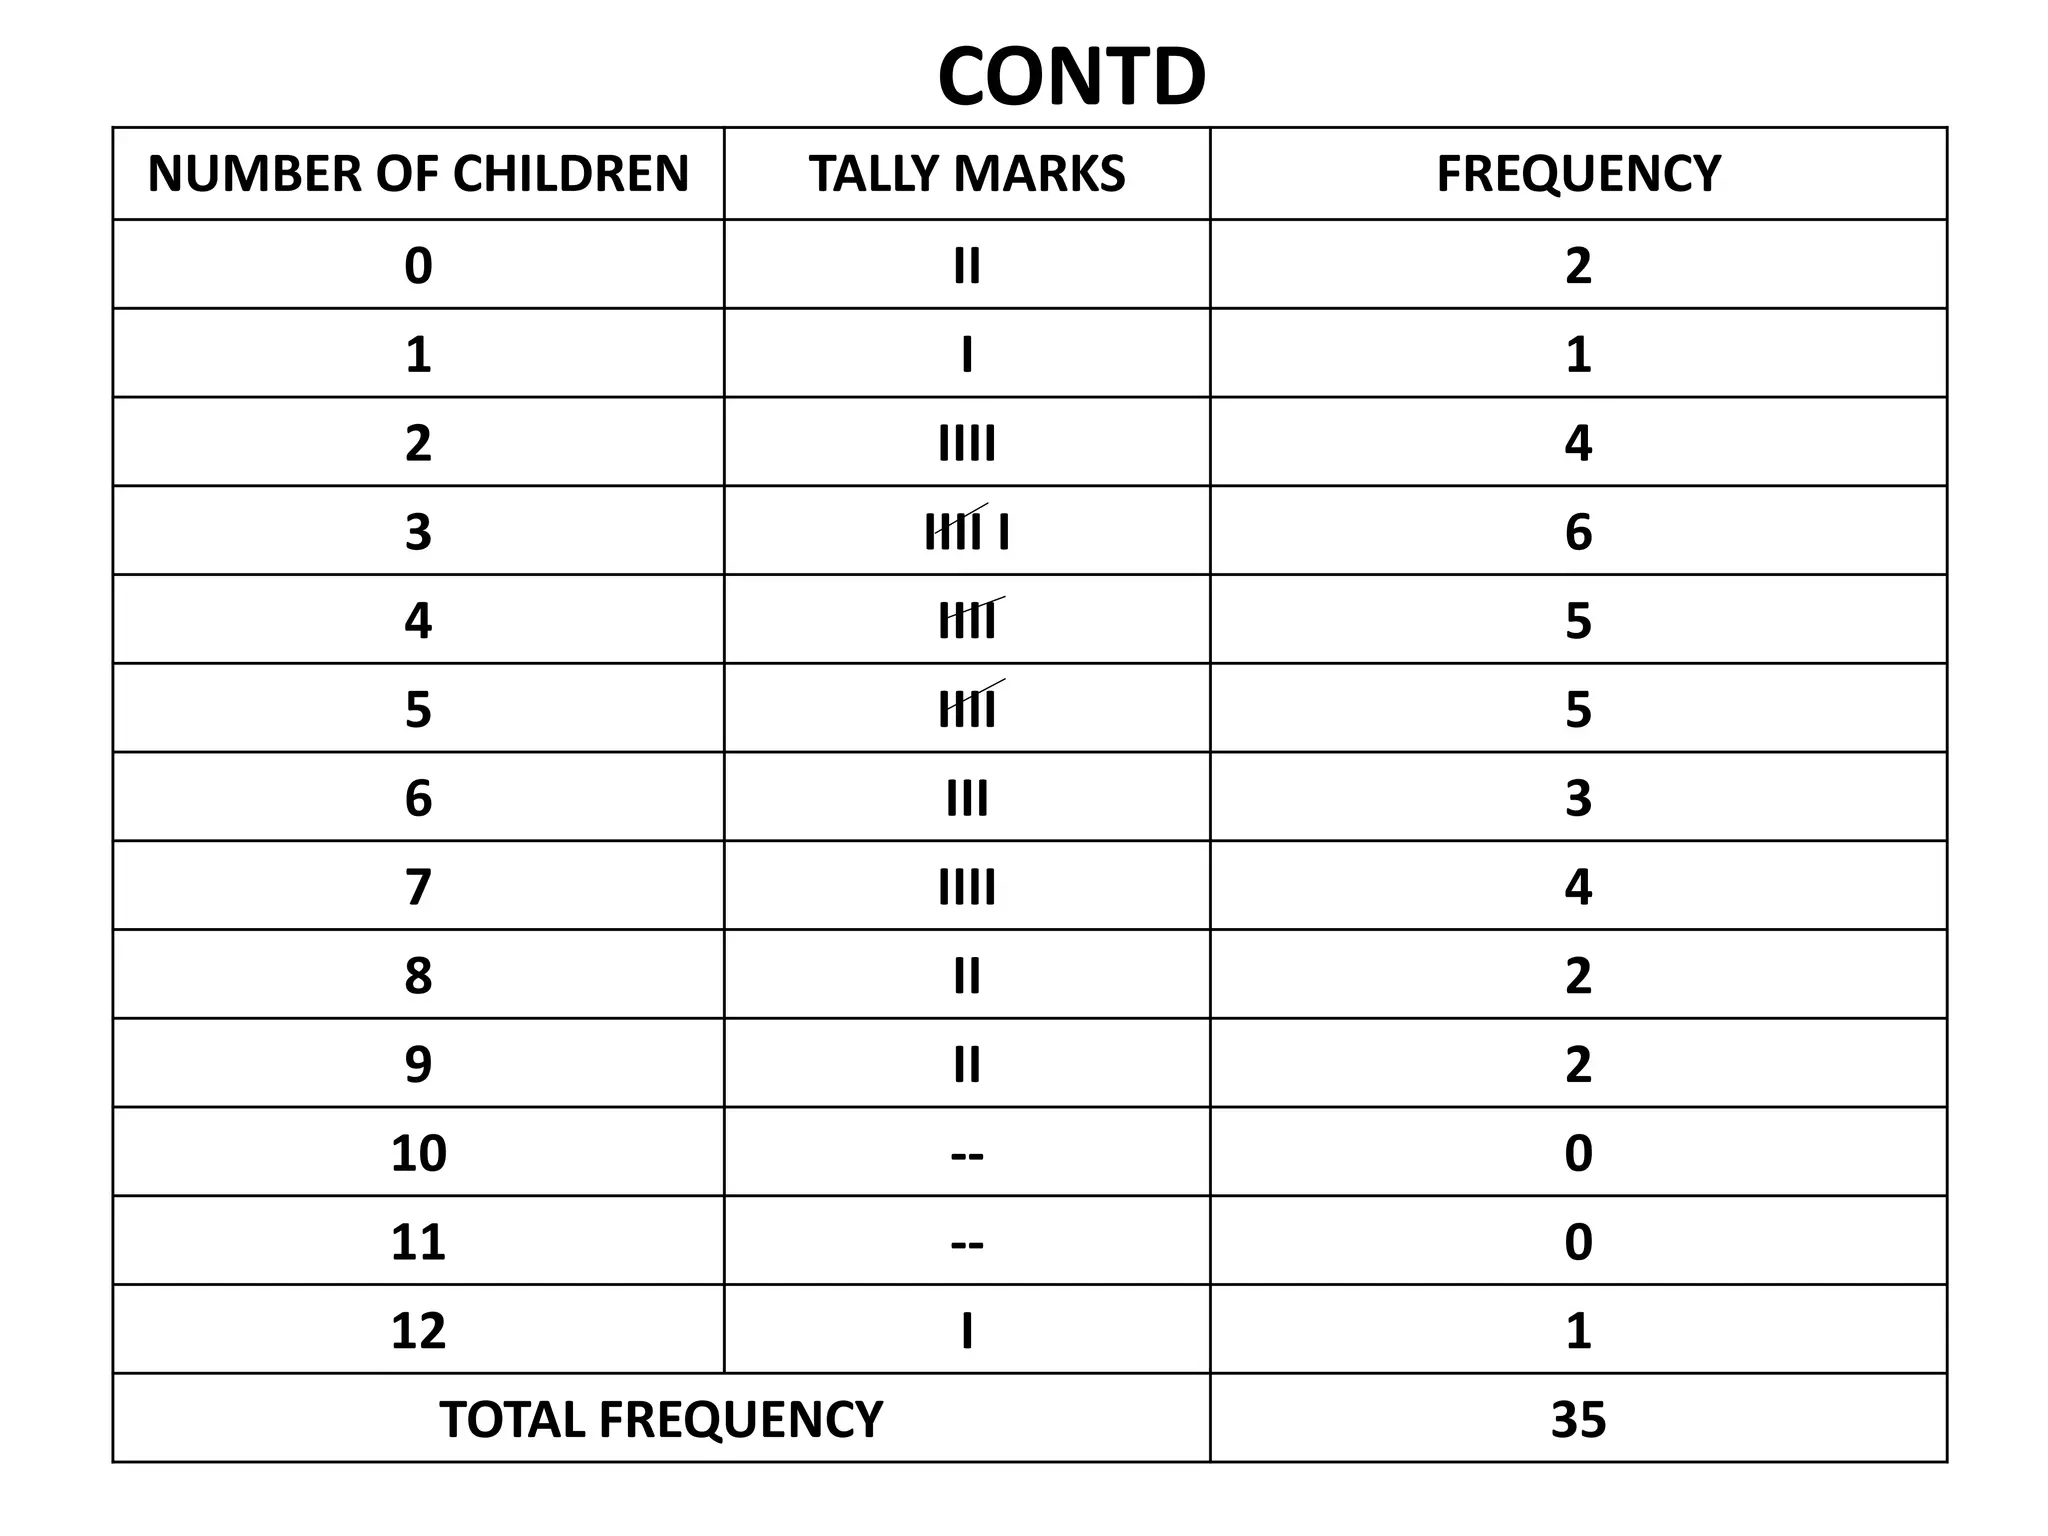
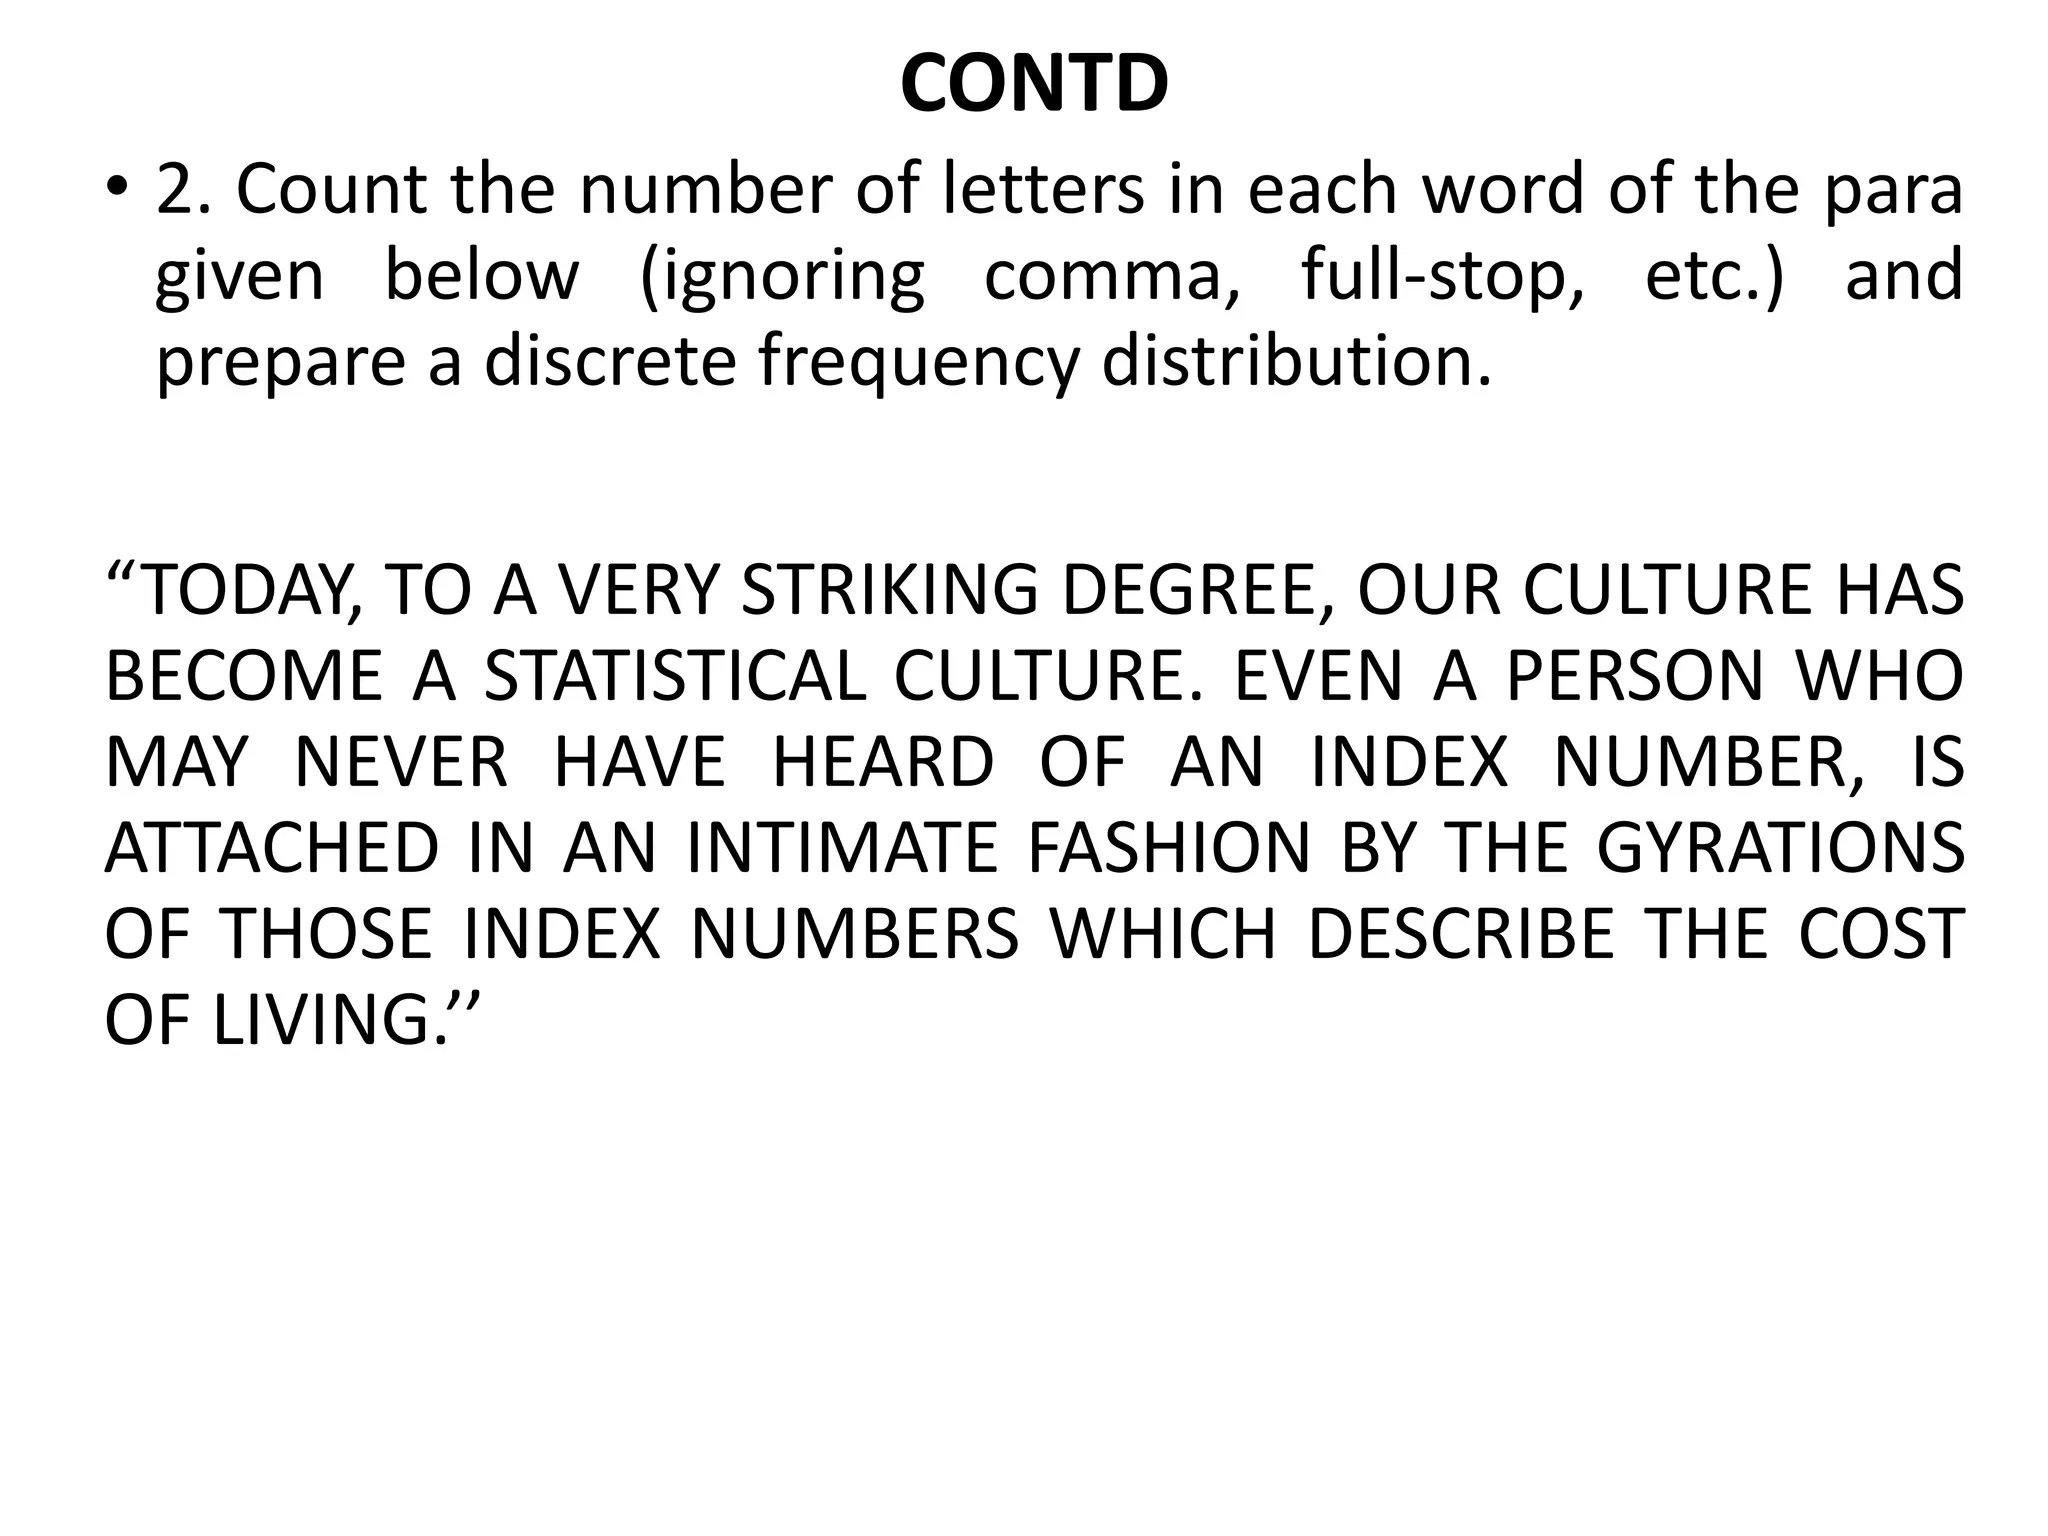
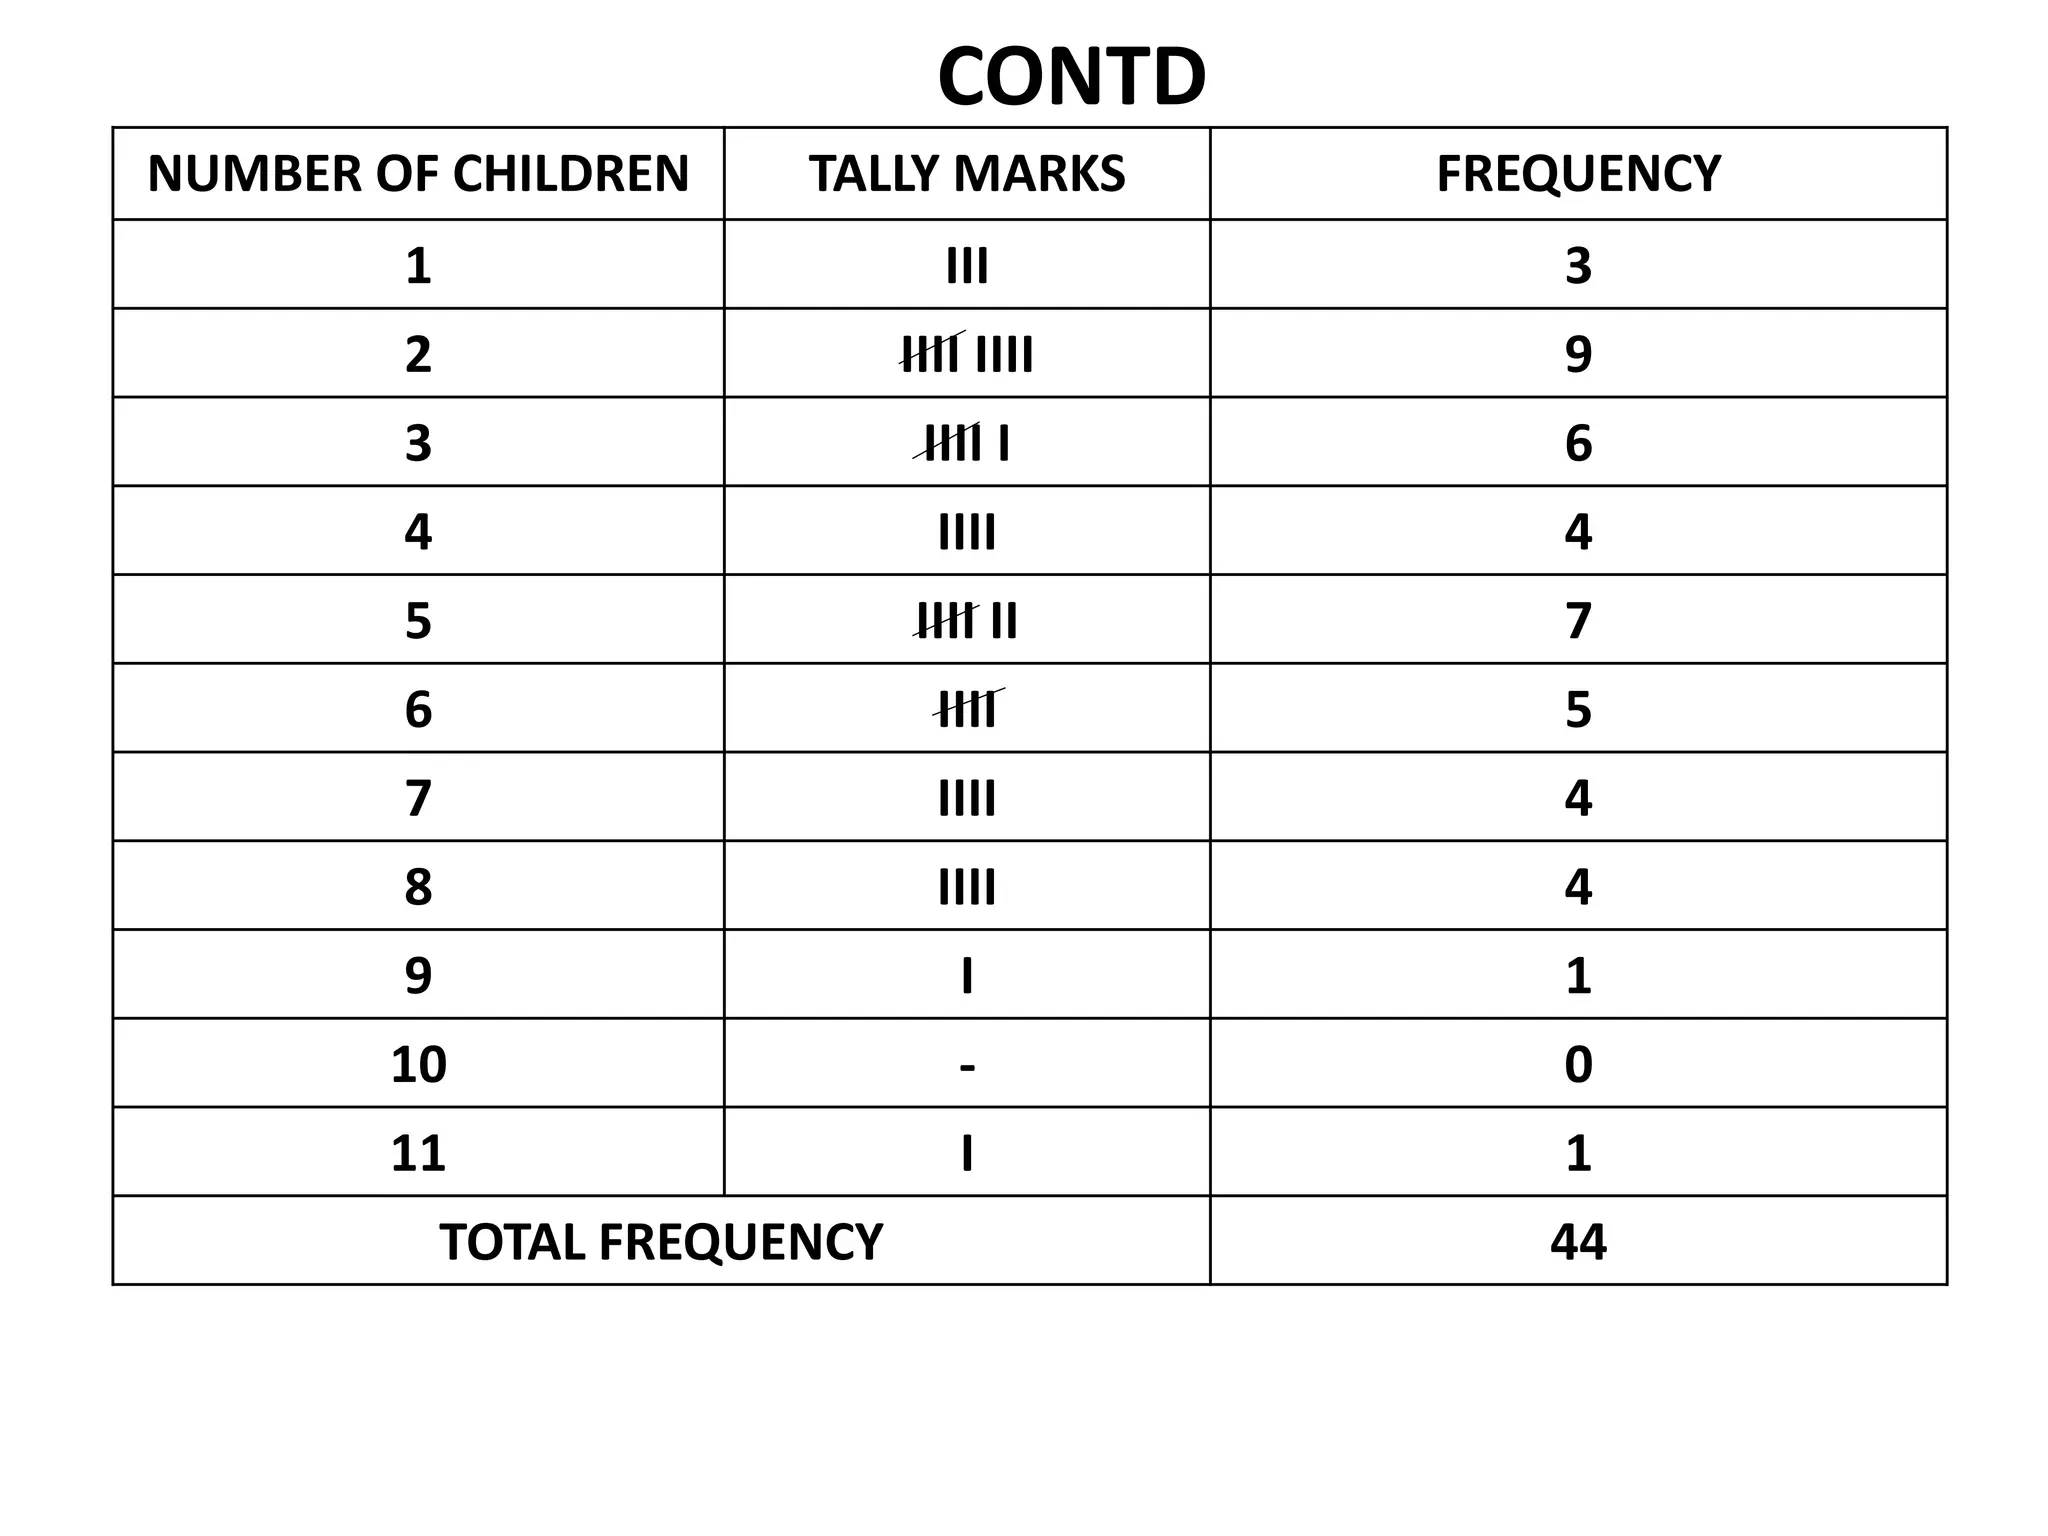
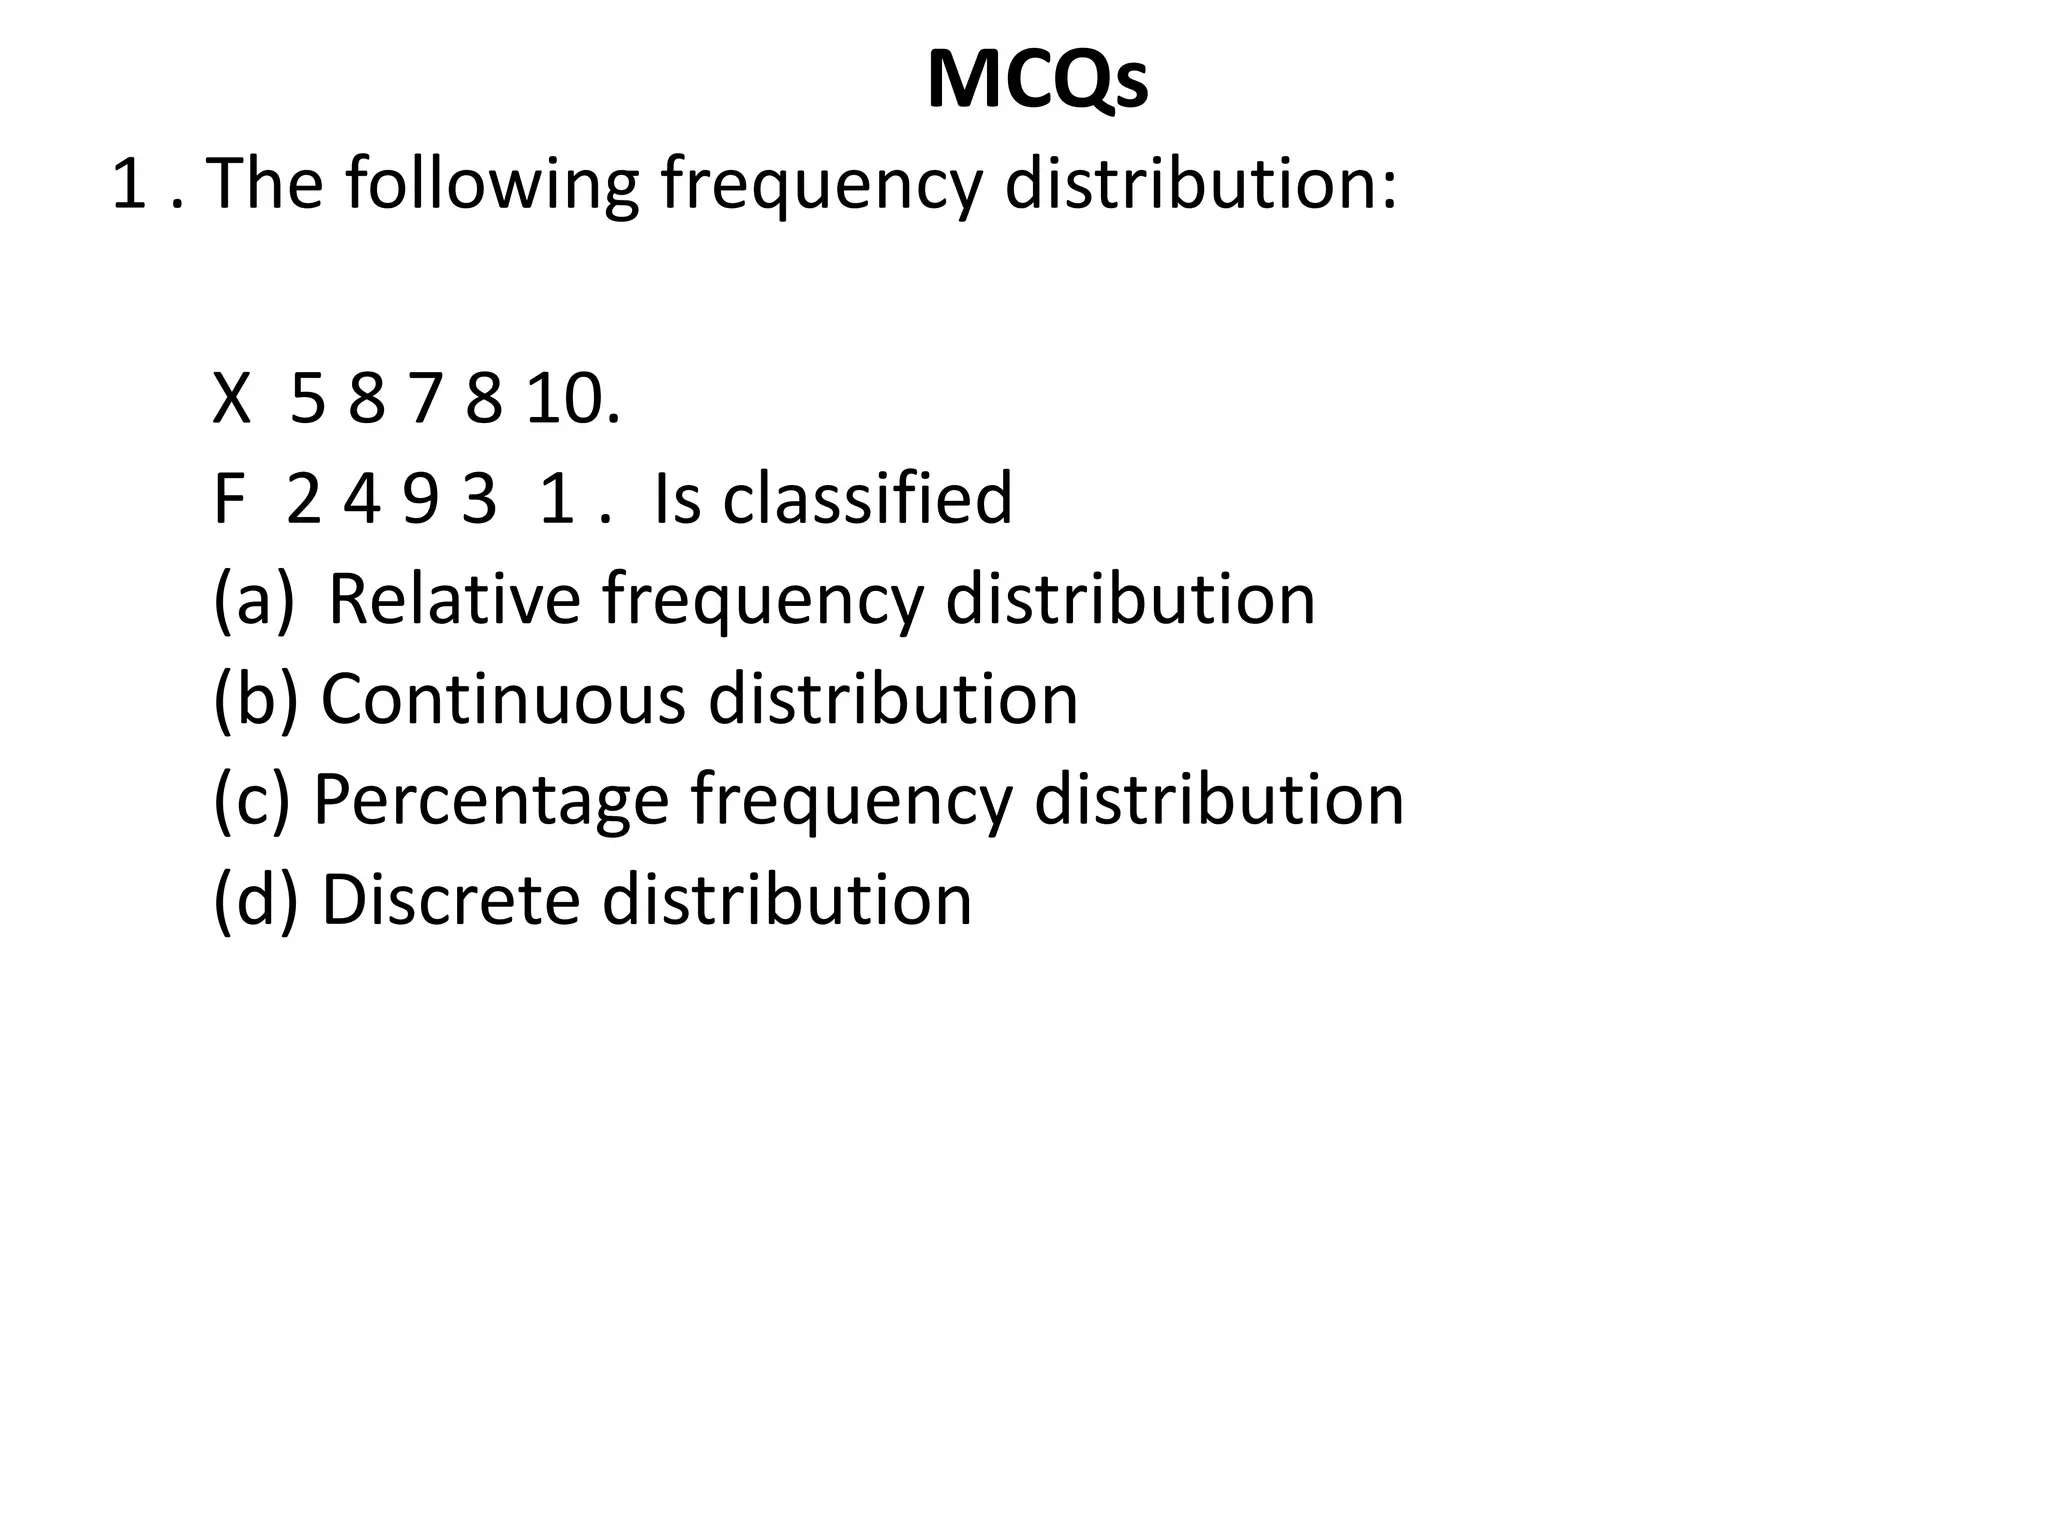
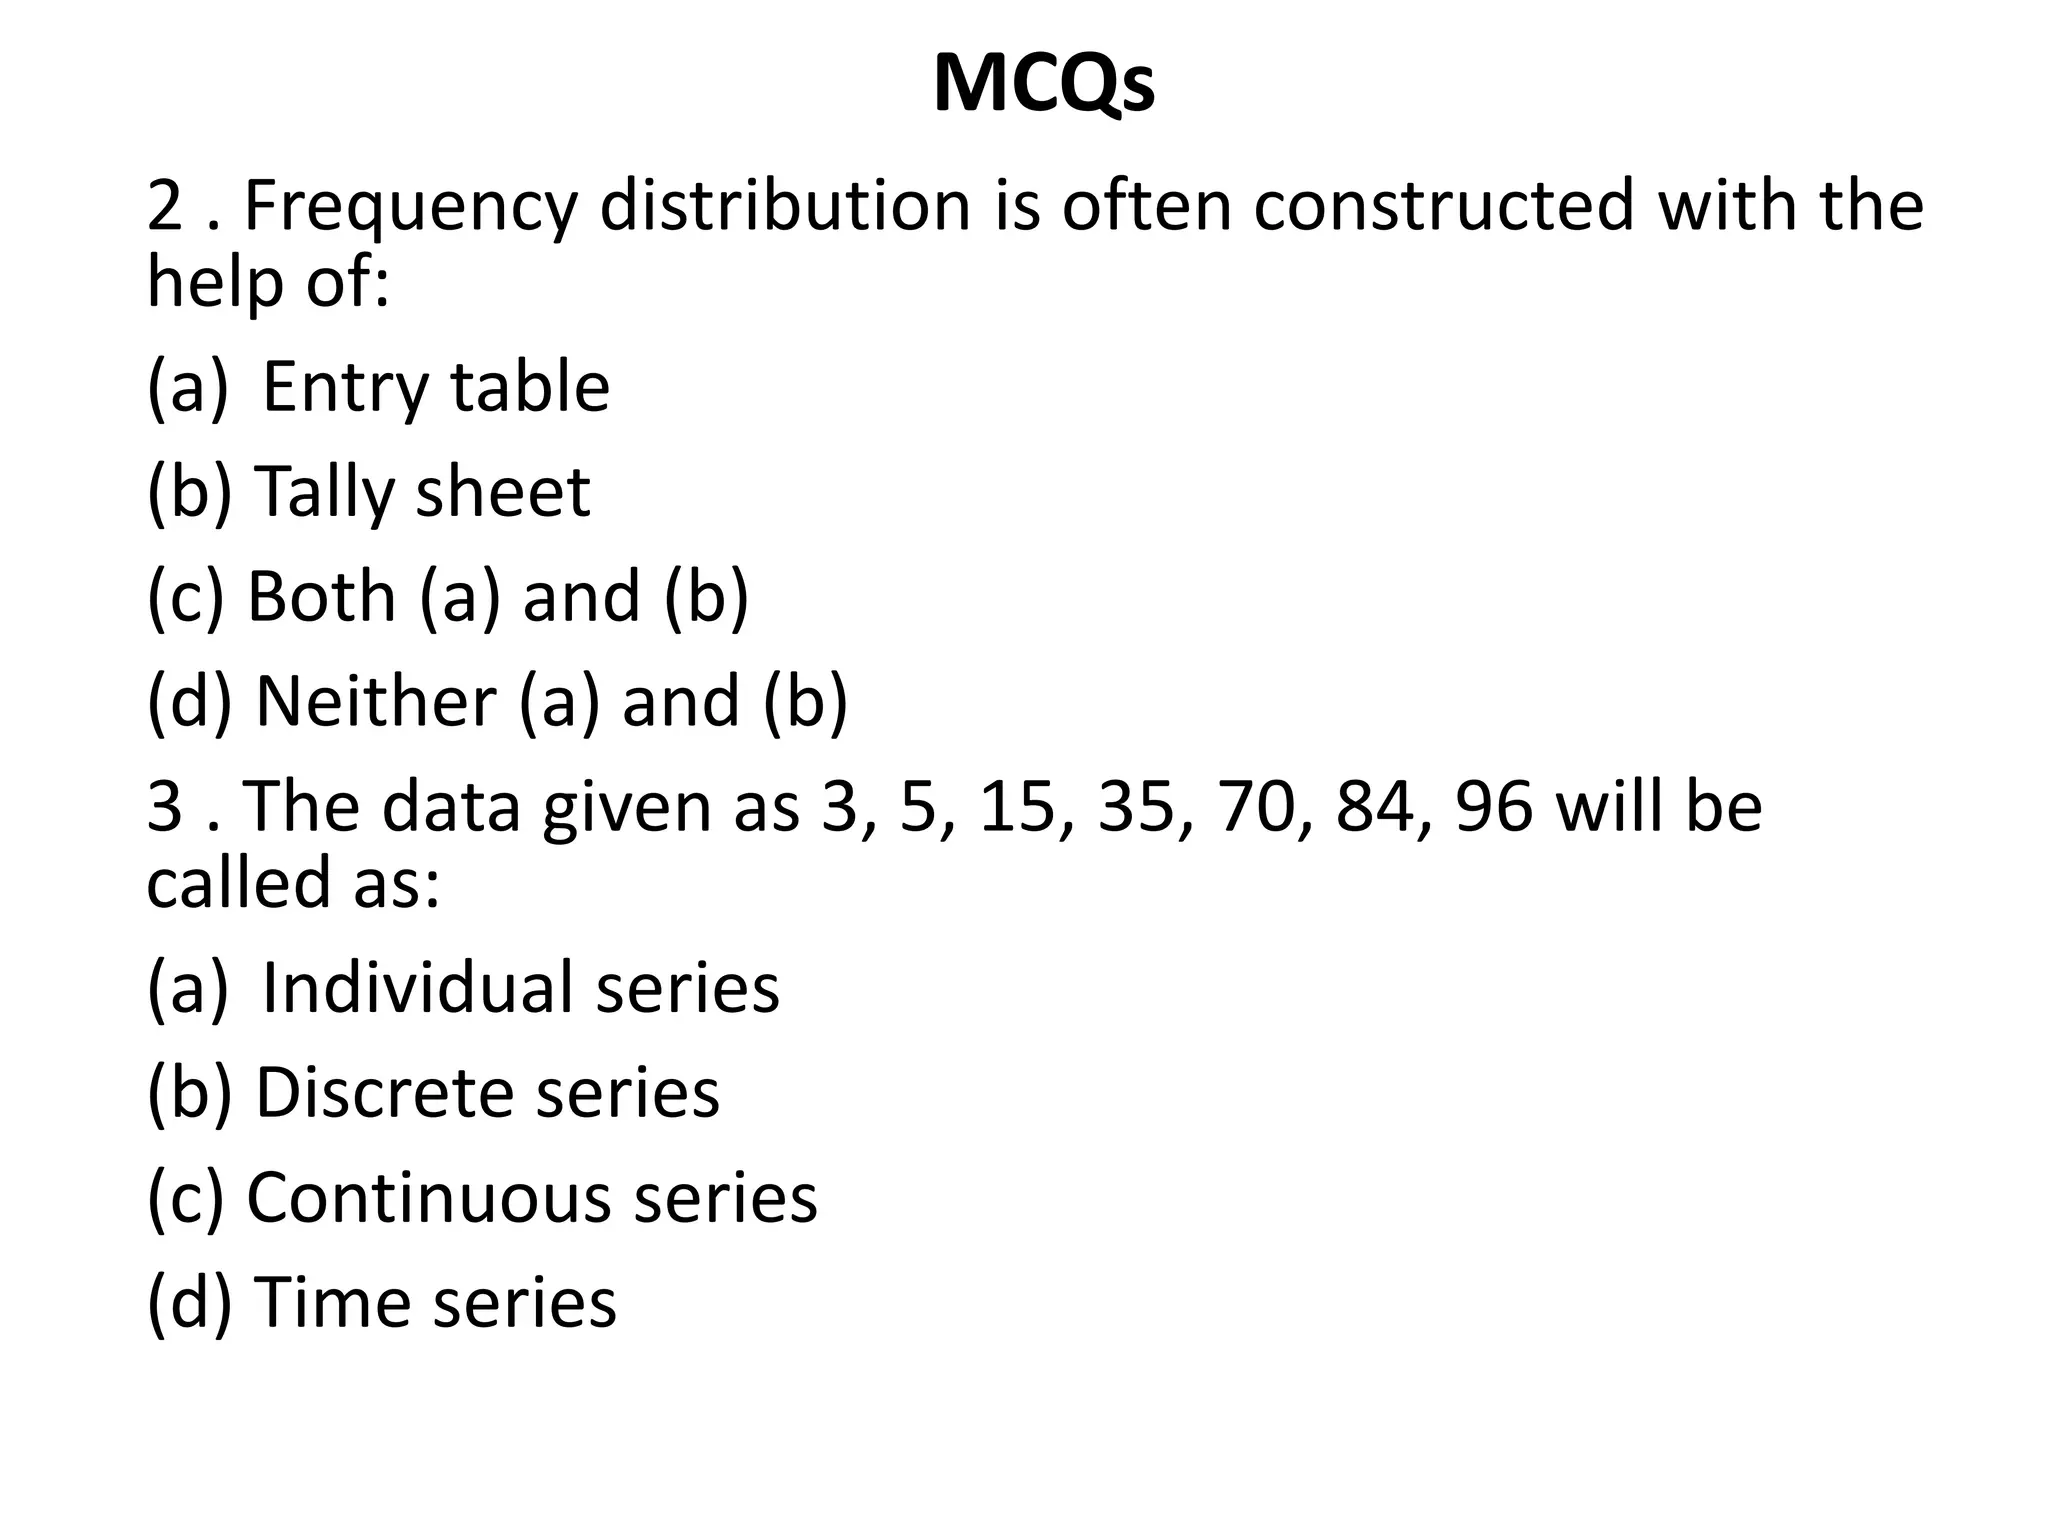
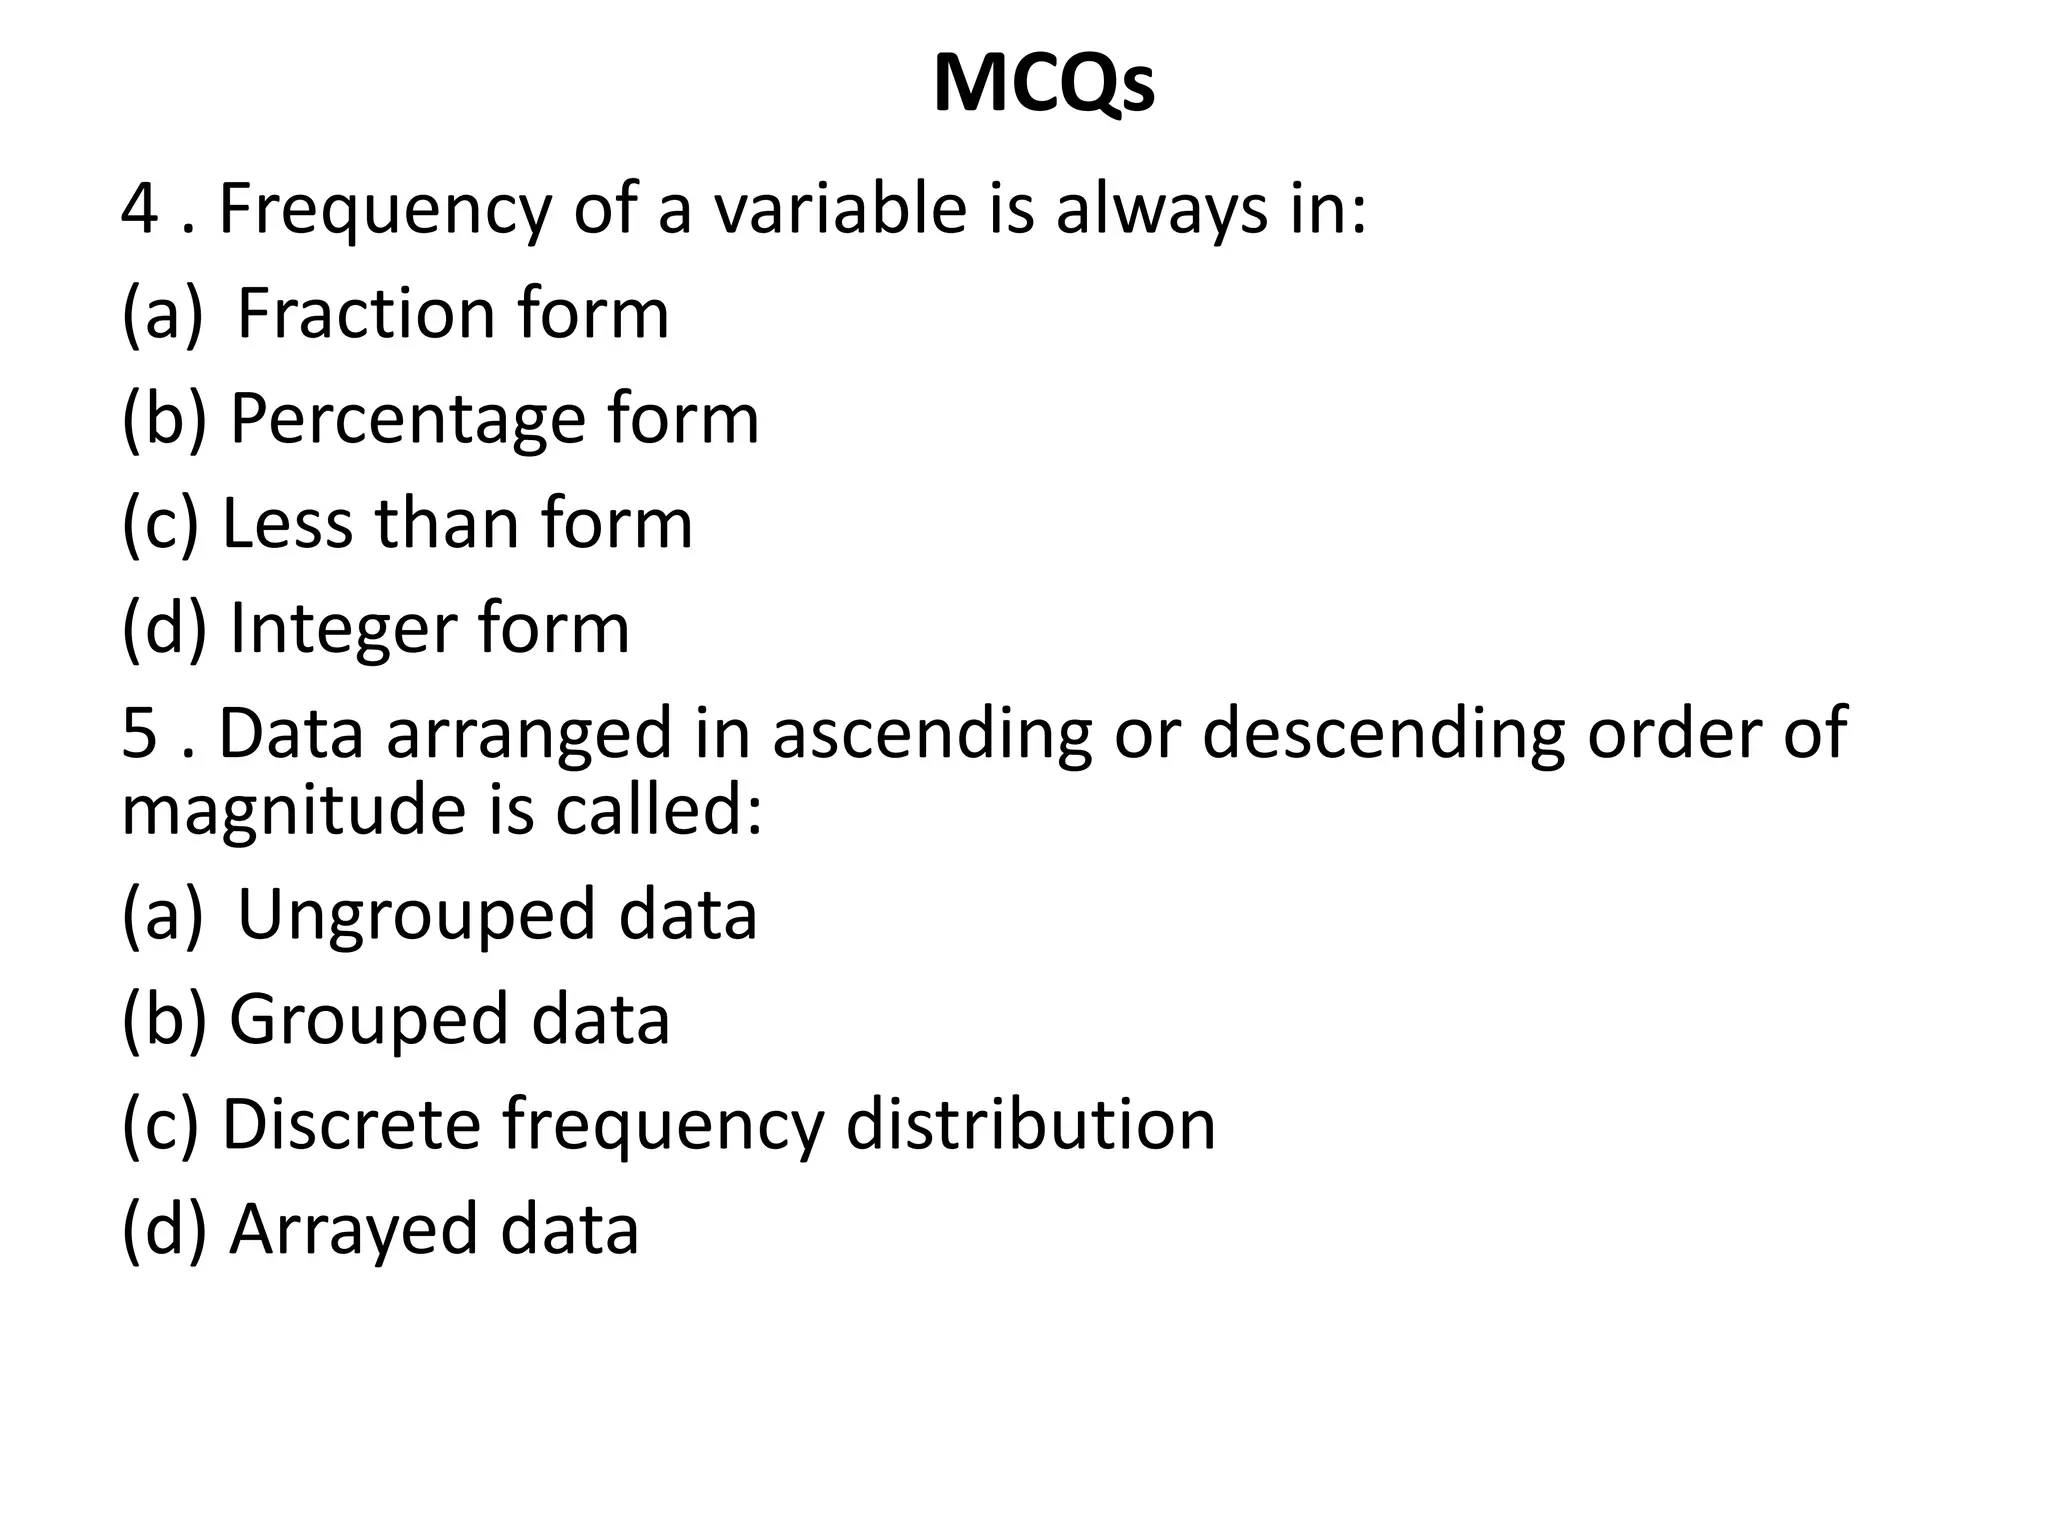
PROGRAMME B.COM
SUBJECT
QUANTITATIVE TECHNIQUE – I
SEMESTER III
UNIVERSITY VIJAYANAGAR SRI
KRISHNADEVARAYA UNIVERSITY,
BALLARI
SESSION 09
RECAP
• Preparation of Frequency Distribution Table
Meaning-- Discrete Series Problems -- 01
LEARNING OBJECTIVES
• The aim of the chapter is to make students to
present data in textual and Tabular format including
the technique of creating frequency distribution
and working out bi-variate distribution table
LEARNING OUTCOMES
• After the Chapter, The Students Shall be able to
Describe and Understand the Rules & Types of
Classification, Frequency Distribution, Class Interval
& its Types, Basic Principles Tabulation and The
Sorting of Data.
SESSION - 9
• Preparation of Frequency Distribution Table
Discrete Series Problems -- 02
Discrete Series Problems
• 1. In a survey of 35 families in a village, the number of
children per family was recorded and the following
data was obtained :
1 0 2 3 4 5 6
7 2 3 4 0 2 5
8 4 5 12 6 3 2
7 6 5 3 3 7 8
9 7 9 4 5 4 3
CONTD
NUMBER OF CHILDREN TALLY MARKS FREQUENCY
0 II 2
1 I 1
2 IIII 4
3 IIII I 6
4 IIII 5
5 IIII 5
6 III 3
7 IIII 4
8 II 2
9 II 2
10 -- 0
11 -- 0
12 I 1
TOTAL FREQUENCY 35
CONTD
• 2. Count the number of letters in each word of the para
given below (ignoring comma, full-stop, etc.) and
prepare a discrete frequency distribution.
“TODAY, TO A VERY STRIKING DEGREE, OUR CULTURE HAS
BECOME A STATISTICAL CULTURE. EVEN A PERSON WHO
MAY NEVER HAVE HEARD OF AN INDEX NUMBER, IS
ATTACHED IN AN INTIMATE FASHION BY THE GYRATIONS
OF THOSE INDEX NUMBERS WHICH DESCRIBE THE COST
OF LIVING.’’
CONTD
NUMBER OF CHILDREN TALLY MARKS FREQUENCY
1 III 3
2 IIII IIII 9
3 IIII I 6
4 IIII 4
5 IIII II 7
6 IIII 5
7 IIII 4
8 IIII 4
9 I 1
10 - 0
11 I 1
TOTAL FREQUENCY 44
SUMMARY
As we already discussed and learnt today on
Classifications and Tabulation as below
• Preparation of Frequency Distribution Table
Discrete Series Problems
MCQs
1 . The following frequency distribution:
X 5 8 7 8 10.
F 2 4 9 3 1 . Is classified
(a) Relative frequency distribution
(b) Continuous distribution
(c) Percentage frequency distribution
(d) Discrete distribution
MCQs
2 . Frequency distribution is often constructed with the
help of:
(a) Entry table
(b) Tally sheet
(c) Both (a) and (b)
(d) Neither (a) and (b)
3 . The data given as 3, 5, 15, 35, 70, 84, 96 will be
called as:
(a) Individual series
(b) Discrete series
(c) Continuous series
(d) Time series
MCQs
4 . Frequency of a variable is always in:
(a) Fraction form
(b) Percentage form
(c) Less than form
(d) Integer form
5 . Data arranged in ascending or descending order of
magnitude is called:
(a) Ungrouped data
(b) Grouped data
(c) Discrete frequency distribution
(d) Arrayed data
CONTD
ANSWERS
1. D
2. C
3. A
4. D
5. D
REFERENCES
• S.P. Gupta, Sultan Chand and Sons Publications, 2017
• S. C. Gupta, Himalaya Publishing House,
Fundamentals of Statistics, 2018
• R.S.N Pillai and Bagavathi, S.Chand publications, 2010
THANK YOU

Frequency Distribution Table 2

  • 1.
    PROGRAMME B.COM SUBJECT QUANTITATIVE TECHNIQUE– I SEMESTER III UNIVERSITY VIJAYANAGAR SRI KRISHNADEVARAYA UNIVERSITY, BALLARI SESSION 09
  • 2.
    RECAP • Preparation ofFrequency Distribution Table Meaning-- Discrete Series Problems -- 01
  • 3.
    LEARNING OBJECTIVES • Theaim of the chapter is to make students to present data in textual and Tabular format including the technique of creating frequency distribution and working out bi-variate distribution table
  • 4.
    LEARNING OUTCOMES • Afterthe Chapter, The Students Shall be able to Describe and Understand the Rules & Types of Classification, Frequency Distribution, Class Interval & its Types, Basic Principles Tabulation and The Sorting of Data.
  • 5.
    SESSION - 9 •Preparation of Frequency Distribution Table Discrete Series Problems -- 02
  • 6.
    Discrete Series Problems •1. In a survey of 35 families in a village, the number of children per family was recorded and the following data was obtained : 1 0 2 3 4 5 6 7 2 3 4 0 2 5 8 4 5 12 6 3 2 7 6 5 3 3 7 8 9 7 9 4 5 4 3
  • 7.
    CONTD NUMBER OF CHILDRENTALLY MARKS FREQUENCY 0 II 2 1 I 1 2 IIII 4 3 IIII I 6 4 IIII 5 5 IIII 5 6 III 3 7 IIII 4 8 II 2 9 II 2 10 -- 0 11 -- 0 12 I 1 TOTAL FREQUENCY 35
  • 8.
    CONTD • 2. Countthe number of letters in each word of the para given below (ignoring comma, full-stop, etc.) and prepare a discrete frequency distribution. “TODAY, TO A VERY STRIKING DEGREE, OUR CULTURE HAS BECOME A STATISTICAL CULTURE. EVEN A PERSON WHO MAY NEVER HAVE HEARD OF AN INDEX NUMBER, IS ATTACHED IN AN INTIMATE FASHION BY THE GYRATIONS OF THOSE INDEX NUMBERS WHICH DESCRIBE THE COST OF LIVING.’’
  • 9.
    CONTD NUMBER OF CHILDRENTALLY MARKS FREQUENCY 1 III 3 2 IIII IIII 9 3 IIII I 6 4 IIII 4 5 IIII II 7 6 IIII 5 7 IIII 4 8 IIII 4 9 I 1 10 - 0 11 I 1 TOTAL FREQUENCY 44
  • 10.
    SUMMARY As we alreadydiscussed and learnt today on Classifications and Tabulation as below • Preparation of Frequency Distribution Table Discrete Series Problems
  • 11.
    MCQs 1 . Thefollowing frequency distribution: X 5 8 7 8 10. F 2 4 9 3 1 . Is classified (a) Relative frequency distribution (b) Continuous distribution (c) Percentage frequency distribution (d) Discrete distribution
  • 12.
    MCQs 2 . Frequencydistribution is often constructed with the help of: (a) Entry table (b) Tally sheet (c) Both (a) and (b) (d) Neither (a) and (b) 3 . The data given as 3, 5, 15, 35, 70, 84, 96 will be called as: (a) Individual series (b) Discrete series (c) Continuous series (d) Time series
  • 13.
    MCQs 4 . Frequencyof a variable is always in: (a) Fraction form (b) Percentage form (c) Less than form (d) Integer form 5 . Data arranged in ascending or descending order of magnitude is called: (a) Ungrouped data (b) Grouped data (c) Discrete frequency distribution (d) Arrayed data
  • 14.
  • 15.
    REFERENCES • S.P. Gupta,Sultan Chand and Sons Publications, 2017 • S. C. Gupta, Himalaya Publishing House, Fundamentals of Statistics, 2018 • R.S.N Pillai and Bagavathi, S.Chand publications, 2010
  • 16.