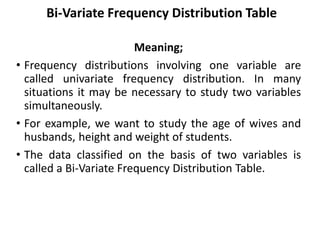
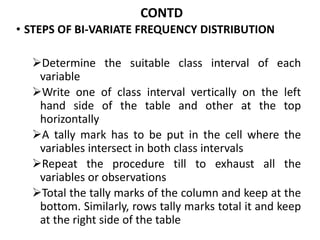
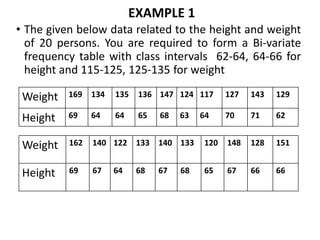
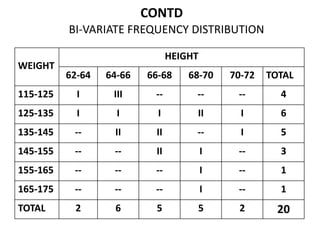
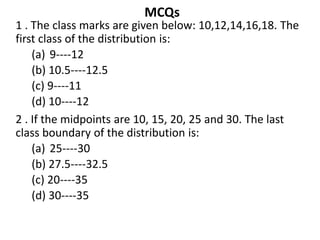
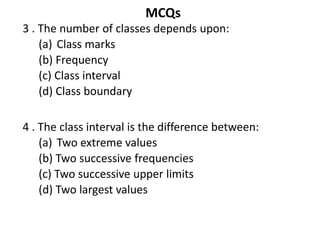
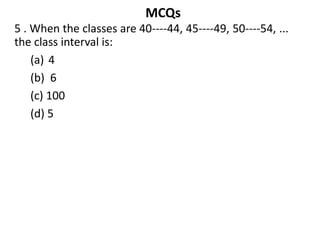
PROGRAMME B.COM
SUBJECT
QUANTITATIVE TECHNIQUE – I
SEMESTER III
UNIVERSITY VIJAYANAGAR SRI
KRISHNADEVARAYA UNIVERSITY,
BALLARI
SESSION 13
RECAP
‱ Preparation of Frequency Distribution Table -
Continuous Series(Inclusive) Problems -03
LEARNING OBJECTIVES
‱ The aim of the chapter is to make students to
present data in textual and Tabular format including
the technique of creating frequency distribution
and working out bi-variate distribution table
LEARNING OUTCOMES
‱ After the Chapter, The Students Shall be able to
Describe and Understand the Rules & Types of
Classification, Frequency Distribution, Class Interval
& its Types, Basic Principles Tabulation and The
Sorting of Data.
SESSION - 13
‱ Bi-Variate Frequency Distribution Table Meaning &
Problems-------- 01
Bi-Variate Frequency Distribution Table
Meaning;
‱ Frequency distributions involving one variable are
called univariate frequency distribution. In many
situations it may be necessary to study two variables
simultaneously.
‱ For example, we want to study the age of wives and
husbands, height and weight of students.
‱ The data classified on the basis of two variables is
called a Bi-Variate Frequency Distribution Table.
CONTD
‱ STEPS OF BI-VARIATE FREQUENCY DISTRIBUTION
Determine the suitable class interval of each
variable
Write one of class interval vertically on the left
hand side of the table and other at the top
horizontally
A tally mark has to be put in the cell where the
variables intersect in both class intervals
Repeat the procedure till to exhaust all the
variables or observations
Total the tally marks of the column and keep at the
bottom. Similarly, rows tally marks total it and keep
at the right side of the table
EXAMPLE 1
‱ The given below data related to the height and weight
of 20 persons. You are required to form a Bi-variate
frequency table with class intervals 62-64, 64-66 for
height and 115-125, 125-135 for weight
Weight 169 134 135 136 147 124 117 127 143 129
Height 69 64 64 65 68 63 64 70 71 62
Weight 162 140 122 133 140 133 120 148 128 151
Height 69 67 64 68 67 68 65 67 66 66
CONTD
BI-VARIATE FREQUENCY DISTRIBUTION
WEIGHT
HEIGHT
62-64 64-66 66-68 68-70 70-72 TOTAL
115-125 I III -- -- -- 4
125-135 I I I II I 6
135-145 -- II II -- I 5
145-155 -- -- II I -- 3
155-165 -- -- -- I -- 1
165-175 -- -- -- I -- 1
TOTAL 2 6 5 5 2 20
SUMMARY
As we already discussed and learnt today on
Classifications and Tabulation as below
‱ Bi-Variate Frequency Distribution Table Meaning &
Problems-------- 01
MCQs
1 . The class marks are given below: 10,12,14,16,18. The
first class of the distribution is:
(a) 9----12
(b) 10.5----12.5
(c) 9----11
(d) 10----12
2 . If the midpoints are 10, 15, 20, 25 and 30. The last
class boundary of the distribution is:
(a) 25----30
(b) 27.5----32.5
(c) 20----35
(d) 30----35
MCQs
3 . The number of classes depends upon:
(a) Class marks
(b) Frequency
(c) Class interval
(d) Class boundary
4 . The class interval is the difference between:
(a) Two extreme values
(b) Two successive frequencies
(c) Two successive upper limits
(d) Two largest values
MCQs
5 . When the classes are 40----44, 45----49, 50----54, ...
the class interval is:
(a) 4
(b) 6
(c) 100
(d) 5
CONTD
ANSWERS
1. C
2. B
3. C
4. C
5. D
REFERENCES
‱ S.P. Gupta, Sultan Chand and Sons Publications, 2017
‱ S. C. Gupta, Himalaya Publishing House,
Fundamentals of Statistics, 2018
‱ R.S.N Pillai and Bagavathi, S.Chand publications, 2010
THANK YOU

Bivariate table 1

  • 1.
    PROGRAMME B.COM SUBJECT QUANTITATIVE TECHNIQUE– I SEMESTER III UNIVERSITY VIJAYANAGAR SRI KRISHNADEVARAYA UNIVERSITY, BALLARI SESSION 13
  • 2.
    RECAP ‱ Preparation ofFrequency Distribution Table - Continuous Series(Inclusive) Problems -03
  • 3.
    LEARNING OBJECTIVES ‱ Theaim of the chapter is to make students to present data in textual and Tabular format including the technique of creating frequency distribution and working out bi-variate distribution table
  • 4.
    LEARNING OUTCOMES ‱ Afterthe Chapter, The Students Shall be able to Describe and Understand the Rules & Types of Classification, Frequency Distribution, Class Interval & its Types, Basic Principles Tabulation and The Sorting of Data.
  • 5.
    SESSION - 13 ‱Bi-Variate Frequency Distribution Table Meaning & Problems-------- 01
  • 6.
    Bi-Variate Frequency DistributionTable Meaning; ‱ Frequency distributions involving one variable are called univariate frequency distribution. In many situations it may be necessary to study two variables simultaneously. ‱ For example, we want to study the age of wives and husbands, height and weight of students. ‱ The data classified on the basis of two variables is called a Bi-Variate Frequency Distribution Table.
  • 7.
    CONTD ‱ STEPS OFBI-VARIATE FREQUENCY DISTRIBUTION Determine the suitable class interval of each variable Write one of class interval vertically on the left hand side of the table and other at the top horizontally A tally mark has to be put in the cell where the variables intersect in both class intervals Repeat the procedure till to exhaust all the variables or observations Total the tally marks of the column and keep at the bottom. Similarly, rows tally marks total it and keep at the right side of the table
  • 8.
    EXAMPLE 1 ‱ Thegiven below data related to the height and weight of 20 persons. You are required to form a Bi-variate frequency table with class intervals 62-64, 64-66 for height and 115-125, 125-135 for weight Weight 169 134 135 136 147 124 117 127 143 129 Height 69 64 64 65 68 63 64 70 71 62 Weight 162 140 122 133 140 133 120 148 128 151 Height 69 67 64 68 67 68 65 67 66 66
  • 9.
    CONTD BI-VARIATE FREQUENCY DISTRIBUTION WEIGHT HEIGHT 62-6464-66 66-68 68-70 70-72 TOTAL 115-125 I III -- -- -- 4 125-135 I I I II I 6 135-145 -- II II -- I 5 145-155 -- -- II I -- 3 155-165 -- -- -- I -- 1 165-175 -- -- -- I -- 1 TOTAL 2 6 5 5 2 20
  • 10.
    SUMMARY As we alreadydiscussed and learnt today on Classifications and Tabulation as below ‱ Bi-Variate Frequency Distribution Table Meaning & Problems-------- 01
  • 11.
    MCQs 1 . Theclass marks are given below: 10,12,14,16,18. The first class of the distribution is: (a) 9----12 (b) 10.5----12.5 (c) 9----11 (d) 10----12 2 . If the midpoints are 10, 15, 20, 25 and 30. The last class boundary of the distribution is: (a) 25----30 (b) 27.5----32.5 (c) 20----35 (d) 30----35
  • 12.
    MCQs 3 . Thenumber of classes depends upon: (a) Class marks (b) Frequency (c) Class interval (d) Class boundary 4 . The class interval is the difference between: (a) Two extreme values (b) Two successive frequencies (c) Two successive upper limits (d) Two largest values
  • 13.
    MCQs 5 . Whenthe classes are 40----44, 45----49, 50----54, ... the class interval is: (a) 4 (b) 6 (c) 100 (d) 5
  • 14.
  • 15.
    REFERENCES ‱ S.P. Gupta,Sultan Chand and Sons Publications, 2017 ‱ S. C. Gupta, Himalaya Publishing House, Fundamentals of Statistics, 2018 ‱ R.S.N Pillai and Bagavathi, S.Chand publications, 2010
  • 16.