SlideShare a Scribd company logo
1 of 16
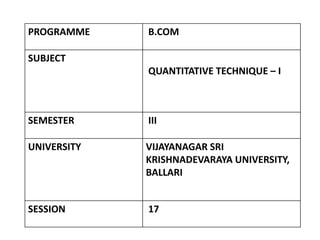
PROGRAMME B.COM
SUBJECT
QUANTITATIVE TECHNIQUE – I
SEMESTER III
UNIVERSITY VIJAYANAGAR SRI
KRISHNADEVARAYA UNIVERSITY,
BALLARI
SESSION 17
RECAP
• Types of Tables, Preparation of Blank Table and
Problems - 01
LEARNING OBJECTIVES
• The aim of the chapter is to make students to
present data in textual and Tabular format including
the technique of creating frequency distribution
and working out bi-variate distribution table
LEARNING OUTCOMES
• After the Chapter, The Students Shall be able to
Describe and Understand the Rules & Types of
Classification, Frequency Distribution, Class Interval
& its Types, Basic Principles Tabulation and The
Sorting of Data.
SESSION - 16
• Present Data in Textual and Tabular Format
Problems--------- 02
Present Data in Textual and Tabular Format
• In a simple study about coffee habit in two towns, the
following information was received.
(I) TOWN A) females were 40%; Total Coffee drinks for
45% and males non coffee drinkers were 20%
(II)TOWN B) males were 55%; males non coffee drinkers
were 30% and female coffee drinkers were 15%
Present the data in a tabular form
CONTD
• The table showing the comparative coffee habits of
two towns according to sex wise
HABITS
TOWN - A TOWN - B
MALE FEMALE TOTAL MALE FEMALE TOTAL
COFFE
DRINKERS
40 05 45 25 15 40
NON
COFFEE
DRINKERS
20 35 55 30 30 60
TOTAL 60 40 100 55 45 100
CONTD
Example 02
• Draft a blank table to show the candidates Sex wise
appearing for degree examination First , Second and
Third Year examination of a University in the faculties
of Arts, Commerce and Science in 2012 & 2013
CONTD
• Distribution of candidate appearing the degree
examination for 2012 & 2013
Faculties Class
2012 2013
BOYS GIRLS TOTAL BOYS GIRLS TOTAL
Arts BA
I, II, III
Commerce B.COM
I,II,III
Science B.SC
I,II,III
SUMMARY
As we already discussed and learnt today on
Classifications and Tabulation as below
• Present Data in Textual and Tabular Format
Problems--------- 02
MCQs
1 . A source note in a statistical table is given:
(a) At the end of a table
(b) In the beginning of a table
(c) In the middle of a table
(d) Below the body of a table
2 . In a statistical table, column captions are called:
(a) Box head
(b) Stub
(c) Body
(d) Title
MCQs
3 . In a statistical table, row captions are called:
(a) Box head
(b) Stub
(c) Body
(d) Title
4 . The headings of the rows of a table are called:
(a) Prefatory notes
(b) Titles
(c) Stubs
(d) Captions
MCQs
5 . The headings of the columns of a table are called:
(a) Stubs
(b) Captions
(c) Footnotes
(d) Source notes
CONTD
ANSWERS
1. A
2. A
3. B
4. C
5. B
REFERENCES
• S.P. Gupta, Sultan Chand and Sons Publications, 2017
• S. C. Gupta, Himalaya Publishing House,
Fundamentals of Statistics, 2018
• R.S.N Pillai and Bagavathi, S.Chand publications, 2010
THANK YOU

More Related Content

Similar to Blank Table 1

Similar to Blank Table 1 (17)

nba ppt for inspection.pptx
nba ppt for inspection.pptxnba ppt for inspection.pptx
nba ppt for inspection.pptx
 
Diagrams part 2
Diagrams part 2Diagrams part 2
Diagrams part 2
 
G7Q4DLL_LC64b.doc
G7Q4DLL_LC64b.docG7Q4DLL_LC64b.doc
G7Q4DLL_LC64b.doc
 
COM-GEN Plan of Study
COM-GEN Plan of StudyCOM-GEN Plan of Study
COM-GEN Plan of Study
 
Bi variate Table 2
Bi variate Table 2Bi variate Table 2
Bi variate Table 2
 
Bi variate frequency distribution table 2
Bi variate frequency distribution table 2Bi variate frequency distribution table 2
Bi variate frequency distribution table 2
 
diagrams theory
diagrams theorydiagrams theory
diagrams theory
 
Bi variate frequency distribution table 1
Bi variate frequency distribution table 1Bi variate frequency distribution table 1
Bi variate frequency distribution table 1
 
Bivariate table 1
Bivariate table 1Bivariate table 1
Bivariate table 1
 
Frequency Distribution Table 3
Frequency Distribution Table 3Frequency Distribution Table 3
Frequency Distribution Table 3
 
frequency distribution table 3
frequency distribution table 3frequency distribution table 3
frequency distribution table 3
 
Frequency Distribution Table 5
Frequency Distribution Table 5Frequency Distribution Table 5
Frequency Distribution Table 5
 
frequency distribution table 5
frequency distribution table 5frequency distribution table 5
frequency distribution table 5
 
Chapter_2_-_Collection_and_Presentation_of_Data-1.pptx
Chapter_2_-_Collection_and_Presentation_of_Data-1.pptxChapter_2_-_Collection_and_Presentation_of_Data-1.pptx
Chapter_2_-_Collection_and_Presentation_of_Data-1.pptx
 
Ri statistik ekonomi_kelompok
Ri statistik ekonomi_kelompokRi statistik ekonomi_kelompok
Ri statistik ekonomi_kelompok
 
graphical representation 3
graphical representation 3graphical representation 3
graphical representation 3
 
EFFECT OF MIND MAPS ON STUDENTS’ INTEREST AND ACHIEVEMENT IN MEASURES OF CENT...
EFFECT OF MIND MAPS ON STUDENTS’ INTEREST AND ACHIEVEMENT IN MEASURES OF CENT...EFFECT OF MIND MAPS ON STUDENTS’ INTEREST AND ACHIEVEMENT IN MEASURES OF CENT...
EFFECT OF MIND MAPS ON STUDENTS’ INTEREST AND ACHIEVEMENT IN MEASURES OF CENT...
 

More from AkkiMaruthi2

More from AkkiMaruthi2 (19)

Classification Theory
Classification Theory Classification Theory
Classification Theory
 
Frequency Distribution Table 4
Frequency Distribution Table 4Frequency Distribution Table 4
Frequency Distribution Table 4
 
Mean, median & mode 2
Mean, median & mode 2Mean, median & mode 2
Mean, median & mode 2
 
KPC skewness 1
KPC skewness 1KPC skewness 1
KPC skewness 1
 
mean median mode 3
mean median mode 3mean median mode 3
mean median mode 3
 
Mean, median & mode 1
Mean, median & mode 1Mean, median & mode 1
Mean, median & mode 1
 
Range, Q.D and Co-efficient 2
Range, Q.D and Co-efficient 2Range, Q.D and Co-efficient 2
Range, Q.D and Co-efficient 2
 
graphical representation 1
graphical representation 1graphical representation 1
graphical representation 1
 
KPC skewness 2
KPC skewness 2KPC skewness 2
KPC skewness 2
 
graphical representation 4
graphical representation 4graphical representation 4
graphical representation 4
 
graphical representation 5
graphical representation 5graphical representation 5
graphical representation 5
 
graphical representation 2
graphical representation 2graphical representation 2
graphical representation 2
 
Measures of Dispersion
Measures of DispersionMeasures of Dispersion
Measures of Dispersion
 
Missing frequency 1
Missing frequency 1Missing frequency 1
Missing frequency 1
 
KPC skewness 2
KPC skewness 2KPC skewness 2
KPC skewness 2
 
Mean Deviation and Co- efficient
Mean Deviation and Co- efficientMean Deviation and Co- efficient
Mean Deviation and Co- efficient
 
graphical representation 6
graphical representation 6graphical representation 6
graphical representation 6
 
Diagrams part 3
Diagrams part 3Diagrams part 3
Diagrams part 3
 
Diagrams part 4
Diagrams part 4Diagrams part 4
Diagrams part 4
 

Recently uploaded

Spellings Wk 3 English CAPS CARES Please Practise
Spellings Wk 3 English CAPS CARES Please PractiseSpellings Wk 3 English CAPS CARES Please Practise
Spellings Wk 3 English CAPS CARES Please Practise
AnaAcapella
 

Recently uploaded (20)

HMCS Max Bernays Pre-Deployment Brief (May 2024).pptx
HMCS Max Bernays Pre-Deployment Brief (May 2024).pptxHMCS Max Bernays Pre-Deployment Brief (May 2024).pptx
HMCS Max Bernays Pre-Deployment Brief (May 2024).pptx
 
UGC NET Paper 1 Mathematical Reasoning & Aptitude.pdf
UGC NET Paper 1 Mathematical Reasoning & Aptitude.pdfUGC NET Paper 1 Mathematical Reasoning & Aptitude.pdf
UGC NET Paper 1 Mathematical Reasoning & Aptitude.pdf
 
HMCS Vancouver Pre-Deployment Brief - May 2024 (Web Version).pptx
HMCS Vancouver Pre-Deployment Brief - May 2024 (Web Version).pptxHMCS Vancouver Pre-Deployment Brief - May 2024 (Web Version).pptx
HMCS Vancouver Pre-Deployment Brief - May 2024 (Web Version).pptx
 
Food safety_Challenges food safety laboratories_.pdf
Food safety_Challenges food safety laboratories_.pdfFood safety_Challenges food safety laboratories_.pdf
Food safety_Challenges food safety laboratories_.pdf
 
Spellings Wk 3 English CAPS CARES Please Practise
Spellings Wk 3 English CAPS CARES Please PractiseSpellings Wk 3 English CAPS CARES Please Practise
Spellings Wk 3 English CAPS CARES Please Practise
 
Google Gemini An AI Revolution in Education.pptx
Google Gemini An AI Revolution in Education.pptxGoogle Gemini An AI Revolution in Education.pptx
Google Gemini An AI Revolution in Education.pptx
 
Graduate Outcomes Presentation Slides - English
Graduate Outcomes Presentation Slides - EnglishGraduate Outcomes Presentation Slides - English
Graduate Outcomes Presentation Slides - English
 
Python Notes for mca i year students osmania university.docx
Python Notes for mca i year students osmania university.docxPython Notes for mca i year students osmania university.docx
Python Notes for mca i year students osmania university.docx
 
Interdisciplinary_Insights_Data_Collection_Methods.pptx
Interdisciplinary_Insights_Data_Collection_Methods.pptxInterdisciplinary_Insights_Data_Collection_Methods.pptx
Interdisciplinary_Insights_Data_Collection_Methods.pptx
 
Mehran University Newsletter Vol-X, Issue-I, 2024
Mehran University Newsletter Vol-X, Issue-I, 2024Mehran University Newsletter Vol-X, Issue-I, 2024
Mehran University Newsletter Vol-X, Issue-I, 2024
 
REMIFENTANIL: An Ultra short acting opioid.pptx
REMIFENTANIL: An Ultra short acting opioid.pptxREMIFENTANIL: An Ultra short acting opioid.pptx
REMIFENTANIL: An Ultra short acting opioid.pptx
 
SOC 101 Demonstration of Learning Presentation
SOC 101 Demonstration of Learning PresentationSOC 101 Demonstration of Learning Presentation
SOC 101 Demonstration of Learning Presentation
 
Basic Civil Engineering first year Notes- Chapter 4 Building.pptx
Basic Civil Engineering first year Notes- Chapter 4 Building.pptxBasic Civil Engineering first year Notes- Chapter 4 Building.pptx
Basic Civil Engineering first year Notes- Chapter 4 Building.pptx
 
Making communications land - Are they received and understood as intended? we...
Making communications land - Are they received and understood as intended? we...Making communications land - Are they received and understood as intended? we...
Making communications land - Are they received and understood as intended? we...
 
Holdier Curriculum Vitae (April 2024).pdf
Holdier Curriculum Vitae (April 2024).pdfHoldier Curriculum Vitae (April 2024).pdf
Holdier Curriculum Vitae (April 2024).pdf
 
Key note speaker Neum_Admir Softic_ENG.pdf
Key note speaker Neum_Admir Softic_ENG.pdfKey note speaker Neum_Admir Softic_ENG.pdf
Key note speaker Neum_Admir Softic_ENG.pdf
 
This PowerPoint helps students to consider the concept of infinity.
This PowerPoint helps students to consider the concept of infinity.This PowerPoint helps students to consider the concept of infinity.
This PowerPoint helps students to consider the concept of infinity.
 
SKILL OF INTRODUCING THE LESSON MICRO SKILLS.pptx
SKILL OF INTRODUCING THE LESSON MICRO SKILLS.pptxSKILL OF INTRODUCING THE LESSON MICRO SKILLS.pptx
SKILL OF INTRODUCING THE LESSON MICRO SKILLS.pptx
 
How to Create and Manage Wizard in Odoo 17
How to Create and Manage Wizard in Odoo 17How to Create and Manage Wizard in Odoo 17
How to Create and Manage Wizard in Odoo 17
 
How to Give a Domain for a Field in Odoo 17
How to Give a Domain for a Field in Odoo 17How to Give a Domain for a Field in Odoo 17
How to Give a Domain for a Field in Odoo 17
 

Blank Table 1

  • 1. PROGRAMME B.COM SUBJECT QUANTITATIVE TECHNIQUE – I SEMESTER III UNIVERSITY VIJAYANAGAR SRI KRISHNADEVARAYA UNIVERSITY, BALLARI SESSION 17
  • 2. RECAP • Types of Tables, Preparation of Blank Table and Problems - 01
  • 3. LEARNING OBJECTIVES • The aim of the chapter is to make students to present data in textual and Tabular format including the technique of creating frequency distribution and working out bi-variate distribution table
  • 4. LEARNING OUTCOMES • After the Chapter, The Students Shall be able to Describe and Understand the Rules & Types of Classification, Frequency Distribution, Class Interval & its Types, Basic Principles Tabulation and The Sorting of Data.
  • 5. SESSION - 16 • Present Data in Textual and Tabular Format Problems--------- 02
  • 6. Present Data in Textual and Tabular Format • In a simple study about coffee habit in two towns, the following information was received. (I) TOWN A) females were 40%; Total Coffee drinks for 45% and males non coffee drinkers were 20% (II)TOWN B) males were 55%; males non coffee drinkers were 30% and female coffee drinkers were 15% Present the data in a tabular form
  • 7. CONTD • The table showing the comparative coffee habits of two towns according to sex wise HABITS TOWN - A TOWN - B MALE FEMALE TOTAL MALE FEMALE TOTAL COFFE DRINKERS 40 05 45 25 15 40 NON COFFEE DRINKERS 20 35 55 30 30 60 TOTAL 60 40 100 55 45 100
  • 8. CONTD Example 02 • Draft a blank table to show the candidates Sex wise appearing for degree examination First , Second and Third Year examination of a University in the faculties of Arts, Commerce and Science in 2012 & 2013
  • 9. CONTD • Distribution of candidate appearing the degree examination for 2012 & 2013 Faculties Class 2012 2013 BOYS GIRLS TOTAL BOYS GIRLS TOTAL Arts BA I, II, III Commerce B.COM I,II,III Science B.SC I,II,III
  • 10. SUMMARY As we already discussed and learnt today on Classifications and Tabulation as below • Present Data in Textual and Tabular Format Problems--------- 02
  • 11. MCQs 1 . A source note in a statistical table is given: (a) At the end of a table (b) In the beginning of a table (c) In the middle of a table (d) Below the body of a table 2 . In a statistical table, column captions are called: (a) Box head (b) Stub (c) Body (d) Title
  • 12. MCQs 3 . In a statistical table, row captions are called: (a) Box head (b) Stub (c) Body (d) Title 4 . The headings of the rows of a table are called: (a) Prefatory notes (b) Titles (c) Stubs (d) Captions
  • 13. MCQs 5 . The headings of the columns of a table are called: (a) Stubs (b) Captions (c) Footnotes (d) Source notes
  • 15. REFERENCES • S.P. Gupta, Sultan Chand and Sons Publications, 2017 • S. C. Gupta, Himalaya Publishing House, Fundamentals of Statistics, 2018 • R.S.N Pillai and Bagavathi, S.Chand publications, 2010