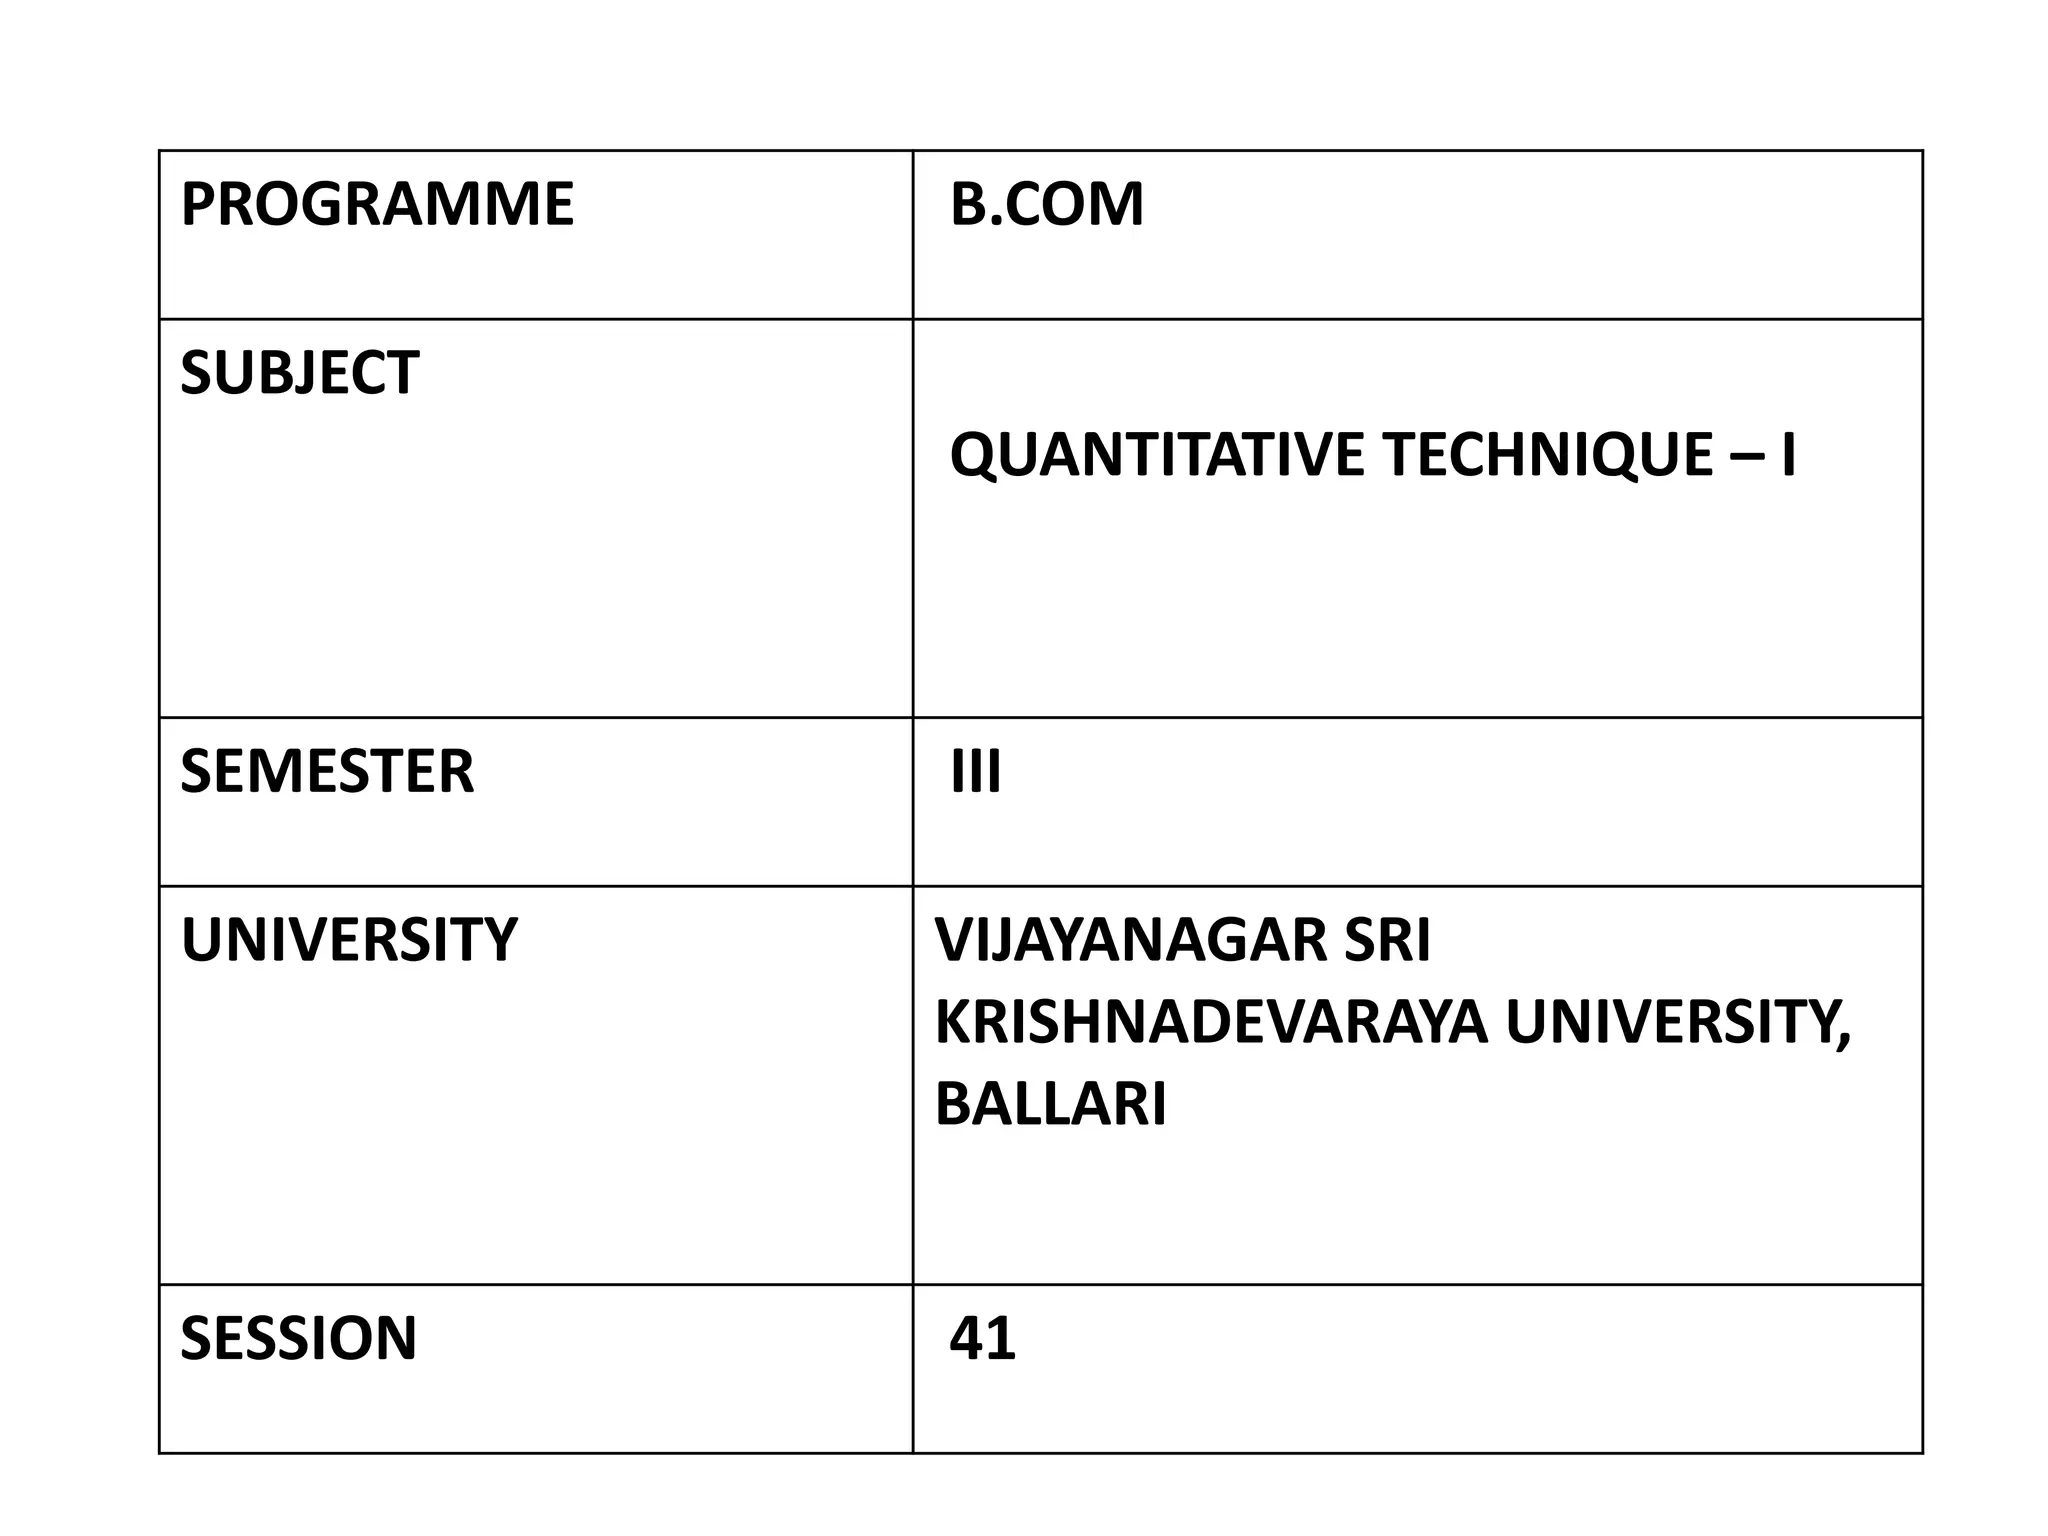
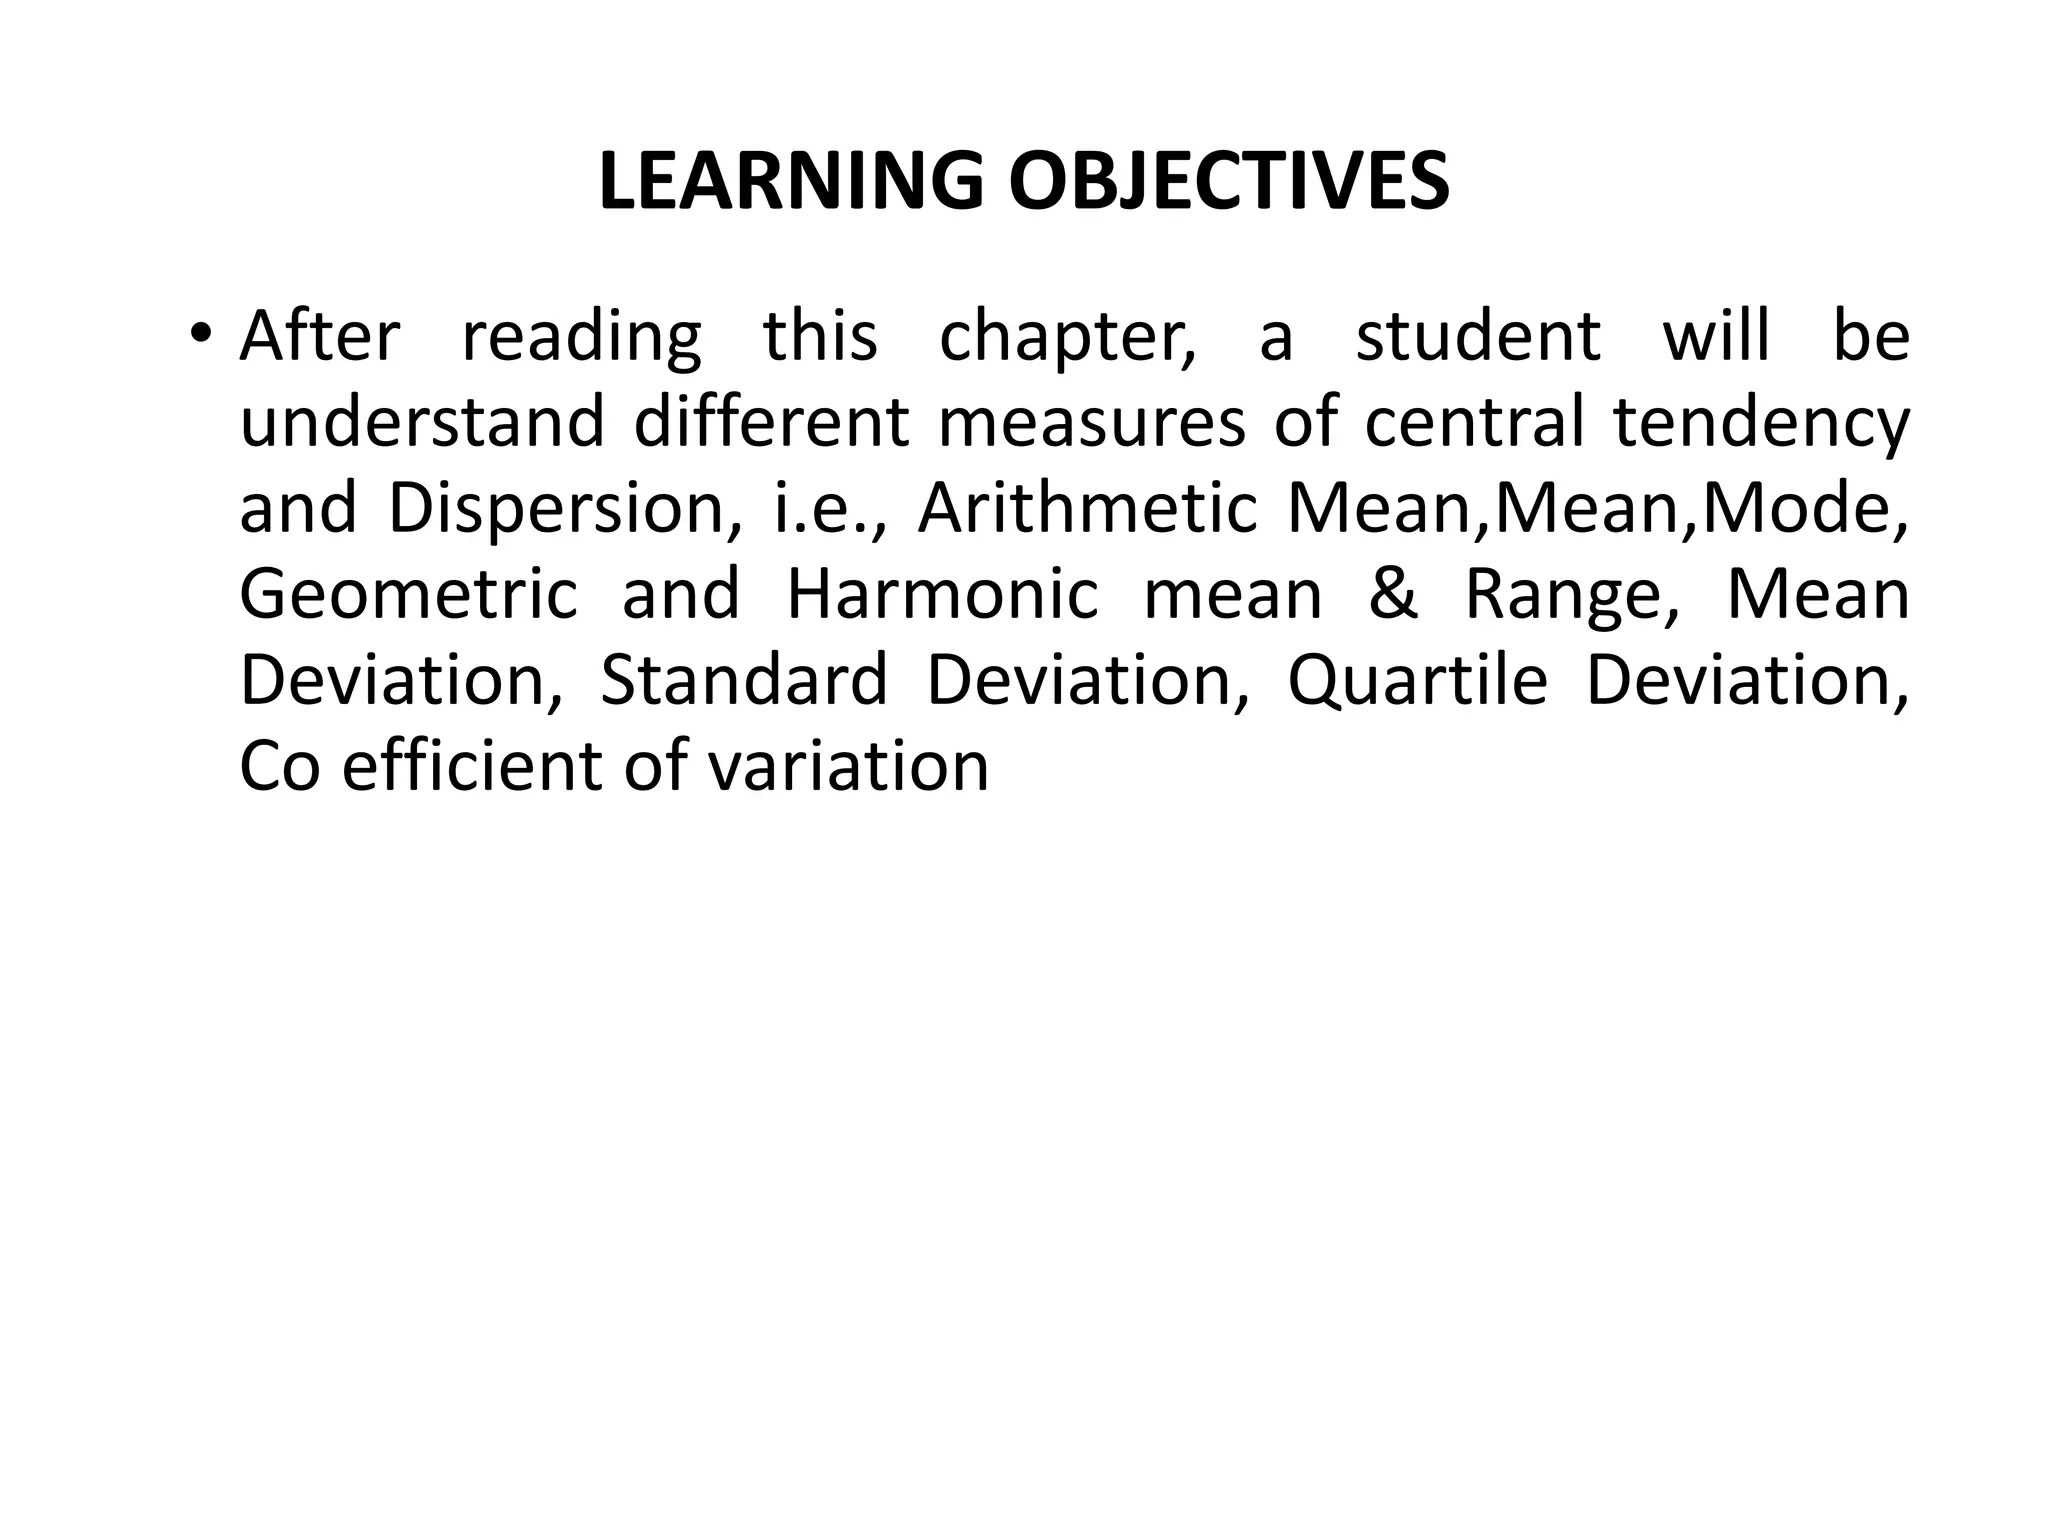
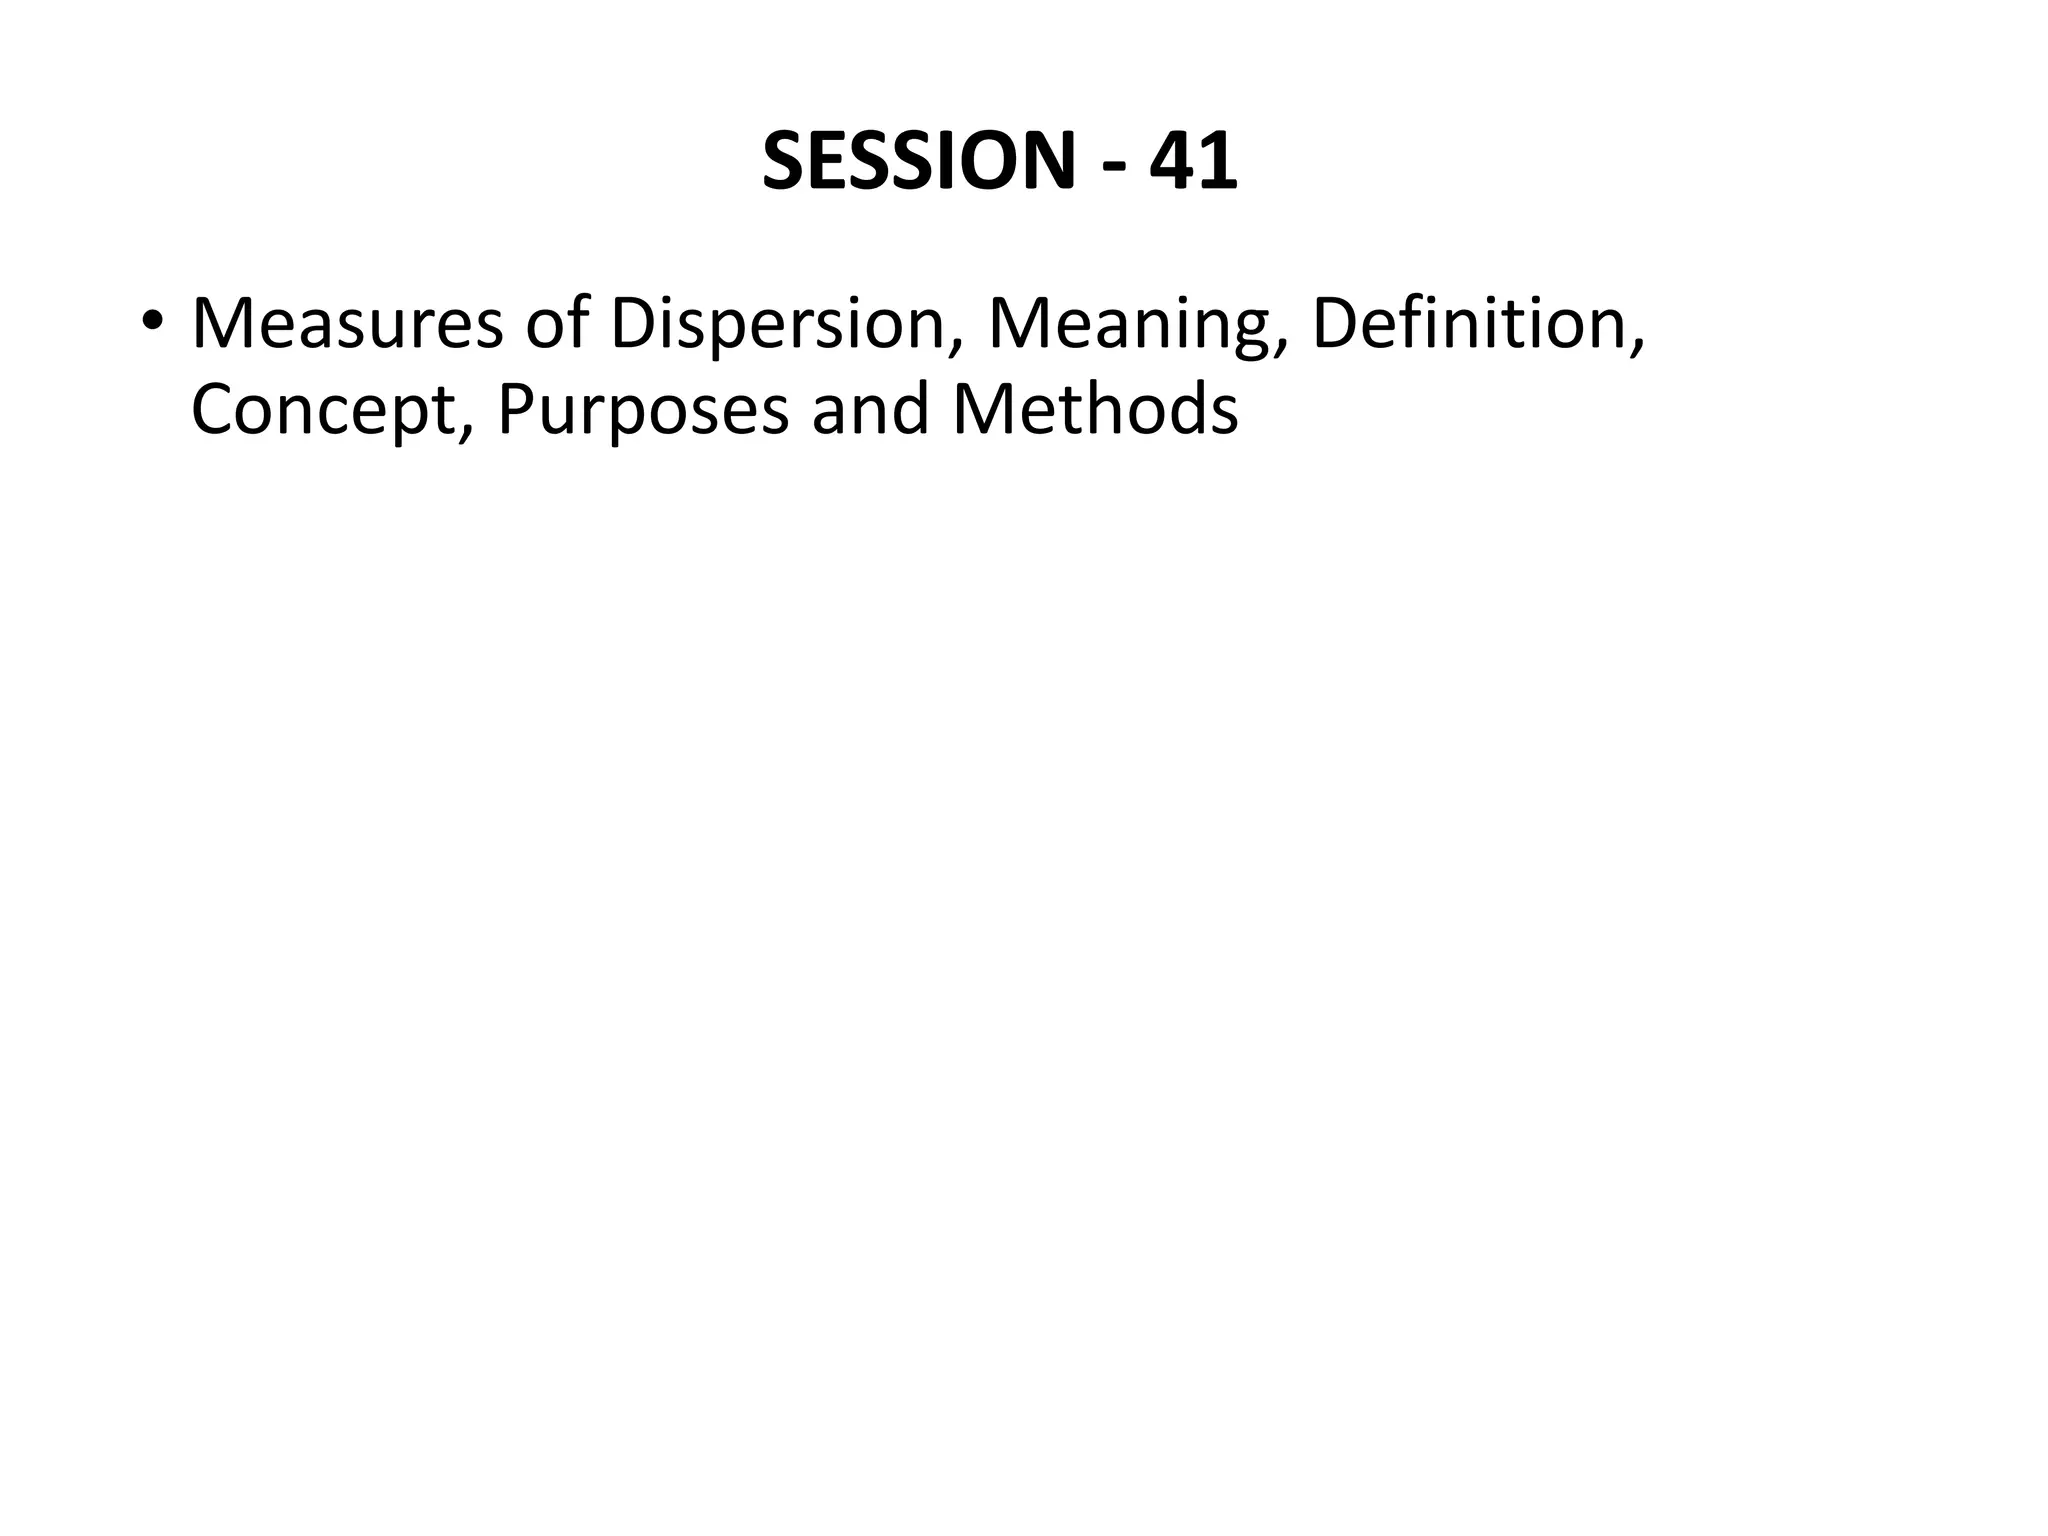
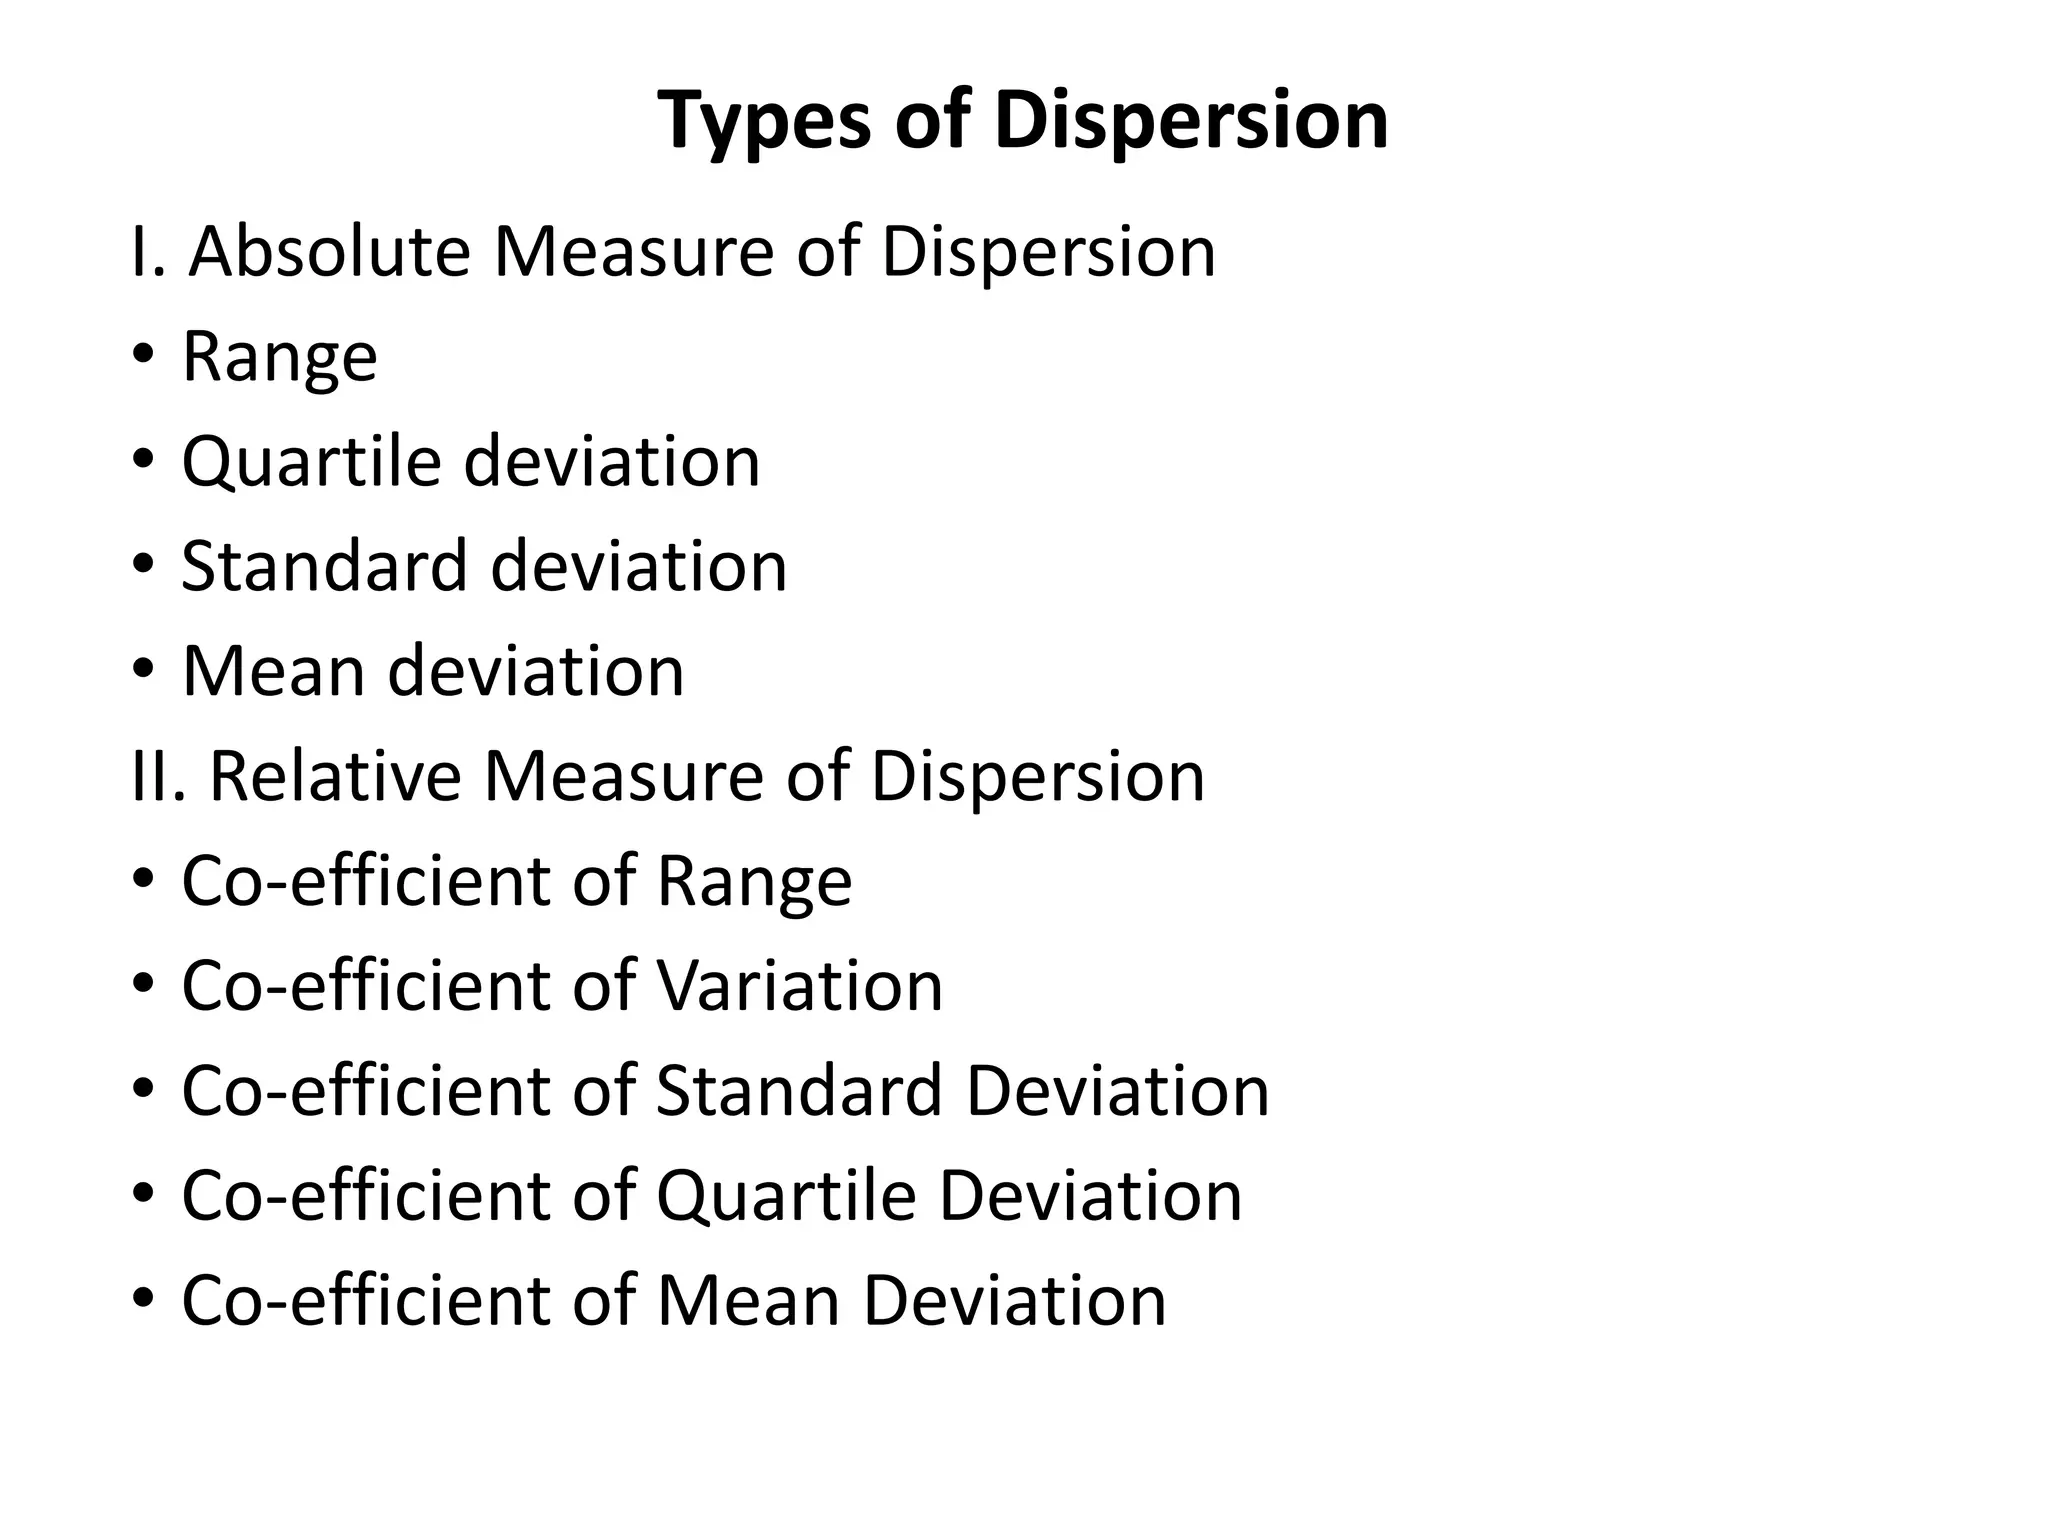
PROGRAMME B.COM
SUBJECT
QUANTITATIVE TECHNIQUE – I
SEMESTER III
UNIVERSITY VIJAYANAGAR SRI
KRISHNADEVARAYA UNIVERSITY,
BALLARI
SESSION 41
RECAP
• Merits & Demerits of Mean, Median and Mode
LEARNING OBJECTIVES
• After reading this chapter, a student will be
understand different measures of central tendency
and Dispersion, i.e., Arithmetic Mean,Mean,Mode,
Geometric and Harmonic mean & Range, Mean
Deviation, Standard Deviation, Quartile Deviation,
Co efficient of variation
LEARNING OUTCOMES
• After the Chapter, The Students Shall be able to
Differentiate, Determine, and Identify the
relationships among Averages under Different
Series of Data and too State the Merits and
Demerits of Three Measures. The Students will
apply Measures of Dispersion to Sample Population
Data by Contrasting the Values of Standard
Deviation & The Mean Deviation, Synthesizing the
Mean,Standard,and Quartile Deviations into a
Useful Description of a Set of Data
SESSION - 41
• Measures of Dispersion, Meaning, Definition,
Concept, Purposes and Methods
Meaning and Concept of dispersion
Dispersion is the extent to which values in a distribution
differ from the average of the distribution.
Or dispersion helps to understand the distribution of
the data.
Concept
A measure of dispersion indicates the scattering of
data. It explains the disparity of data from one another,
delivering a precise view of their distribution. The
measure of dispersion displays and gives us an idea
about the variation and the central value of an
individual item
Definition and Purposes of Dispersion
MEANING
A.L Bowley defines dispersion is the measure of the
variation of the items.
Purposes of Dispersion
(1) Comparative study
(2) Reliability of an average
(3) Control the variability
(4) Basis for further statistical analysis
Types of Dispersion
I. Absolute Measure of Dispersion
• Range
• Quartile deviation
• Standard deviation
• Mean deviation
II. Relative Measure of Dispersion
• Co-efficient of Range
• Co-efficient of Variation
• Co-efficient of Standard Deviation
• Co-efficient of Quartile Deviation
• Co-efficient of Mean Deviation
MCQs
I. The scatter in a series of values about the average is
called:
(a) Central tendency
(b) Dispersion
(c) Skewness
(d) Symmetry
II. The measurements of spread or scatter of the
individual values around the central point is called:
(a) Measures of dispersion
(b) Measures of central tendency
(c) Measures of skewness
(d) Measures of kurtosis
MCQs
III. The measures used to calculate the variation present
among the observations in the unit of the variable is
called:
(a) Relative measures of dispersion
(b) Coefficient of skewness
(c) Absolute measures of dispersion
(d) Coefficient of variation
IV. The degree to which numerical data tend to spread
about an average value called:
(a) Constant
(b) Flatness
(c) Variation
(d) Skewness
MCQs
V. The measures used to calculate the variation present
among the observations relative to their average is
called:
(a) Coefficient of kurtosis
(b) Absolute measures of dispersion
(c) Quartile deviation
(d) Relative measures of dispersion
CONTD
ANSWERS
I. B
II. A
III. C
IV. C
V. D
REFERENCES
• S.P. Gupta, Sultan Chand and Sons Publications, 2017
• S. C. Gupta, Himalaya Publishing House,
Fundamentals of Statistics, 2018
• R.S.N Pillai and Bagavathi, S.Chand publications, 2010
THANK YOU

Measures of Dispersion

  • 1.
    PROGRAMME B.COM SUBJECT QUANTITATIVE TECHNIQUE– I SEMESTER III UNIVERSITY VIJAYANAGAR SRI KRISHNADEVARAYA UNIVERSITY, BALLARI SESSION 41
  • 2.
    RECAP • Merits &Demerits of Mean, Median and Mode
  • 3.
    LEARNING OBJECTIVES • Afterreading this chapter, a student will be understand different measures of central tendency and Dispersion, i.e., Arithmetic Mean,Mean,Mode, Geometric and Harmonic mean & Range, Mean Deviation, Standard Deviation, Quartile Deviation, Co efficient of variation
  • 4.
    LEARNING OUTCOMES • Afterthe Chapter, The Students Shall be able to Differentiate, Determine, and Identify the relationships among Averages under Different Series of Data and too State the Merits and Demerits of Three Measures. The Students will apply Measures of Dispersion to Sample Population Data by Contrasting the Values of Standard Deviation & The Mean Deviation, Synthesizing the Mean,Standard,and Quartile Deviations into a Useful Description of a Set of Data
  • 5.
    SESSION - 41 •Measures of Dispersion, Meaning, Definition, Concept, Purposes and Methods
  • 6.
    Meaning and Conceptof dispersion Dispersion is the extent to which values in a distribution differ from the average of the distribution. Or dispersion helps to understand the distribution of the data. Concept A measure of dispersion indicates the scattering of data. It explains the disparity of data from one another, delivering a precise view of their distribution. The measure of dispersion displays and gives us an idea about the variation and the central value of an individual item
  • 7.
    Definition and Purposesof Dispersion MEANING A.L Bowley defines dispersion is the measure of the variation of the items. Purposes of Dispersion (1) Comparative study (2) Reliability of an average (3) Control the variability (4) Basis for further statistical analysis
  • 8.
    Types of Dispersion I.Absolute Measure of Dispersion • Range • Quartile deviation • Standard deviation • Mean deviation II. Relative Measure of Dispersion • Co-efficient of Range • Co-efficient of Variation • Co-efficient of Standard Deviation • Co-efficient of Quartile Deviation • Co-efficient of Mean Deviation
  • 9.
    MCQs I. The scatterin a series of values about the average is called: (a) Central tendency (b) Dispersion (c) Skewness (d) Symmetry II. The measurements of spread or scatter of the individual values around the central point is called: (a) Measures of dispersion (b) Measures of central tendency (c) Measures of skewness (d) Measures of kurtosis
  • 10.
    MCQs III. The measuresused to calculate the variation present among the observations in the unit of the variable is called: (a) Relative measures of dispersion (b) Coefficient of skewness (c) Absolute measures of dispersion (d) Coefficient of variation IV. The degree to which numerical data tend to spread about an average value called: (a) Constant (b) Flatness (c) Variation (d) Skewness
  • 11.
    MCQs V. The measuresused to calculate the variation present among the observations relative to their average is called: (a) Coefficient of kurtosis (b) Absolute measures of dispersion (c) Quartile deviation (d) Relative measures of dispersion
  • 12.
  • 13.
    REFERENCES • S.P. Gupta,Sultan Chand and Sons Publications, 2017 • S. C. Gupta, Himalaya Publishing House, Fundamentals of Statistics, 2018 • R.S.N Pillai and Bagavathi, S.Chand publications, 2010
  • 14.