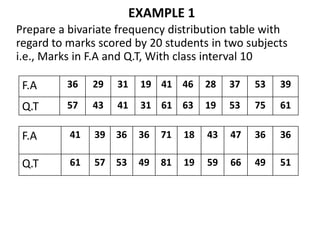
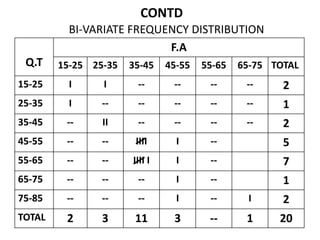
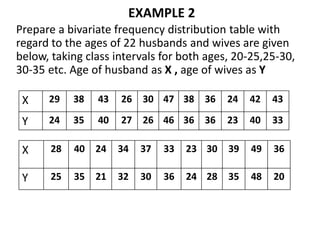
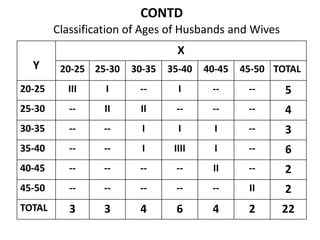
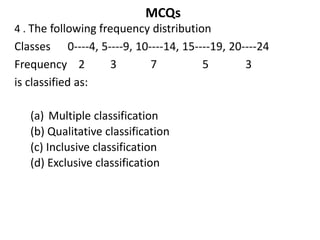
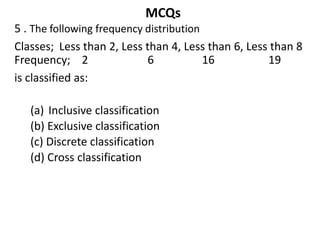
PROGRAMME B.COM
SUBJECT
QUANTITATIVE TECHNIQUE – I
SEMESTER III
UNIVERSITY VIJAYANAGAR SRI
KRISHNADEVARAYA UNIVERSITY,
BALLARI
SESSION 14
RECAP
• Bi-Variate Frequency Distribution Table Meaning &
Problems-------- 01
LEARNING OBJECTIVES
• The aim of the chapter is to make students to
present data in textual and Tabular format including
the technique of creating frequency distribution
and working out bi-variate distribution table
LEARNING OUTCOMES
• After the Chapter, The Students Shall be able to
Describe and Understand the Rules & Types of
Classification, Frequency Distribution, Class Interval
& its Types, Basic Principles Tabulation and The
Sorting of Data.
SESSION - 14
• Bi-Variate Frequency Distribution Table Problems - 02
EXAMPLE 1
Prepare a bivariate frequency distribution table with
regard to marks scored by 20 students in two subjects
i.e., Marks in F.A and Q.T, With class interval 10
F.A 36 29 31 19 41 46 28 37 53 39
Q.T 57 43 41 31 61 63 19 53 75 61
F.A 41 39 36 36 71 18 43 47 36 36
Q.T 61 57 53 49 81 19 59 66 49 51
CONTD
BI-VARIATE FREQUENCY DISTRIBUTION
Q.T
F.A
15-25 25-35 35-45 45-55 55-65 65-75 TOTAL
15-25 I I -- -- -- -- 2
25-35 I -- -- -- -- -- 1
35-45 -- II -- -- -- -- 2
45-55 -- -- IIII I -- 5
55-65 -- -- IIII I I -- 7
65-75 -- -- -- I -- 1
75-85 -- -- -- I -- I 2
TOTAL 2 3 11 3 -- 1 20
EXAMPLE 2
Prepare a bivariate frequency distribution table with
regard to the ages of 22 husbands and wives are given
below, taking class intervals for both ages, 20-25,25-30,
30-35 etc. Age of husband as X , age of wives as Y
X 29 38 43 26 30 47 38 36 24 42 43
Y 24 35 40 27 26 46 36 36 23 40 33
X 28 40 24 34 37 33 23 30 39 49 36
Y 25 35 21 32 30 36 24 28 35 48 20
CONTD
Classification of Ages of Husbands and Wives
Y
X
20-25 25-30 30-35 35-40 40-45 45-50 TOTAL
20-25 III I -- I -- -- 5
25-30 -- II II -- -- -- 4
30-35 -- -- I I I -- 3
35-40 -- -- I IIII I -- 6
40-45 -- -- -- -- II -- 2
45-50 -- -- -- -- -- II 2
TOTAL 3 3 4 6 4 2 22
SUMMARY
As we already discussed and learnt today on
Classifications and Tabulation as below
• Bi-Variate Frequency Distribution Table Problems - 02
MCQs
1 . A grouping of data into mutually exclusive classes
showing the number of observations in each class is;
(a) Frequency polygon
(b) Relative frequency
(c) Frequency distribution
(d) Cumulative frequency
2 . The class frequency divided by the total number of
observations is called:
(a) Percentage frequency
(b) Relative frequency
(c) Cumulative frequency
(d) Bivariate frequency
MCQs
3 . The following frequency distribution
Classes 10----20, 20----30, 30----40, 40----50, 50----60
Frequency 2 4 6 4 2
is classified as:
(a) Exclusive classification
(b) Inclusive classification
(c) Geographical classification
(d) Two-way classification
MCQs
4 . The following frequency distribution
Classes 0----4, 5----9, 10----14, 15----19, 20----24
Frequency 2 3 7 5 3
is classified as:
(a) Multiple classification
(b) Qualitative classification
(c) Inclusive classification
(d) Exclusive classification
MCQs
5 . The following frequency distribution
Classes; Less than 2, Less than 4, Less than 6, Less than 8
Frequency; 2 6 16 19
is classified as:
(a) Inclusive classification
(b) Exclusive classification
(c) Discrete classification
(d) Cross classification
CONTD
ANSWERS
1. C
2. B
3. A
4. C
5. B
REFERENCES
• S.P. Gupta, Sultan Chand and Sons Publications, 2017
• S. C. Gupta, Himalaya Publishing House,
Fundamentals of Statistics, 2018
• R.S.N Pillai and Bagavathi, S.Chand publications, 2010
THANK YOU

Bi variate Table 2

  • 1.
    PROGRAMME B.COM SUBJECT QUANTITATIVE TECHNIQUE– I SEMESTER III UNIVERSITY VIJAYANAGAR SRI KRISHNADEVARAYA UNIVERSITY, BALLARI SESSION 14
  • 2.
    RECAP • Bi-Variate FrequencyDistribution Table Meaning & Problems-------- 01
  • 3.
    LEARNING OBJECTIVES • Theaim of the chapter is to make students to present data in textual and Tabular format including the technique of creating frequency distribution and working out bi-variate distribution table
  • 4.
    LEARNING OUTCOMES • Afterthe Chapter, The Students Shall be able to Describe and Understand the Rules & Types of Classification, Frequency Distribution, Class Interval & its Types, Basic Principles Tabulation and The Sorting of Data.
  • 5.
    SESSION - 14 •Bi-Variate Frequency Distribution Table Problems - 02
  • 6.
    EXAMPLE 1 Prepare abivariate frequency distribution table with regard to marks scored by 20 students in two subjects i.e., Marks in F.A and Q.T, With class interval 10 F.A 36 29 31 19 41 46 28 37 53 39 Q.T 57 43 41 31 61 63 19 53 75 61 F.A 41 39 36 36 71 18 43 47 36 36 Q.T 61 57 53 49 81 19 59 66 49 51
  • 7.
    CONTD BI-VARIATE FREQUENCY DISTRIBUTION Q.T F.A 15-2525-35 35-45 45-55 55-65 65-75 TOTAL 15-25 I I -- -- -- -- 2 25-35 I -- -- -- -- -- 1 35-45 -- II -- -- -- -- 2 45-55 -- -- IIII I -- 5 55-65 -- -- IIII I I -- 7 65-75 -- -- -- I -- 1 75-85 -- -- -- I -- I 2 TOTAL 2 3 11 3 -- 1 20
  • 8.
    EXAMPLE 2 Prepare abivariate frequency distribution table with regard to the ages of 22 husbands and wives are given below, taking class intervals for both ages, 20-25,25-30, 30-35 etc. Age of husband as X , age of wives as Y X 29 38 43 26 30 47 38 36 24 42 43 Y 24 35 40 27 26 46 36 36 23 40 33 X 28 40 24 34 37 33 23 30 39 49 36 Y 25 35 21 32 30 36 24 28 35 48 20
  • 9.
    CONTD Classification of Agesof Husbands and Wives Y X 20-25 25-30 30-35 35-40 40-45 45-50 TOTAL 20-25 III I -- I -- -- 5 25-30 -- II II -- -- -- 4 30-35 -- -- I I I -- 3 35-40 -- -- I IIII I -- 6 40-45 -- -- -- -- II -- 2 45-50 -- -- -- -- -- II 2 TOTAL 3 3 4 6 4 2 22
  • 10.
    SUMMARY As we alreadydiscussed and learnt today on Classifications and Tabulation as below • Bi-Variate Frequency Distribution Table Problems - 02
  • 11.
    MCQs 1 . Agrouping of data into mutually exclusive classes showing the number of observations in each class is; (a) Frequency polygon (b) Relative frequency (c) Frequency distribution (d) Cumulative frequency 2 . The class frequency divided by the total number of observations is called: (a) Percentage frequency (b) Relative frequency (c) Cumulative frequency (d) Bivariate frequency
  • 12.
    MCQs 3 . Thefollowing frequency distribution Classes 10----20, 20----30, 30----40, 40----50, 50----60 Frequency 2 4 6 4 2 is classified as: (a) Exclusive classification (b) Inclusive classification (c) Geographical classification (d) Two-way classification
  • 13.
    MCQs 4 . Thefollowing frequency distribution Classes 0----4, 5----9, 10----14, 15----19, 20----24 Frequency 2 3 7 5 3 is classified as: (a) Multiple classification (b) Qualitative classification (c) Inclusive classification (d) Exclusive classification
  • 14.
    MCQs 5 . Thefollowing frequency distribution Classes; Less than 2, Less than 4, Less than 6, Less than 8 Frequency; 2 6 16 19 is classified as: (a) Inclusive classification (b) Exclusive classification (c) Discrete classification (d) Cross classification
  • 15.
  • 16.
    REFERENCES • S.P. Gupta,Sultan Chand and Sons Publications, 2017 • S. C. Gupta, Himalaya Publishing House, Fundamentals of Statistics, 2018 • R.S.N Pillai and Bagavathi, S.Chand publications, 2010
  • 17.