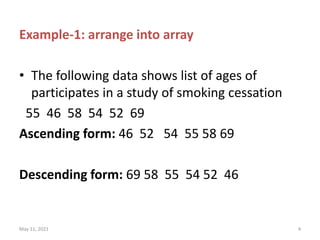
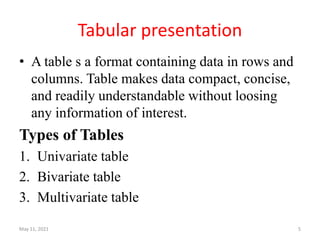
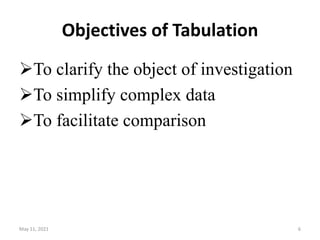
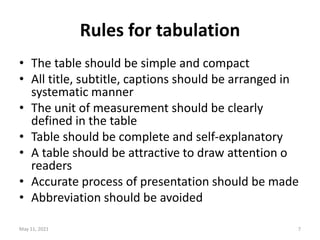
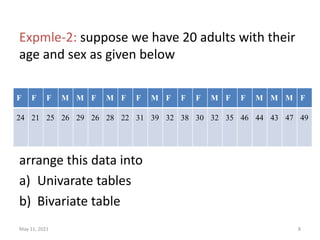
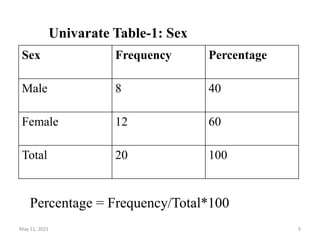
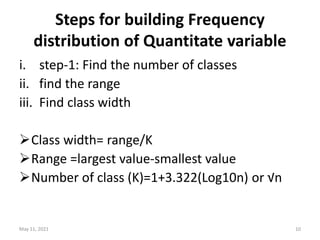
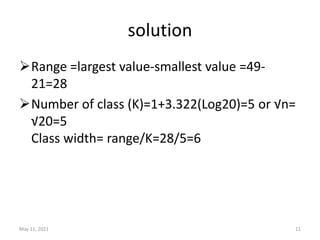
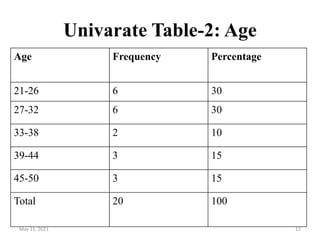
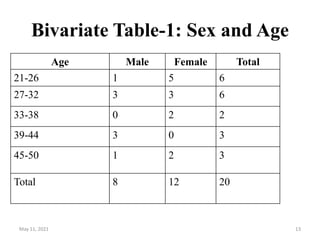
Techniques for Data Presentation
Mohamed Hayir Tahlil Mohamud
MS in Biostatistics
May 11, 2021 1
Techniques of Data presentation
Data can be presented into:-
Array
Tabular
Graphical
May 11, 2021 2
Array data presentation
• Array is listing the data values in order of
magnitude from the smallest to largest or vise
verse
• Array can be either
• Ascending: ordering data from smallest to
largest or
• Descending: ordering data from largest to
smallest.
May 11, 2021 3
Example-1: arrange into array
• The following data shows list of ages of
participates in a study of smoking cessation
55 46 58 54 52 69
Ascending form: 46 52 54 55 58 69
Descending form: 69 58 55 54 52 46
May 11, 2021 4
Tabular presentation
• A table s a format containing data in rows and
columns. Table makes data compact, concise,
and readily understandable without loosing
any information of interest.
Types of Tables
1. Univariate table
2. Bivariate table
3. Multivariate table
May 11, 2021 5
Objectives of Tabulation
To clarify the object of investigation
To simplify complex data
To facilitate comparison
May 11, 2021 6
Rules for tabulation
• The table should be simple and compact
• All title, subtitle, captions should be arranged in
systematic manner
• The unit of measurement should be clearly
defined in the table
• Table should be complete and self-explanatory
• A table should be attractive to draw attention o
readers
• Accurate process of presentation should be made
• Abbreviation should be avoided
May 11, 2021 7
Expmle-2: suppose we have 20 adults with their
age and sex as given below
arrange this data into
a) Univarate tables
b) Bivariate table
F F F M M F M F F M F F F M F F M M M F
24 21 25 26 29 26 28 22 31 39 32 38 30 32 35 46 44 43 47 49
May 11, 2021 8
Sex Frequency Percentage
Male 8 40
Female 12 60
Total 20 100
Univarate Table-1: Sex
Percentage = Frequency/Total*100
May 11, 2021 9
Steps for building Frequency
distribution of Quantitate variable
i. step-1: Find the number of classes
ii. find the range
iii. Find class width
Class width= range/K
Range =largest value-smallest value
Number of class (K)=1+3.322(Log10n) or √n
May 11, 2021 10
solution
Range =largest value-smallest value =49-
21=28
Number of class (K)=1+3.322(Log20)=5 or √n=
√20=5
Class width= range/K=28/5=6
May 11, 2021 11
Age Frequency Percentage
21-26 6 30
27-32 6 30
33-38 2 10
39-44 3 15
45-50 3 15
Total 20 100
Univarate Table-2: Age
May 11, 2021 12
Age Male Female Total
21-26 1 5 6
27-32 3 3 6
33-38 0 2 2
39-44 3 0 3
45-50 1 2 3
Total 8 12 20
Bivariate Table-1: Sex and Age
May 11, 2021 13
Multivariate Table-3: Age, sex and
educational level
May 11, 2021 14
Educational level__
Gender__
Age
Male Female
Total
Urban Rural Urban Rural
21-26 1 2 5 1 9
27-32 3 2 3 2 10
33-38 0 1 2 1 4
39-44 3 2 0 2 7
45-50 1 3 2 1 7
Total 8 10 12 7 37

Lect 4 part 1 techniques for data presentation

  • 1.
    Techniques for DataPresentation Mohamed Hayir Tahlil Mohamud MS in Biostatistics May 11, 2021 1
  • 2.
    Techniques of Datapresentation Data can be presented into:- Array Tabular Graphical May 11, 2021 2
  • 3.
    Array data presentation •Array is listing the data values in order of magnitude from the smallest to largest or vise verse • Array can be either • Ascending: ordering data from smallest to largest or • Descending: ordering data from largest to smallest. May 11, 2021 3
  • 4.
    Example-1: arrange intoarray • The following data shows list of ages of participates in a study of smoking cessation 55 46 58 54 52 69 Ascending form: 46 52 54 55 58 69 Descending form: 69 58 55 54 52 46 May 11, 2021 4
  • 5.
    Tabular presentation • Atable s a format containing data in rows and columns. Table makes data compact, concise, and readily understandable without loosing any information of interest. Types of Tables 1. Univariate table 2. Bivariate table 3. Multivariate table May 11, 2021 5
  • 6.
    Objectives of Tabulation Toclarify the object of investigation To simplify complex data To facilitate comparison May 11, 2021 6
  • 7.
    Rules for tabulation •The table should be simple and compact • All title, subtitle, captions should be arranged in systematic manner • The unit of measurement should be clearly defined in the table • Table should be complete and self-explanatory • A table should be attractive to draw attention o readers • Accurate process of presentation should be made • Abbreviation should be avoided May 11, 2021 7
  • 8.
    Expmle-2: suppose wehave 20 adults with their age and sex as given below arrange this data into a) Univarate tables b) Bivariate table F F F M M F M F F M F F F M F F M M M F 24 21 25 26 29 26 28 22 31 39 32 38 30 32 35 46 44 43 47 49 May 11, 2021 8
  • 9.
    Sex Frequency Percentage Male8 40 Female 12 60 Total 20 100 Univarate Table-1: Sex Percentage = Frequency/Total*100 May 11, 2021 9
  • 10.
    Steps for buildingFrequency distribution of Quantitate variable i. step-1: Find the number of classes ii. find the range iii. Find class width Class width= range/K Range =largest value-smallest value Number of class (K)=1+3.322(Log10n) or √n May 11, 2021 10
  • 11.
    solution Range =largest value-smallestvalue =49- 21=28 Number of class (K)=1+3.322(Log20)=5 or √n= √20=5 Class width= range/K=28/5=6 May 11, 2021 11
  • 12.
    Age Frequency Percentage 21-266 30 27-32 6 30 33-38 2 10 39-44 3 15 45-50 3 15 Total 20 100 Univarate Table-2: Age May 11, 2021 12
  • 13.
    Age Male FemaleTotal 21-26 1 5 6 27-32 3 3 6 33-38 0 2 2 39-44 3 0 3 45-50 1 2 3 Total 8 12 20 Bivariate Table-1: Sex and Age May 11, 2021 13
  • 14.
    Multivariate Table-3: Age,sex and educational level May 11, 2021 14 Educational level__ Gender__ Age Male Female Total Urban Rural Urban Rural 21-26 1 2 5 1 9 27-32 3 2 3 2 10 33-38 0 1 2 1 4 39-44 3 2 0 2 7 45-50 1 3 2 1 7 Total 8 10 12 7 37