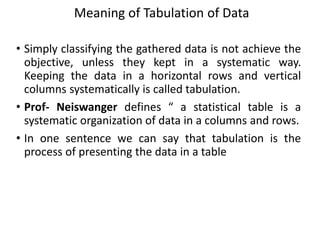
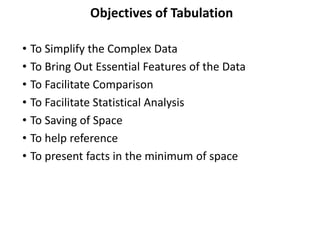
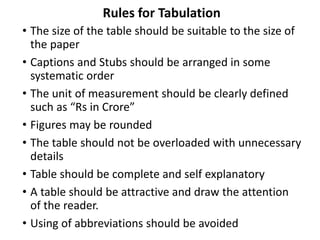
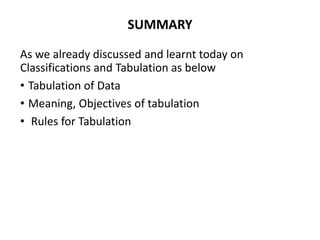
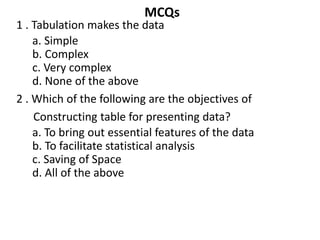
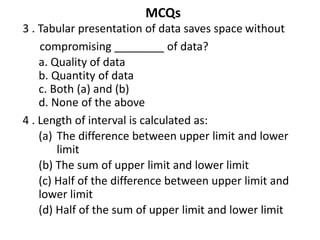
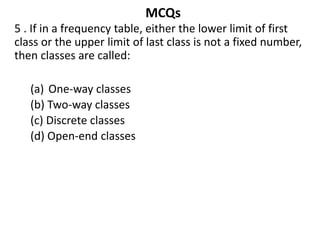
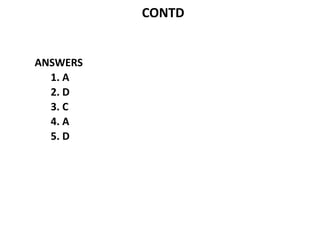
PROGRAMME B.COM
SUBJECT
QUANTITATIVE TECHNIQUE – I
SEMESTER III
UNIVERSITY VIJAYANAGAR SRI
KRISHNADEVARAYA UNIVERSITY,
BALLARI
SESSION 15
RECAP
• Bi-Variate Frequency Distribution Table Problems –02
LEARNING OBJECTIVES
• The aim of the chapter is to make students to
present data in textual and Tabular format including
the technique of creating frequency distribution
and working out bi-variate distribution table
LEARNING OUTCOMES
• After the Chapter, The Students Shall be able to
Describe and Understand the Rules & Types of
Classification, Frequency Distribution, Class Interval
& its Types, Basic Principles Tabulation and The
Sorting of Data.
SESSION - 15
• Tabulation of Data, Meaning, Objectives & Rules for
Tabulation
Meaning of Tabulation of Data
• Simply classifying the gathered data is not achieve the
objective, unless they kept in a systematic way.
Keeping the data in a horizontal rows and vertical
columns systematically is called tabulation.
• Prof- Neiswanger defines “ a statistical table is a
systematic organization of data in a columns and rows.
• In one sentence we can say that tabulation is the
process of presenting the data in a table
Objectives of Tabulation
• To Simplify the Complex Data
• To Bring Out Essential Features of the Data
• To Facilitate Comparison
• To Facilitate Statistical Analysis
• To Saving of Space
• To help reference
• To present facts in the minimum of space
Rules for Tabulation
• The size of the table should be suitable to the size of
the paper
• Captions and Stubs should be arranged in some
systematic order
• The unit of measurement should be clearly defined
such as “Rs in Crore”
• Figures may be rounded
• The table should not be overloaded with unnecessary
details
• Table should be complete and self explanatory
• A table should be attractive and draw the attention
of the reader.
• Using of abbreviations should be avoided
SUMMARY
As we already discussed and learnt today on
Classifications and Tabulation as below
• Tabulation of Data
• Meaning, Objectives of tabulation
• Rules for Tabulation
MCQs
1 . Tabulation makes the data
a. Simple
b. Complex
c. Very complex
d. None of the above
2 . Which of the following are the objectives of
Constructing table for presenting data?
a. To bring out essential features of the data
b. To facilitate statistical analysis
c. Saving of Space
d. All of the above
MCQs
3 . Tabular presentation of data saves space without
compromising ________ of data?
a. Quality of data
b. Quantity of data
c. Both (a) and (b)
d. None of the above
4 . Length of interval is calculated as:
(a) The difference between upper limit and lower
limit
(b) The sum of upper limit and lower limit
(c) Half of the difference between upper limit and
lower limit
(d) Half of the sum of upper limit and lower limit
MCQs
5 . If in a frequency table, either the lower limit of first
class or the upper limit of last class is not a fixed number,
then classes are called:
(a) One-way classes
(b) Two-way classes
(c) Discrete classes
(d) Open-end classes
CONTD
ANSWERS
1. A
2. D
3. C
4. A
5. D
REFERENCES
• S.P. Gupta, Sultan Chand and Sons Publications, 2017
• S. C. Gupta, Himalaya Publishing House,
Fundamentals of Statistics, 2018
• R.S.N Pillai and Bagavathi, S.Chand publications, 2010
THANK YOU

tabulation 3

  • 1.
    PROGRAMME B.COM SUBJECT QUANTITATIVE TECHNIQUE– I SEMESTER III UNIVERSITY VIJAYANAGAR SRI KRISHNADEVARAYA UNIVERSITY, BALLARI SESSION 15
  • 2.
    RECAP • Bi-Variate FrequencyDistribution Table Problems –02
  • 3.
    LEARNING OBJECTIVES • Theaim of the chapter is to make students to present data in textual and Tabular format including the technique of creating frequency distribution and working out bi-variate distribution table
  • 4.
    LEARNING OUTCOMES • Afterthe Chapter, The Students Shall be able to Describe and Understand the Rules & Types of Classification, Frequency Distribution, Class Interval & its Types, Basic Principles Tabulation and The Sorting of Data.
  • 5.
    SESSION - 15 •Tabulation of Data, Meaning, Objectives & Rules for Tabulation
  • 6.
    Meaning of Tabulationof Data • Simply classifying the gathered data is not achieve the objective, unless they kept in a systematic way. Keeping the data in a horizontal rows and vertical columns systematically is called tabulation. • Prof- Neiswanger defines “ a statistical table is a systematic organization of data in a columns and rows. • In one sentence we can say that tabulation is the process of presenting the data in a table
  • 7.
    Objectives of Tabulation •To Simplify the Complex Data • To Bring Out Essential Features of the Data • To Facilitate Comparison • To Facilitate Statistical Analysis • To Saving of Space • To help reference • To present facts in the minimum of space
  • 8.
    Rules for Tabulation •The size of the table should be suitable to the size of the paper • Captions and Stubs should be arranged in some systematic order • The unit of measurement should be clearly defined such as “Rs in Crore” • Figures may be rounded • The table should not be overloaded with unnecessary details • Table should be complete and self explanatory • A table should be attractive and draw the attention of the reader. • Using of abbreviations should be avoided
  • 9.
    SUMMARY As we alreadydiscussed and learnt today on Classifications and Tabulation as below • Tabulation of Data • Meaning, Objectives of tabulation • Rules for Tabulation
  • 10.
    MCQs 1 . Tabulationmakes the data a. Simple b. Complex c. Very complex d. None of the above 2 . Which of the following are the objectives of Constructing table for presenting data? a. To bring out essential features of the data b. To facilitate statistical analysis c. Saving of Space d. All of the above
  • 11.
    MCQs 3 . Tabularpresentation of data saves space without compromising ________ of data? a. Quality of data b. Quantity of data c. Both (a) and (b) d. None of the above 4 . Length of interval is calculated as: (a) The difference between upper limit and lower limit (b) The sum of upper limit and lower limit (c) Half of the difference between upper limit and lower limit (d) Half of the sum of upper limit and lower limit
  • 12.
    MCQs 5 . Ifin a frequency table, either the lower limit of first class or the upper limit of last class is not a fixed number, then classes are called: (a) One-way classes (b) Two-way classes (c) Discrete classes (d) Open-end classes
  • 13.
  • 14.
    REFERENCES • S.P. Gupta,Sultan Chand and Sons Publications, 2017 • S. C. Gupta, Himalaya Publishing House, Fundamentals of Statistics, 2018 • R.S.N Pillai and Bagavathi, S.Chand publications, 2010
  • 15.