Downloaded 139 times

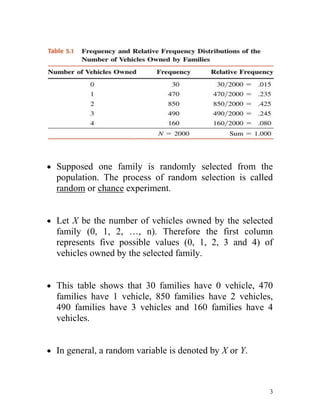
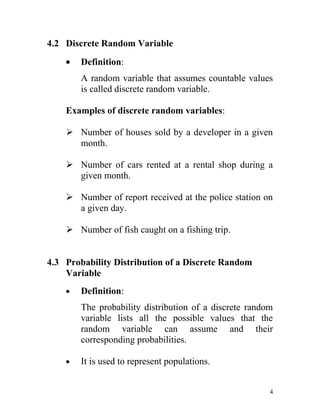


This document outlines key concepts related to discrete and continuous random variables including: - Discrete random variables can take countable values while continuous can take any value in an interval. - The probability distribution of a discrete random variable lists all possible values and their probabilities. - Key metrics for discrete variables include the mean, which is the expected value, and standard deviation, which measures spread. - The cumulative distribution function provides the probability that a random variable is less than or equal to a given value.


![Bab7 pengembangan perniagaan[1]](https://cdn.slidesharecdn.com/ss_thumbnails/bab7-pengembanganperniagaan1-120106022348-phpapp01-thumbnail.jpg?width=640&height=640&fit=bounds)


