This document provides an overview of key concepts in statistics, including:
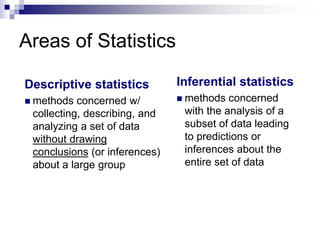
- Descriptive statistics involves collecting and analyzing data without inferences, while inferential statistics analyzes a subset of data to make inferences about the whole.
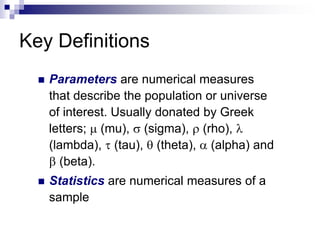
- Parameters describe populations and statistics describe samples.
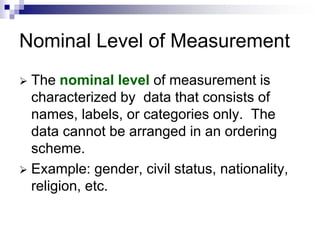
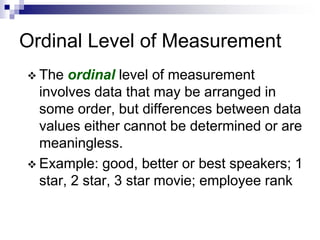
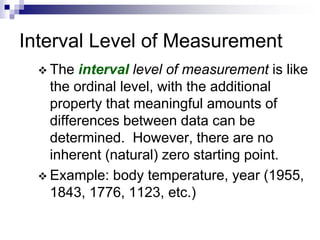
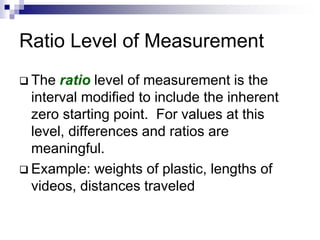
- Levels of measurement include nominal, ordinal, interval, and ratio.
- Measures of location summarize data distribution and include minimum, maximum, percentiles, deciles, and quartiles.
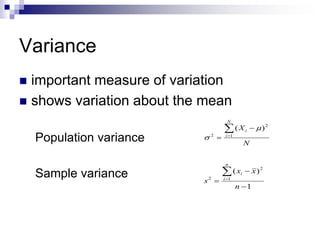
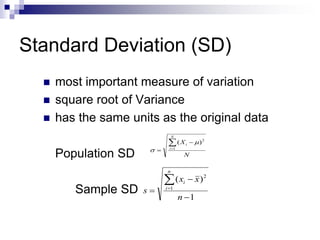
- Measures of variation describe data spread and include range, inter-quartile range, variance, standard deviation, and coefficient of variation. Variance and standard deviation are particularly important measures.