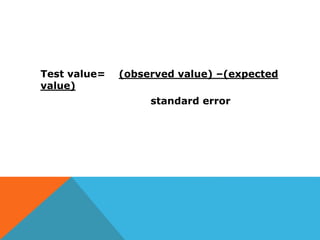
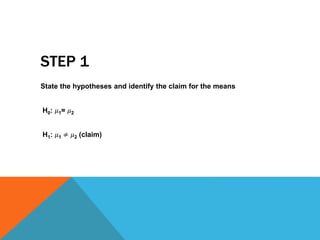
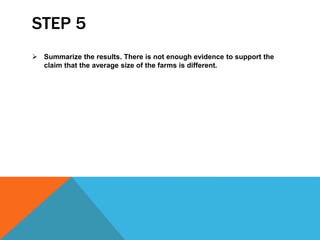
TESTING THE DIFFERENCE
BETWEEN TWO MEANS OF
INDEPENDENT SAMPLES:
USING THE T TEST
WHEN TO USE T TEST?
t test – used to test the
difference between means
when,
 the two samples are
independent
 When the samples are taken
from two normally or
approximately normally
distributed populations.
 Samples are independent
samples when they are not
related.
 Assume that the variances are
not equal.
FORMULA:
Test value= (observed value) –(expected
value)
standard error
Assumption for the t test for two
Independent Means when 𝝈1 and 𝝈2 are
unknown
1. The samples are random samples.
2. The sample data are independent of
one another.
3. When the sample sizes are less than
30, the populations must be normally
or approximately normally distributed.
EXAMPLE:
The average size of a farm in Indiana County,
Pennsylvania, is 191 acres. The average size of a
farm in Greene County, Pennsylvania, is 199 acres.
Assume the data were obtained from two samples
with standard deviation of 38 and 12 acres,
respectively, and sample sizes of 8 and 10,
respectively. Can it be concluded at 𝛼=0.05 that
the average size of the farms in the two counties
is different? Assume the populations are normally
distributed.
STEP 1
State the hypotheses and identify the claim for the means
H0: 𝜇1= 𝜇2
H1: 𝜇1 ≠ 𝜇2 (claim)
STEP 2
Find the critical values. Since the test is
two-tailed, since 𝛼 = 0.05, and since the
variances are unequal,
Then,
 the degrees of freedom are the smaller
of n1 -1 or n2 -1
In this case, the degrees of freedom
are 8-1=7.
Hence, from the t table, the critical
values are +2.365 and – 2.365.
STEP 3
STEP 4
Make the decision. Do not reject the
null hypothesis, since -0.57 > -2.365.
STEP 5
 Summarize the results. There is not enough evidence to support the
claim that the average size of the farms is different.

Statistics

  • 1.
    TESTING THE DIFFERENCE BETWEENTWO MEANS OF INDEPENDENT SAMPLES: USING THE T TEST
  • 2.
    WHEN TO USET TEST? t test – used to test the difference between means when,  the two samples are independent  When the samples are taken from two normally or approximately normally distributed populations.
  • 3.
     Samples areindependent samples when they are not related.  Assume that the variances are not equal.
  • 4.
  • 5.
    Test value= (observedvalue) –(expected value) standard error
  • 6.
    Assumption for thet test for two Independent Means when 𝝈1 and 𝝈2 are unknown 1. The samples are random samples. 2. The sample data are independent of one another. 3. When the sample sizes are less than 30, the populations must be normally or approximately normally distributed.
  • 10.
    EXAMPLE: The average sizeof a farm in Indiana County, Pennsylvania, is 191 acres. The average size of a farm in Greene County, Pennsylvania, is 199 acres. Assume the data were obtained from two samples with standard deviation of 38 and 12 acres, respectively, and sample sizes of 8 and 10, respectively. Can it be concluded at 𝛼=0.05 that the average size of the farms in the two counties is different? Assume the populations are normally distributed.
  • 11.
    STEP 1 State thehypotheses and identify the claim for the means H0: 𝜇1= 𝜇2 H1: 𝜇1 ≠ 𝜇2 (claim)
  • 12.
    STEP 2 Find thecritical values. Since the test is two-tailed, since 𝛼 = 0.05, and since the variances are unequal, Then,  the degrees of freedom are the smaller of n1 -1 or n2 -1
  • 13.
    In this case,the degrees of freedom are 8-1=7. Hence, from the t table, the critical values are +2.365 and – 2.365.
  • 14.
  • 15.
    STEP 4 Make thedecision. Do not reject the null hypothesis, since -0.57 > -2.365.
  • 16.
    STEP 5  Summarizethe results. There is not enough evidence to support the claim that the average size of the farms is different.