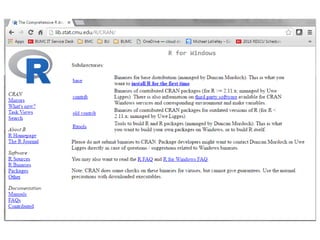
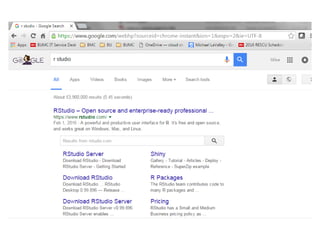
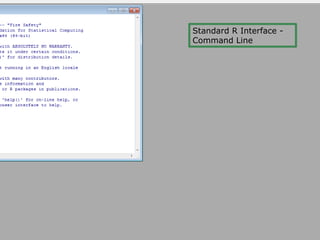
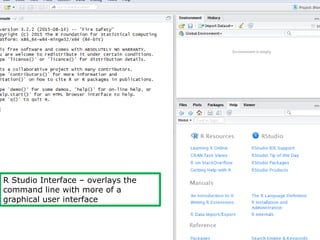
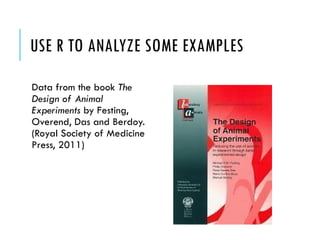
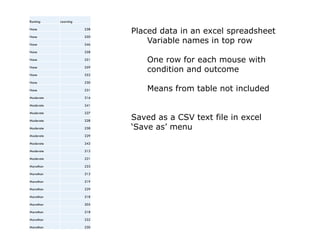
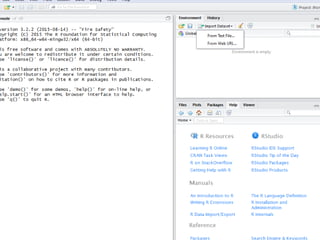
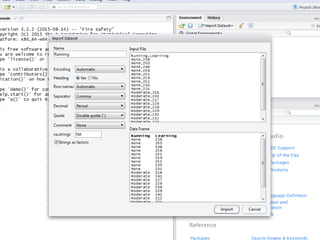
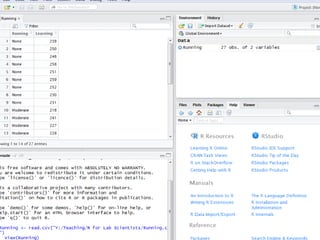
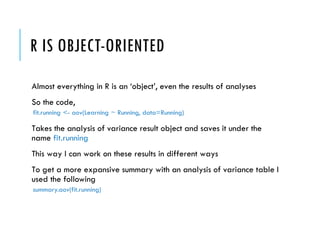
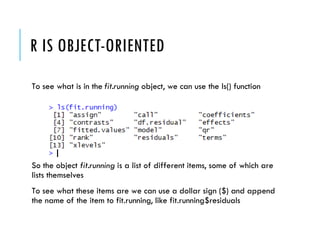
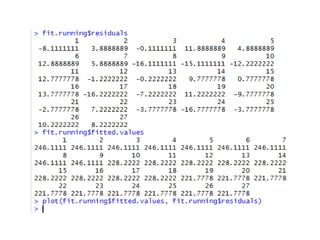
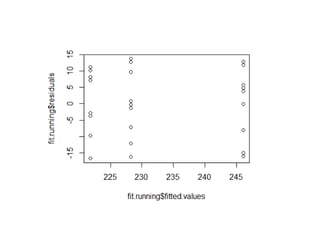
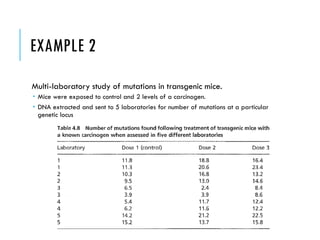
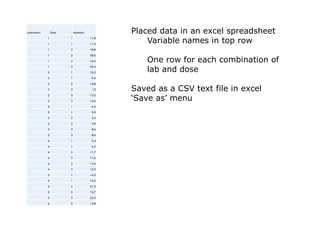
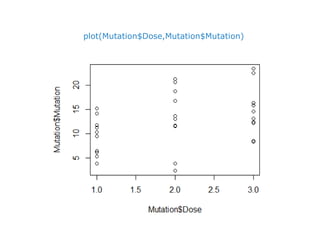
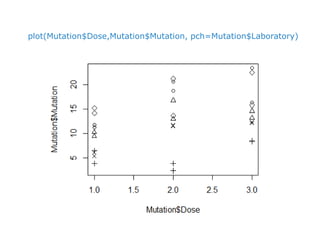
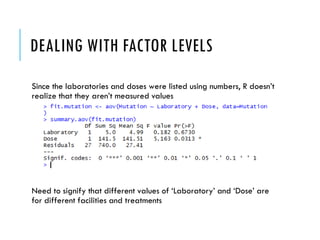
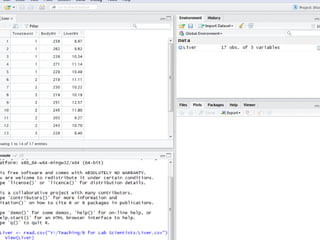
USING R SOFTWARE FOR
STATISTICS
Michael LaValley
4/28/2016
R is open source statistical software and is easy to find
through a web search
Standard R Interface -
Command Line
R Studio Interface โ€“ overlays the
command line with more of a
graphical user interface
USE R TO ANALYZE SOME EXAMPLES
Data from the book The
Design of Animal
Experiments by Festing,
Overend, Das and Berdoy.
(Royal Society of Medicine
Press, 2011)
EXAMPLE 1
Mice were randomly assigned to one of 3 conditions
1. No running โ€“ non-rotating wheel in cage for 30 minutes per 24 hours
2. Moderate running โ€“ rotating wheel in cage for 30 minutes per 24 hours
3. Marathon running โ€“ rotating wheel in cage for 3 hours per 24 hours
After 3 weeks, mice tested for learning ability in a maze โ€“ low values
indicate good learning ability
Running Learning
None 238
None 250
None 246
None 258
None 251
None 259
None 252
None 230
None 231
Moderate 216
Moderate 241
Moderate 227
Moderate 228
Moderate 238
Moderate 229
Moderate 242
Moderate 212
Moderate 221
Marathon 233
Marathon 212
Marathon 219
Marathon 229
Marathon 218
Marathon 205
Marathon 218
Marathon 232
Marathon 230
Placed data in an excel spreadsheet
Variable names in top row
One row for each mouse with
condition and outcome
Means from table not included
Saved as a CSV text file in excel
โ€˜Save asโ€™ menu
boxplot(Learning ~ Running, data=Running)
R IS OBJECT-ORIENTED
Almost everything in R is an โ€˜objectโ€™, even the results of analyses
So the code,
fit.running <- aov(Learning ~ Running, data=Running)
Takes the analysis of variance result object and saves it under the
name fit.running
This way I can work on these results in different ways
To get a more expansive summary with an analysis of variance table I
used the following
summary.aov(fit.running)
R IS OBJECT-ORIENTED
To see what is in the fit.running object, we can use the ls() function
So the object fit.running is a list of different items, some of which are
lists themselves
To see what these items are we can use a dollar sign ($) and append
the name of the item to fit.running, like fit.running$residuals
EXAMPLE 2
Multi-laboratory study of mutations in transgenic mice.
๏‚ญ Mice were exposed to control and 2 levels of a carcinogen.
๏‚ญ DNA extracted and sent to 5 laboratories for number of mutations at a particular
genetic locus
Laboratory Dose Mutation
1 1 11.8
1 1 11.3
1 2 18.8
1 2 20.6
1 3 16.4
1 3 23.4
2 1 10.3
2 1 9.5
2 2 16.8
2 2 13
2 3 13.2
2 3 14.6
3 1 6.5
3 1 3.9
3 2 2.4
3 2 3.9
3 3 8.4
3 3 8.6
4 1 5.4
4 1 6.2
4 2 11.7
4 2 11.6
4 3 12.4
4 3 12.2
5 1 14.2
5 1 15.2
5 2 21.2
5 2 13.7
5 3 22.5
5 3 15.8
Placed data in an excel spreadsheet
Variable names in top row
One row for each combination of
lab and dose
Saved as a CSV text file in excel
โ€˜Save asโ€™ menu
plot(Mutation$Dose,Mutation$Mutation)
plot(Mutation$Dose,Mutation$Mutation, pch=Mutation$Laboratory)
DEALING WITH FACTOR LEVELS
Since the laboratories and doses were listed using numbers, R doesnโ€™t
realize that they arenโ€™t measured values
Need to signify that different values of โ€˜Laboratoryโ€™ and โ€˜Doseโ€™ are
for different facilities and treatments
DEALING WITH FACTOR LEVELS
One approach would be to go back to the data spreadsheet and
make laboratory and dose alphabetic โ€“ that would work just as in
Example 1.
Working within R, we can use the as.factor() command
EXAMPLE 3
Mice treated with a liver toxin, controlling for body weight
๏‚ญ Toxin is expected to affect liver weight, but not body weight
๏‚ญ However, mice with bigger bodies tend to have bigger livers
EXAMPLE 3 - TREATMENT
We could look at the liver weights and Treatment as a one-factor
analysis of variance
Result is non-significant (p=0.153) using an F-test with 2 and 14
degrees of freedom
But, this doesnโ€™t account for differences in body weight โ€“ use analysis
of covariance
EXAMPLE 3 โ€“ TREATMENT AND BODY
WEIGHT
When body weight is added into the model
Treatment still is not statistically significant (p=0.0823), but the effect
of the body weight does show up
CONCLUSIONS
The R software package is freely available online
๏‚ญ In these slides Iโ€™ve just used the analysis of variance methods, but many more types of
analyses are done with the package
There is a large community of statisticians and computer scientists
further developing and refining the package
There is a large base of users in all sorts of quantitative fields using
the package and contributing tutorials, videos, FAQs, etc.

Using R Software for Statistics in Lab Science

  • 1.
    USING R SOFTWAREFOR STATISTICS Michael LaValley 4/28/2016
  • 2.
    R is opensource statistical software and is easy to find through a web search
  • 8.
    Standard R Interface- Command Line
  • 9.
    R Studio Interfaceโ€“ overlays the command line with more of a graphical user interface
  • 10.
    USE R TOANALYZE SOME EXAMPLES Data from the book The Design of Animal Experiments by Festing, Overend, Das and Berdoy. (Royal Society of Medicine Press, 2011)
  • 13.
    EXAMPLE 1 Mice wererandomly assigned to one of 3 conditions 1. No running โ€“ non-rotating wheel in cage for 30 minutes per 24 hours 2. Moderate running โ€“ rotating wheel in cage for 30 minutes per 24 hours 3. Marathon running โ€“ rotating wheel in cage for 3 hours per 24 hours After 3 weeks, mice tested for learning ability in a maze โ€“ low values indicate good learning ability
  • 14.
    Running Learning None 238 None250 None 246 None 258 None 251 None 259 None 252 None 230 None 231 Moderate 216 Moderate 241 Moderate 227 Moderate 228 Moderate 238 Moderate 229 Moderate 242 Moderate 212 Moderate 221 Marathon 233 Marathon 212 Marathon 219 Marathon 229 Marathon 218 Marathon 205 Marathon 218 Marathon 232 Marathon 230 Placed data in an excel spreadsheet Variable names in top row One row for each mouse with condition and outcome Means from table not included Saved as a CSV text file in excel โ€˜Save asโ€™ menu
  • 20.
  • 21.
    R IS OBJECT-ORIENTED Almosteverything in R is an โ€˜objectโ€™, even the results of analyses So the code, fit.running <- aov(Learning ~ Running, data=Running) Takes the analysis of variance result object and saves it under the name fit.running This way I can work on these results in different ways To get a more expansive summary with an analysis of variance table I used the following summary.aov(fit.running)
  • 22.
    R IS OBJECT-ORIENTED Tosee what is in the fit.running object, we can use the ls() function So the object fit.running is a list of different items, some of which are lists themselves To see what these items are we can use a dollar sign ($) and append the name of the item to fit.running, like fit.running$residuals
  • 25.
    EXAMPLE 2 Multi-laboratory studyof mutations in transgenic mice. ๏‚ญ Mice were exposed to control and 2 levels of a carcinogen. ๏‚ญ DNA extracted and sent to 5 laboratories for number of mutations at a particular genetic locus
  • 26.
    Laboratory Dose Mutation 11 11.8 1 1 11.3 1 2 18.8 1 2 20.6 1 3 16.4 1 3 23.4 2 1 10.3 2 1 9.5 2 2 16.8 2 2 13 2 3 13.2 2 3 14.6 3 1 6.5 3 1 3.9 3 2 2.4 3 2 3.9 3 3 8.4 3 3 8.6 4 1 5.4 4 1 6.2 4 2 11.7 4 2 11.6 4 3 12.4 4 3 12.2 5 1 14.2 5 1 15.2 5 2 21.2 5 2 13.7 5 3 22.5 5 3 15.8 Placed data in an excel spreadsheet Variable names in top row One row for each combination of lab and dose Saved as a CSV text file in excel โ€˜Save asโ€™ menu
  • 27.
  • 28.
  • 29.
    DEALING WITH FACTORLEVELS Since the laboratories and doses were listed using numbers, R doesnโ€™t realize that they arenโ€™t measured values Need to signify that different values of โ€˜Laboratoryโ€™ and โ€˜Doseโ€™ are for different facilities and treatments
  • 30.
    DEALING WITH FACTORLEVELS One approach would be to go back to the data spreadsheet and make laboratory and dose alphabetic โ€“ that would work just as in Example 1. Working within R, we can use the as.factor() command
  • 32.
    EXAMPLE 3 Mice treatedwith a liver toxin, controlling for body weight ๏‚ญ Toxin is expected to affect liver weight, but not body weight ๏‚ญ However, mice with bigger bodies tend to have bigger livers
  • 34.
    EXAMPLE 3 -TREATMENT We could look at the liver weights and Treatment as a one-factor analysis of variance Result is non-significant (p=0.153) using an F-test with 2 and 14 degrees of freedom But, this doesnโ€™t account for differences in body weight โ€“ use analysis of covariance
  • 35.
    EXAMPLE 3 โ€“TREATMENT AND BODY WEIGHT When body weight is added into the model Treatment still is not statistically significant (p=0.0823), but the effect of the body weight does show up
  • 36.
    CONCLUSIONS The R softwarepackage is freely available online ๏‚ญ In these slides Iโ€™ve just used the analysis of variance methods, but many more types of analyses are done with the package There is a large community of statisticians and computer scientists further developing and refining the package There is a large base of users in all sorts of quantitative fields using the package and contributing tutorials, videos, FAQs, etc.