The document defines and describes the independent samples t-test. It discusses that the t-test determines if there is a significant difference between the means of two unrelated groups on a continuous variable. It outlines the assumptions of the test, including that the dependent variable is continuous and normally distributed, the independent variable has two categorical groups, and observations are independent. An example applying the independent t-test process and using SPSS on data comparing peak knee flexion and extension velocities is provided.
T-TEST
DEFINITION
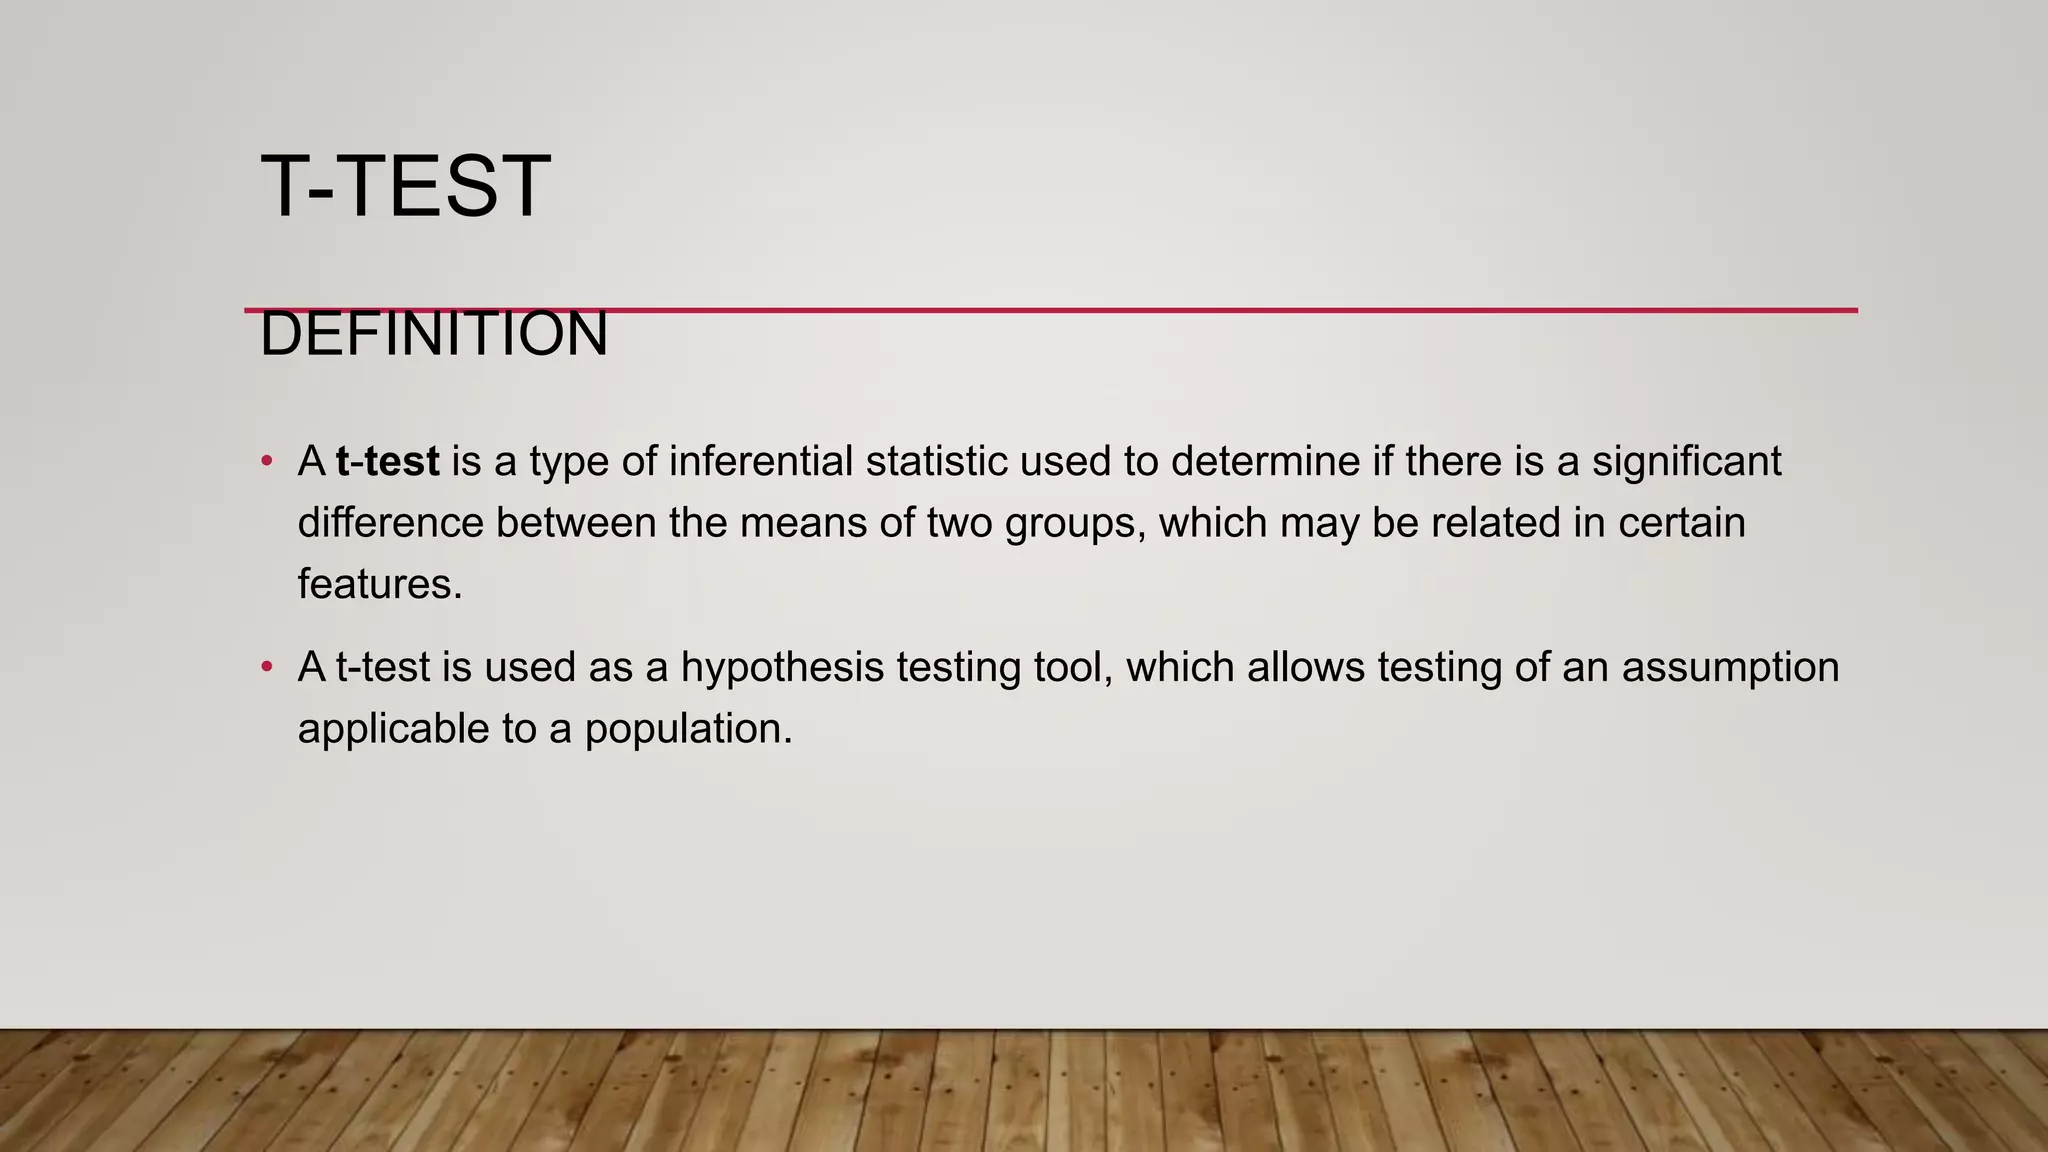
• A t-testis a type of inferential statistic used to determine if there is a significant
difference between the means of two groups, which may be related in certain
features.
• A t-test is used as a hypothesis testing tool, which allows testing of an assumption
applicable to a population.
3.
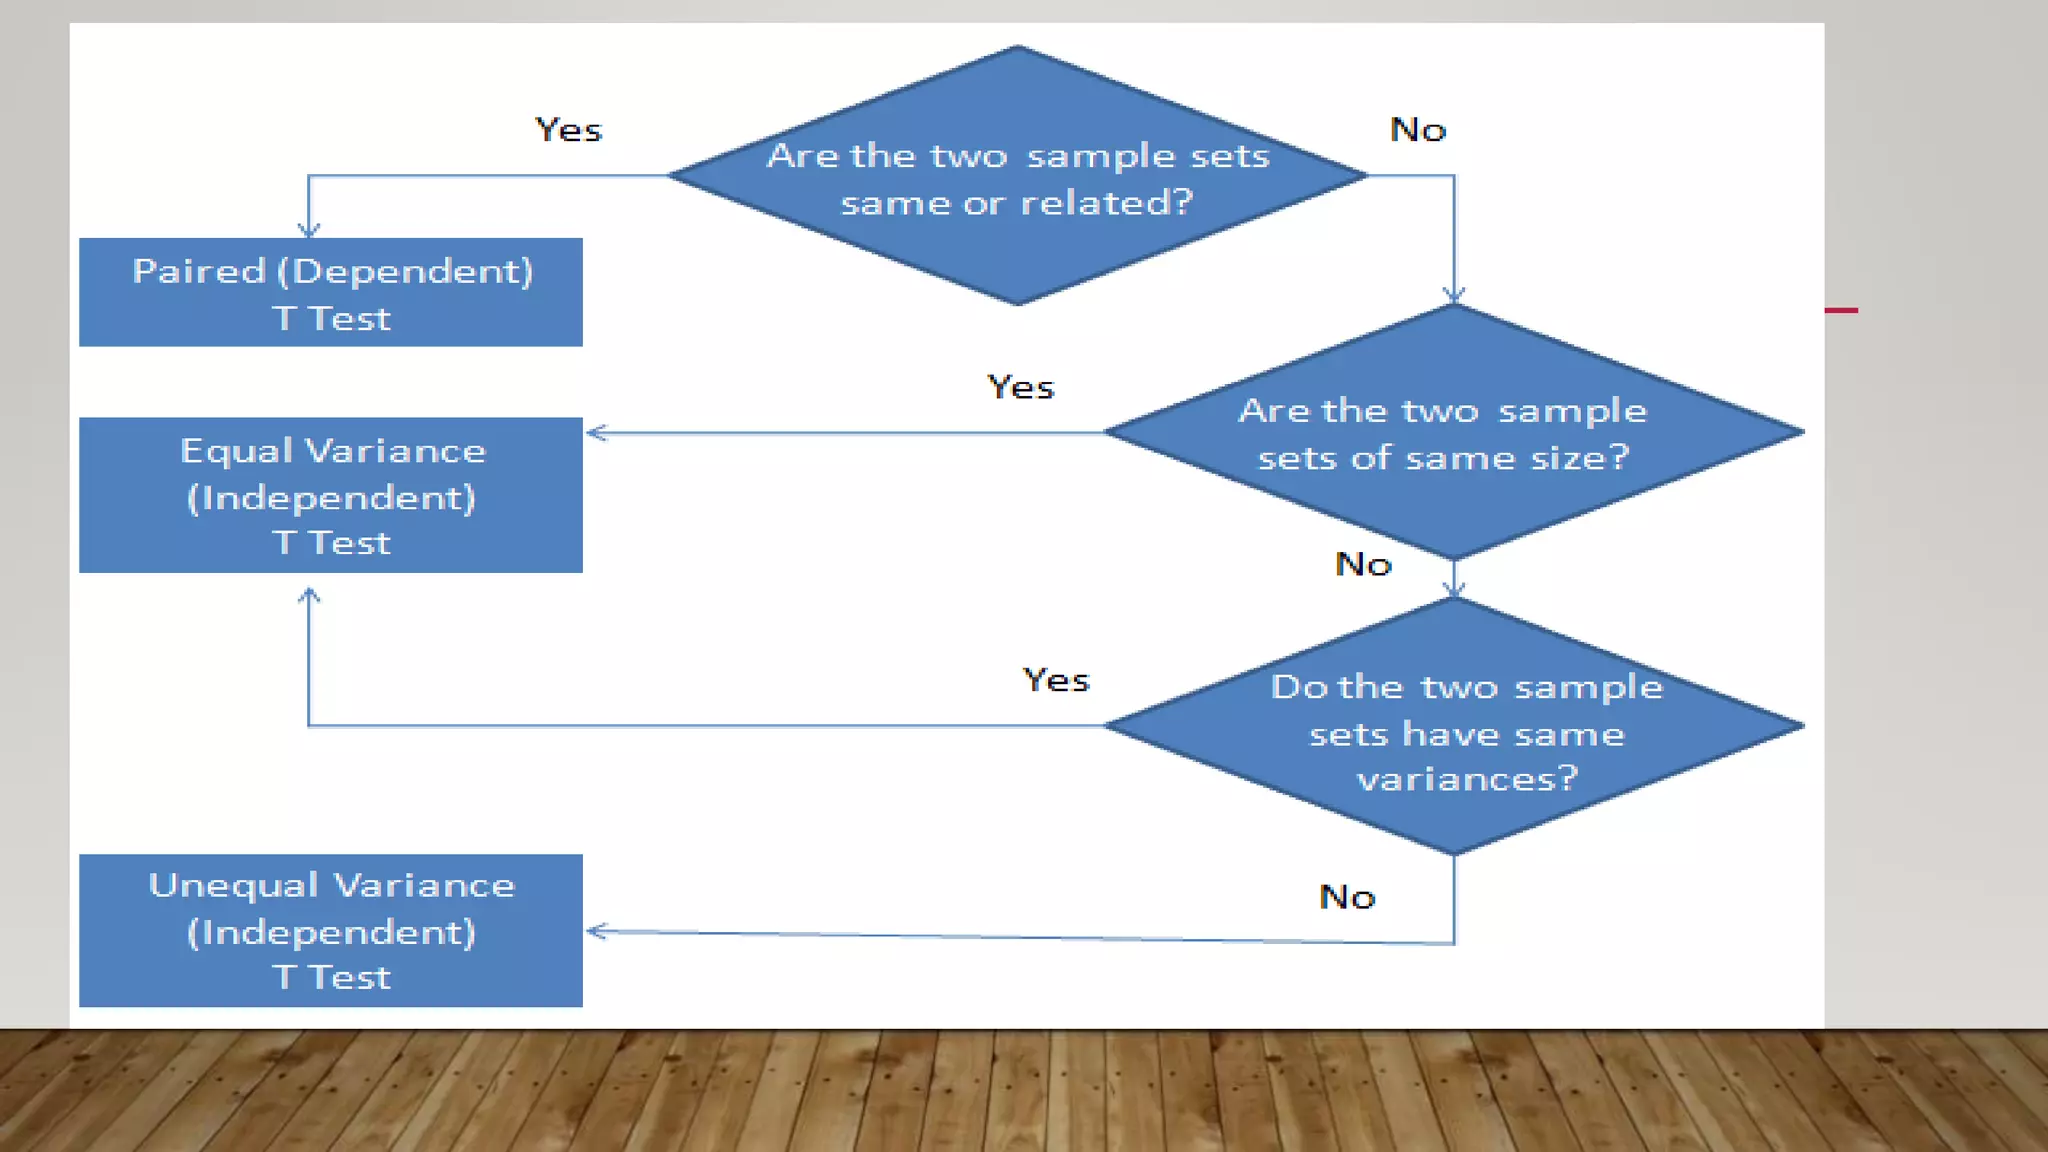
THERE ARE THREEMAIN TYPES OF T-TEST:
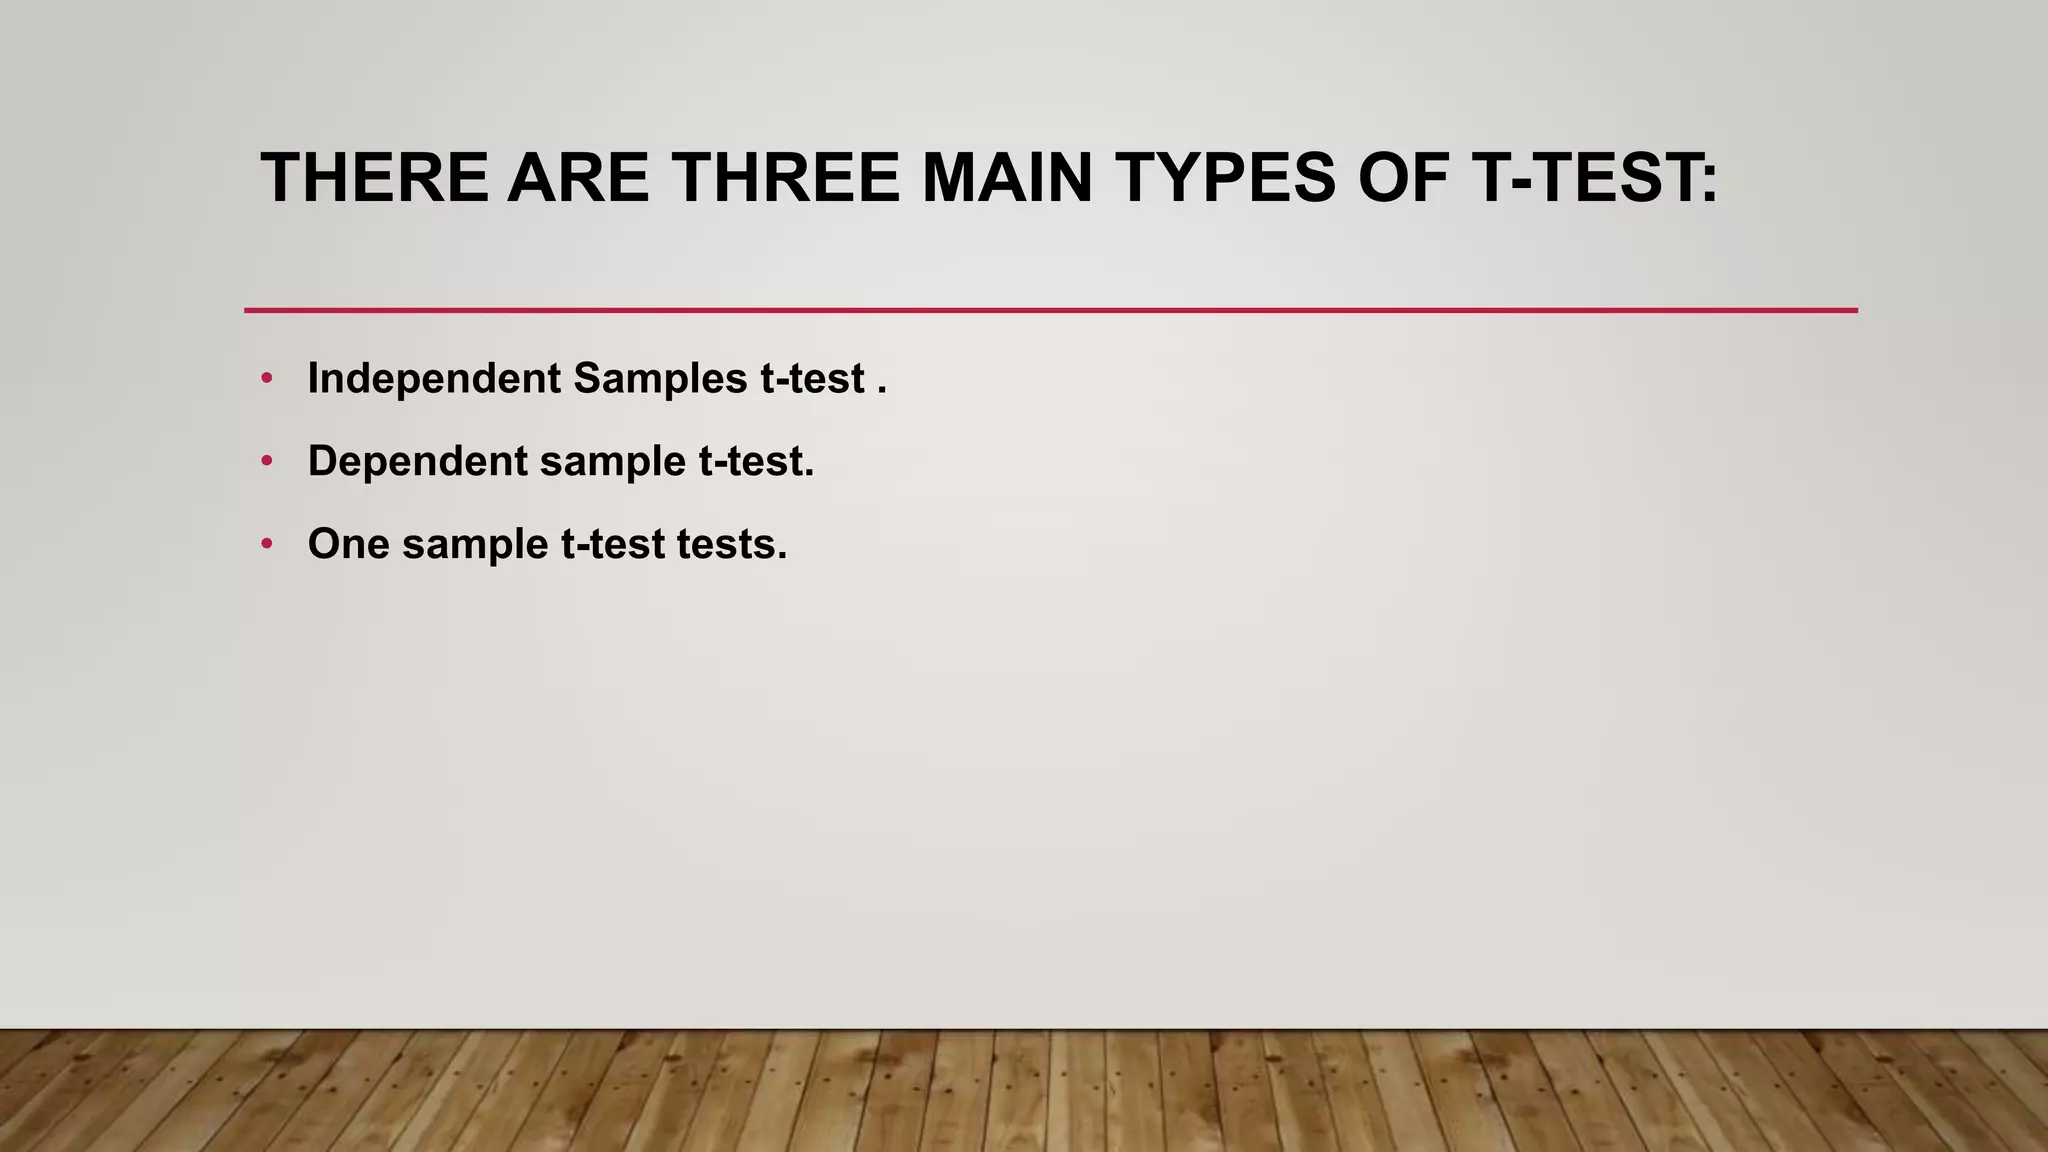
• Independent Samples t-test .
• Dependent sample t-test.
• One sample t-test tests.
4.
INDEPENDENT T-TEST
DEFINITION:
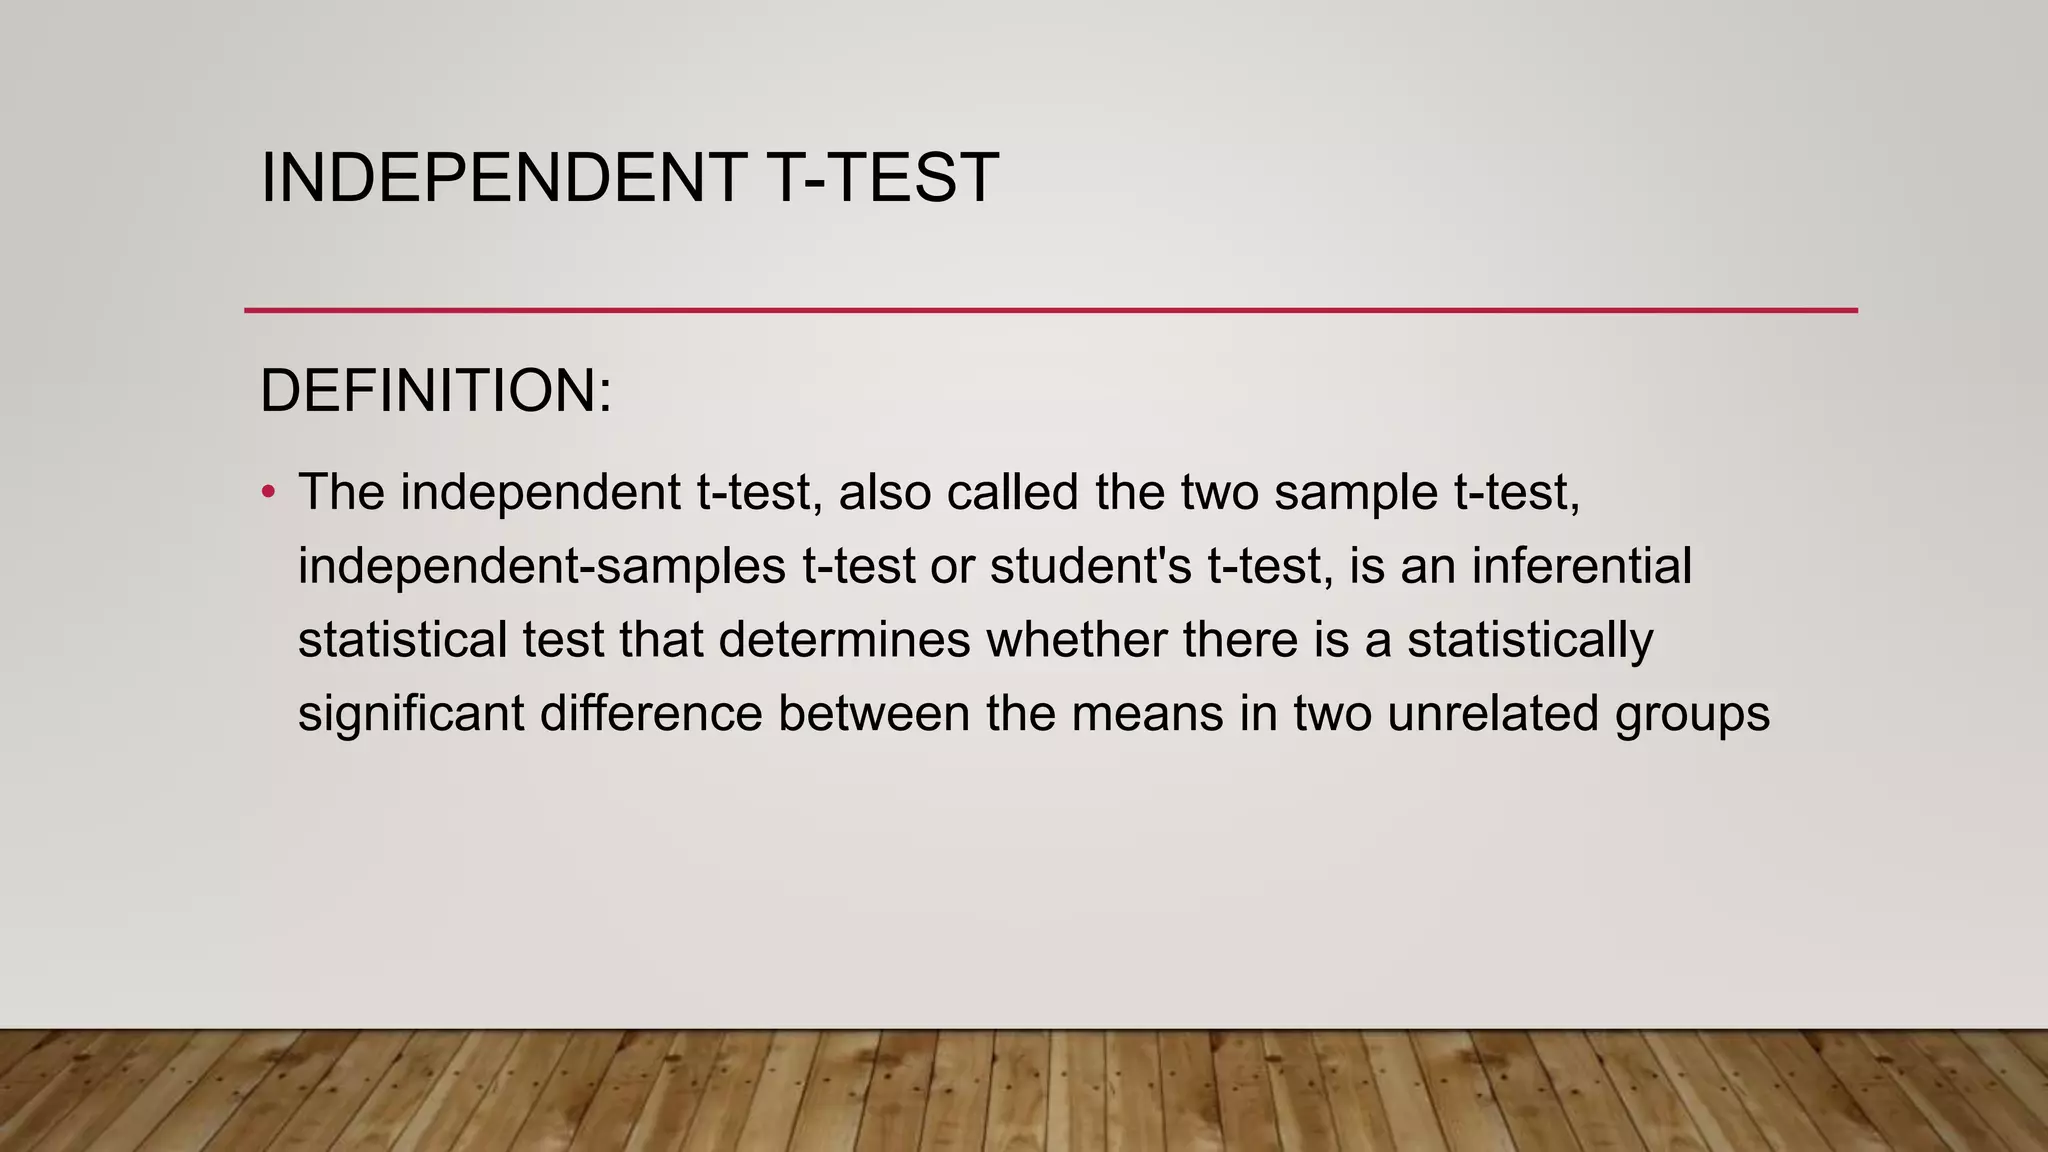
• Theindependent t-test, also called the two sample t-test,
independent-samples t-test or student's t-test, is an inferential
statistical test that determines whether there is a statistically
significant difference between the means in two unrelated groups
5.
INTRODUCTION
• The independent-samplest-test (or independent t-test, for short) compares the
means between two unrelated groups on the same continuous, dependent
variable. For example, you could use an independent t-test to understand
whether first year graduate salaries differed based on gender (i.e., your
dependent variable would be "first year graduate salaries" and your independent
variable would be "gender", which has two groups: "male" and "female").
Alternately, you could use an independent t-test to understand whether there is a
difference in test anxiety based on educational level (i.e., your dependent variable
would be "test anxiety" and your independent variable would be "educational
level", which has two groups: "undergraduates" and "postgraduates").
6.
INDEPENDENT T-TEST ASSUMPTIONS
•Assumption #1: Your dependent variable should be measured on
a continuous scale (i.e., it is measured at
the interval or ratio level). Examples of variables that meet this
criterion include revision time (measured in hours), intelligence
(measured using IQ score), exam performance (measured from 0 to
100), weight (measured in kg), and so forth. You can learn more
about continuous variables in our article: Types of Variable.
7.
• Assumption #2:Your independent variable should consist of two
categorical, independent groups. Example independent variables
that meet this criterion include gender (2 groups: male or female),
employment status (2 groups: employed or unemployed), smoker (2
groups: yes or no), and so forth.
8.
• Assumption #3:You should have independence of observations, which
means that there is no relationship between the observations in each group or
between the groups themselves. For example, there must be different participants
in each group with no participant being in more than one group. This is more of a
study design issue than something you can test for, but it is an important
assumption of the independent t-test. If your study fails this assumption, you will
need to use another statistical test instead of the independent t-test (e.g., a
paired-samples t-test). If you are unsure whether your study meets this
assumption, you can use our Statistical Test Selector, which is part of our
enhanced content.
9.
• Assumption #4:There should be no significant outliers. Outliers are simply
single data points within your data that do not follow the usual pattern (e.g., in a
study of 100 students' IQ scores, where the mean score was 108 with only a
small variation between students, one student had a score of 156, which is very
unusual, and may even put her in the top 1% of IQ scores globally). The problem
with outliers is that they can have a negative effect on the independent t-test,
reducing the validity of your results. Fortunately, when using SPSS Statistics to
run an independent t-test on your data, you can easily detect possible outliers. In
our enhanced independent t-test guide, we: (a) show you how to detect outliers
using SPSS Statistics; and (b) discuss some of the options you have in order to
deal with outliers.
10.
• Assumption #5:Your dependent variable should be approximately normally
distributed for each group of the independent variable. We talk about the
independent t-test only requiring approximately normal data because it is quite
"robust" to violations of normality, meaning that this assumption can be a little
violated and still provide valid results. You can test for normality using the
Shapiro-Wilk test of normality, which is easily tested for using SPSS Statistics. In
addition to showing you how to do this in our enhanced independent t-test guide,
we also explain what you can do if your data fails this assumption (i.e., if it fails it
more than a little bit).
12.
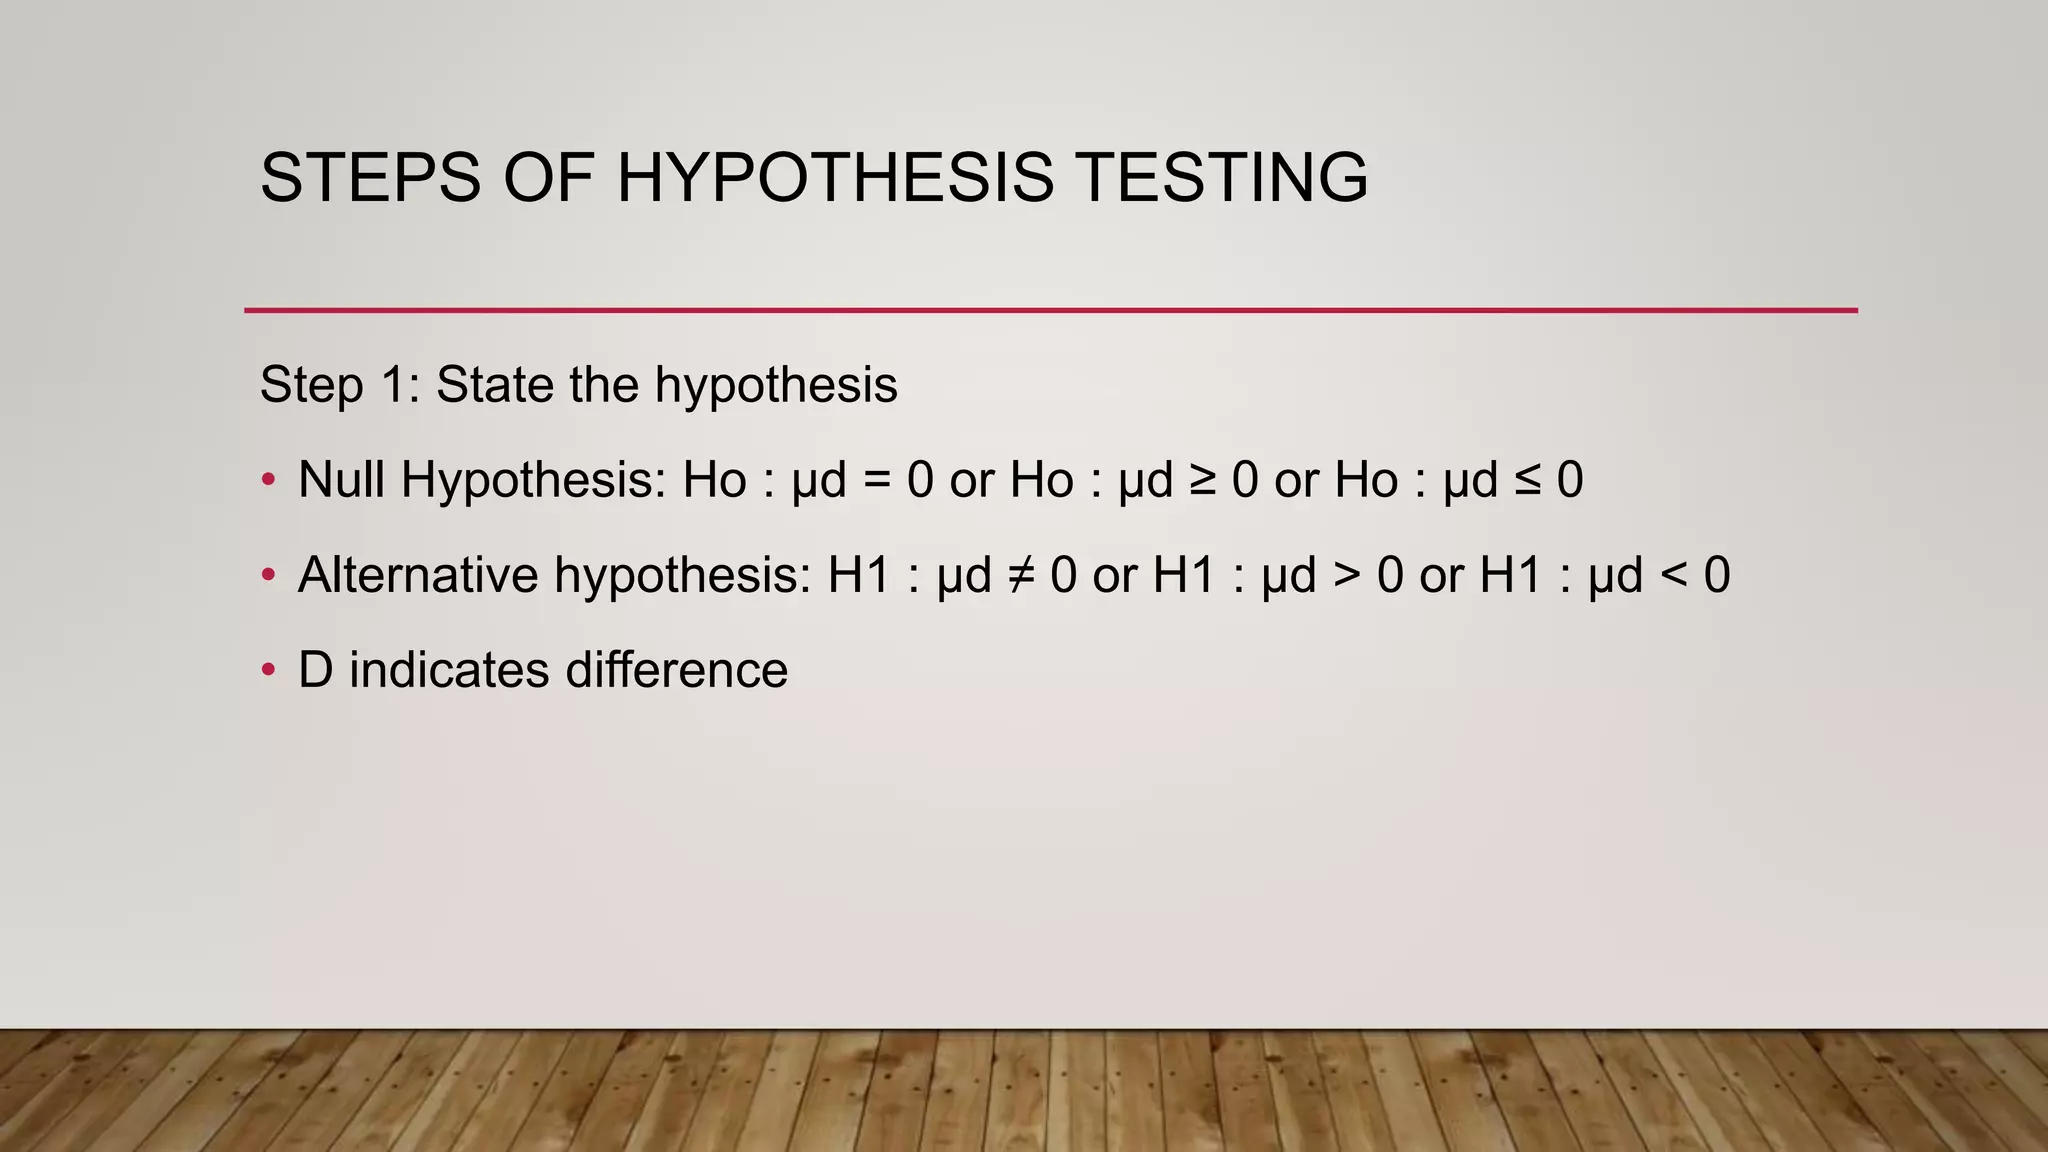
STEPS OF HYPOTHESISTESTING
Step 1: State the hypothesis
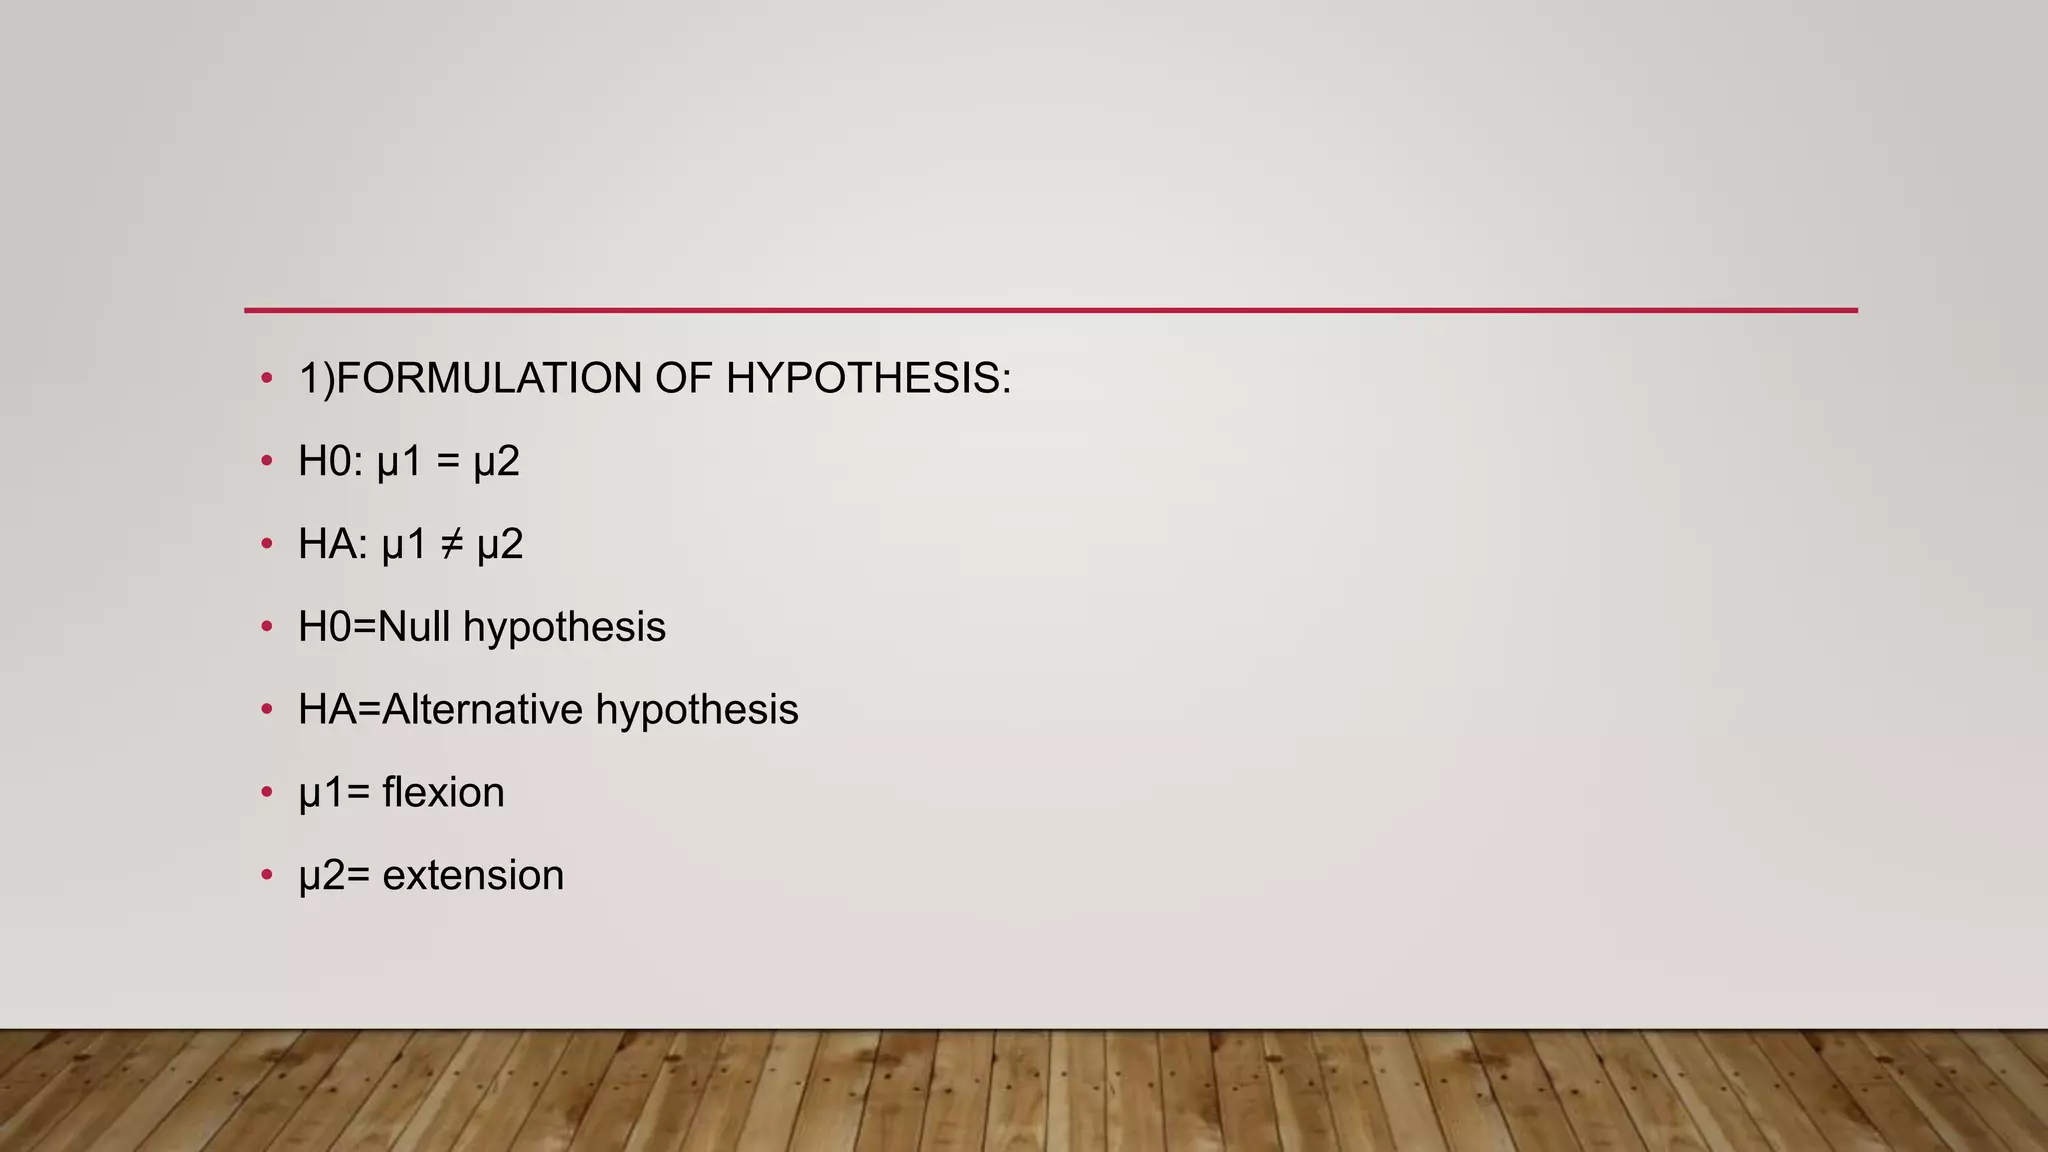
• Null Hypothesis: Ho : μd = 0 or Ho : μd ≥ 0 or Ho : μd ≤ 0
• Alternative hypothesis: H1 : μd ≠ 0 or H1 : μd > 0 or H1 : μd < 0
• D indicates difference
13.
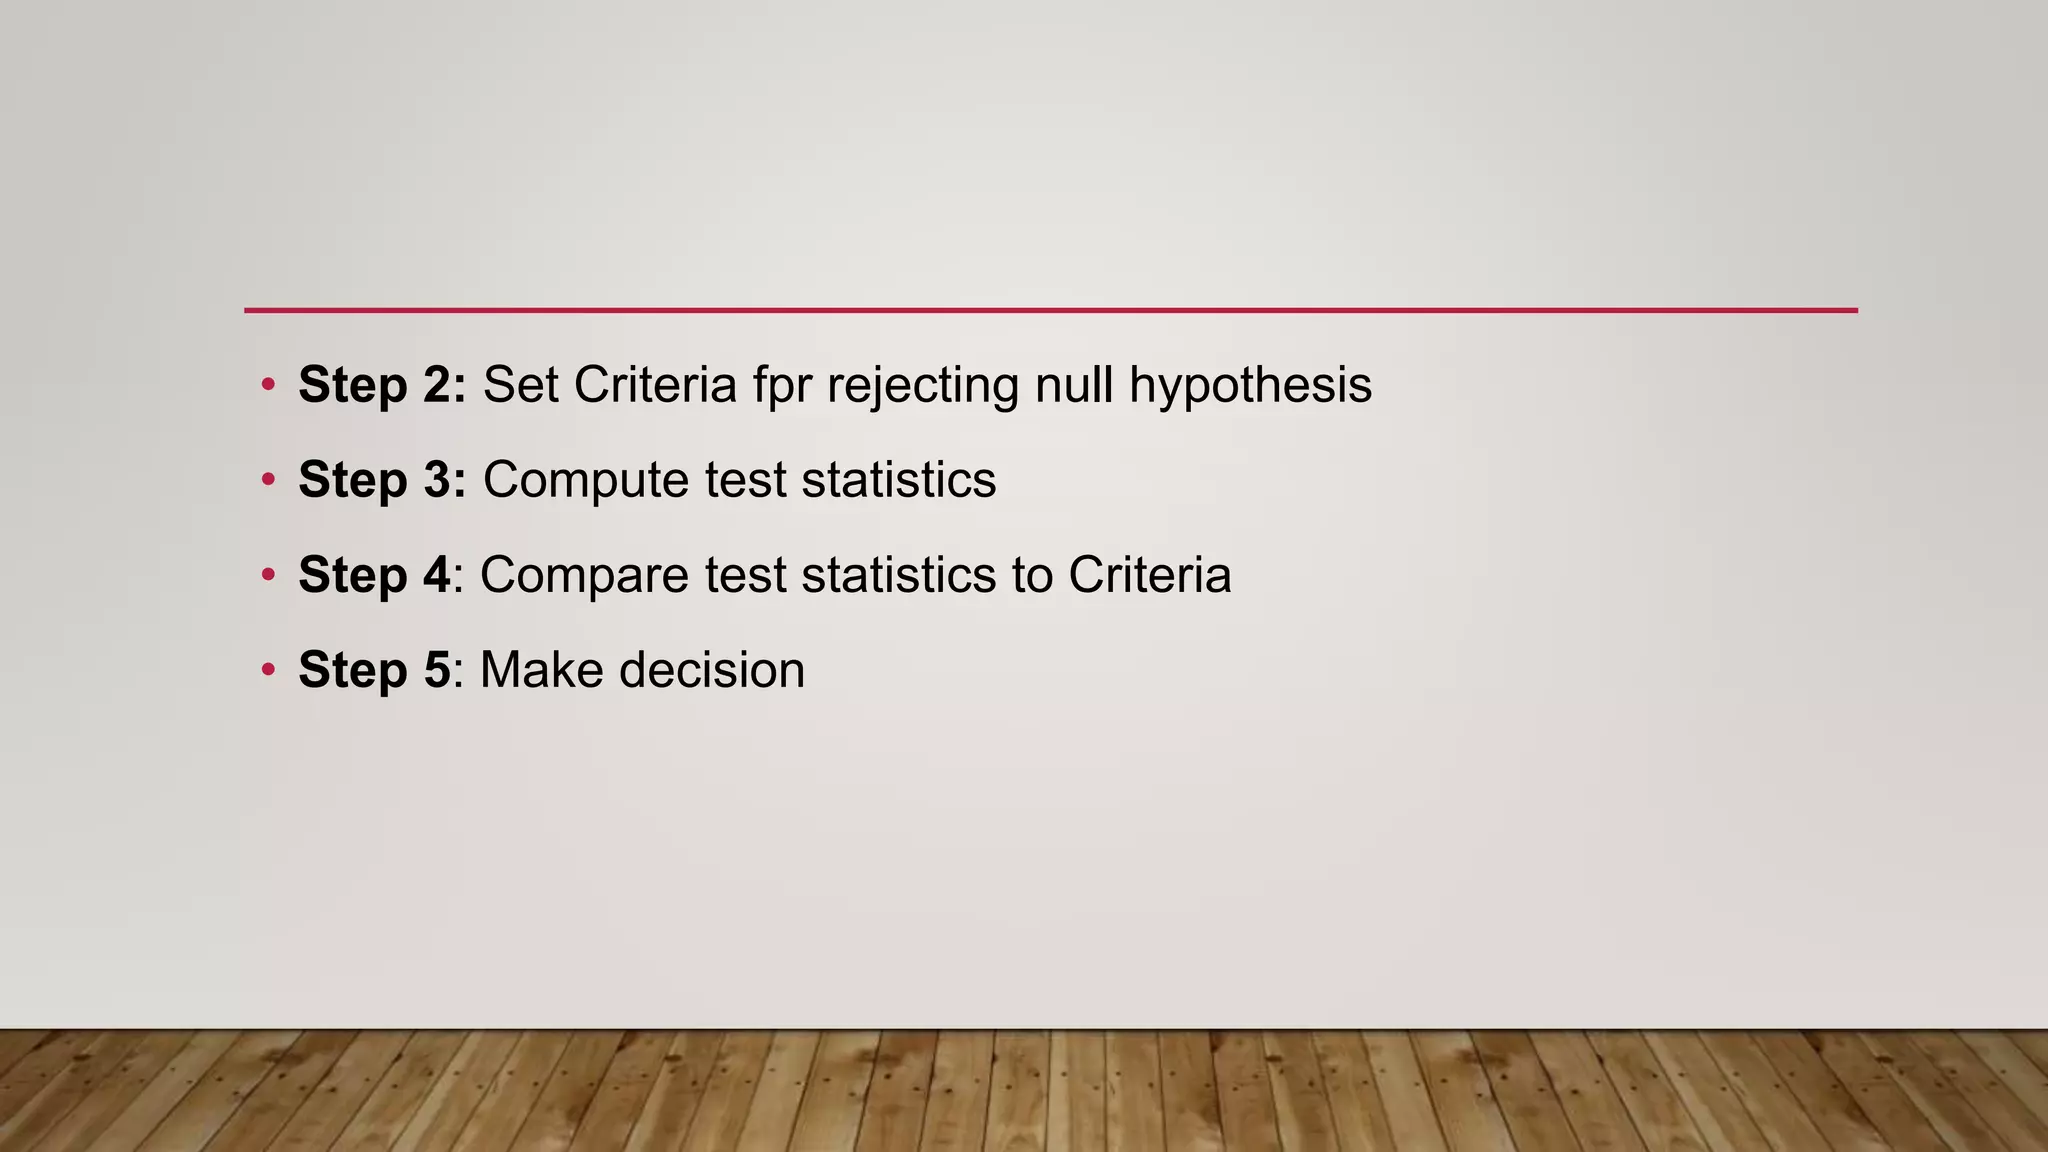
• Step 2:Set Criteria fpr rejecting null hypothesis
• Step 3: Compute test statistics
• Step 4: Compare test statistics to Criteria
• Step 5: Make decision
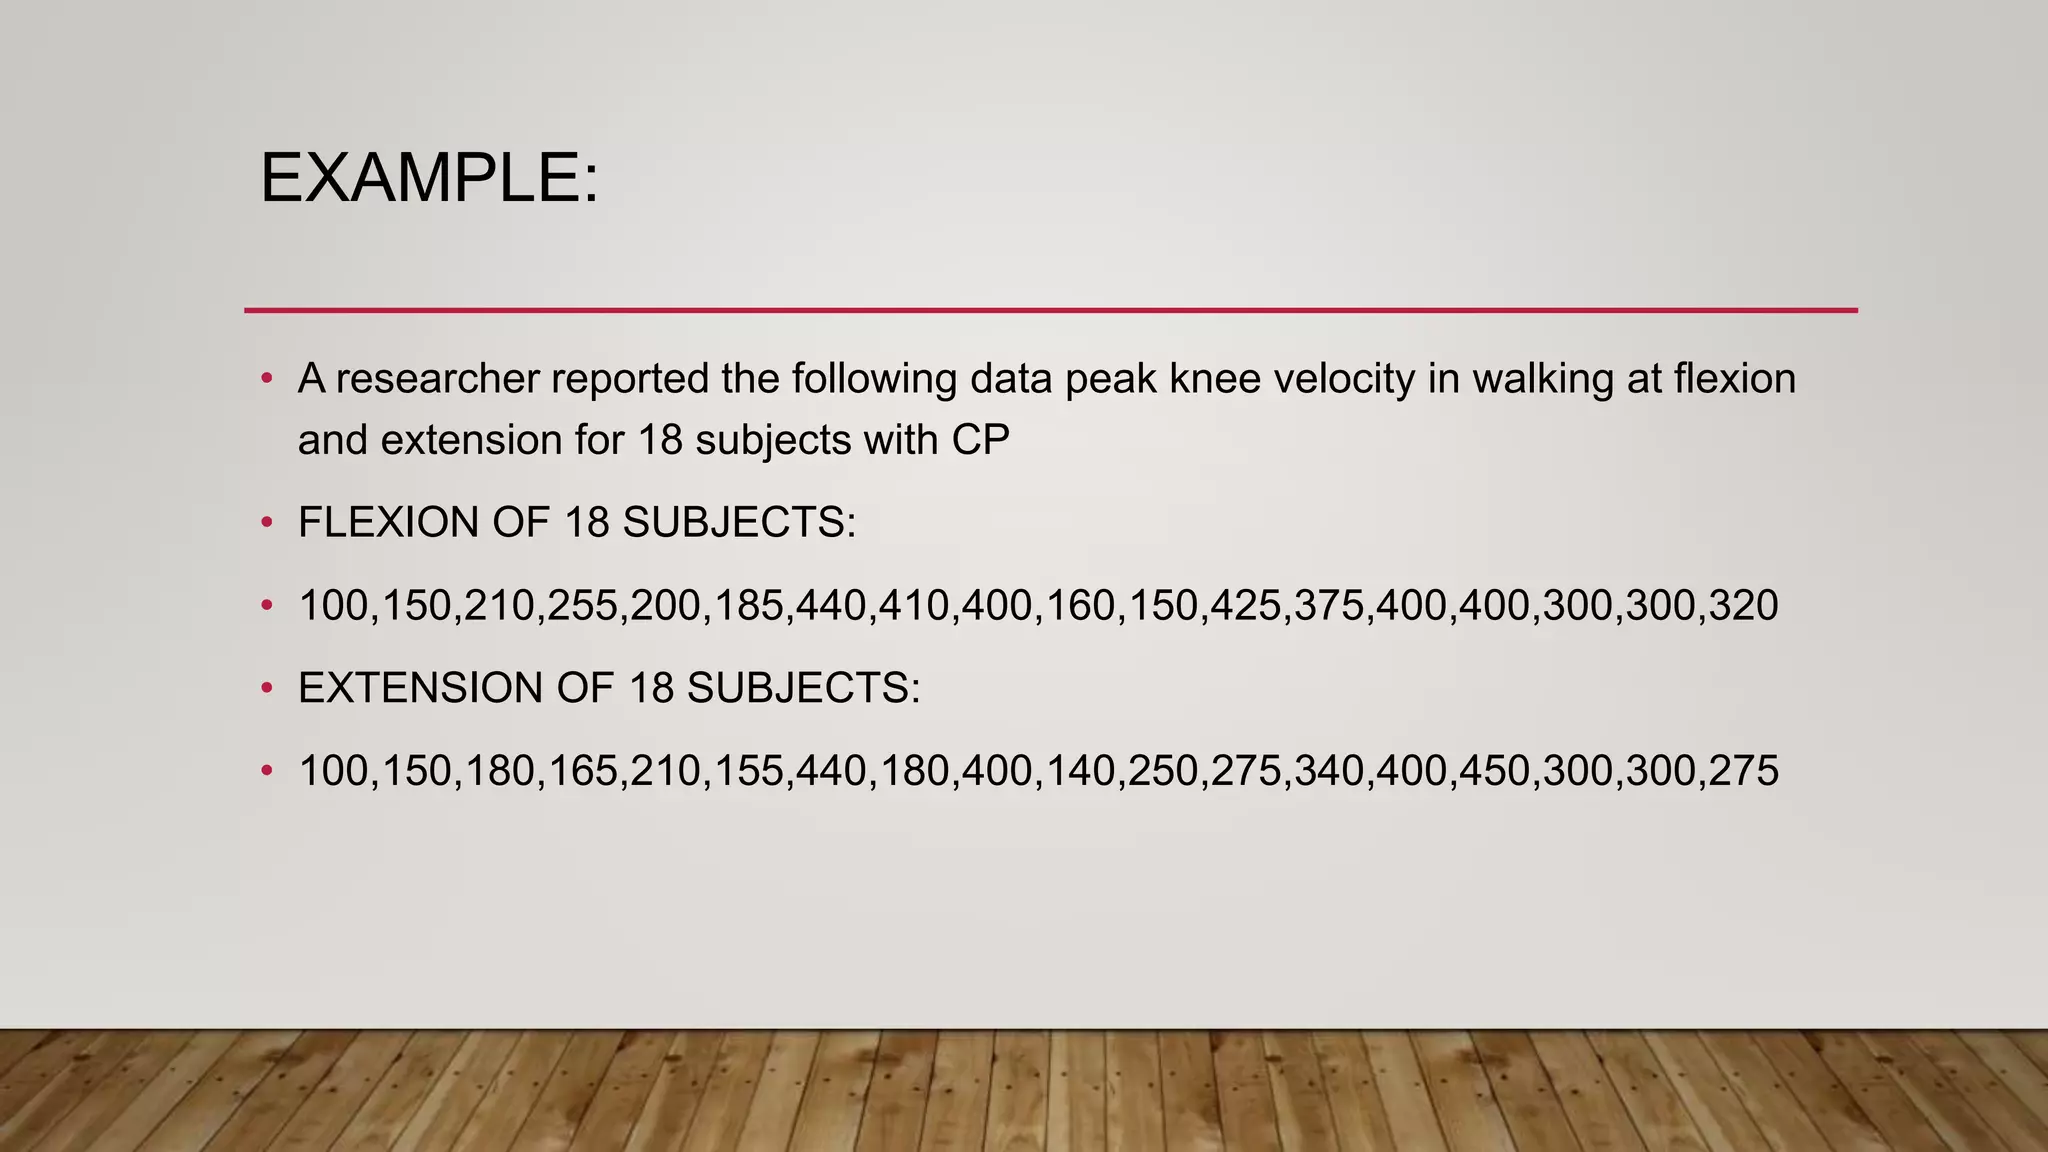
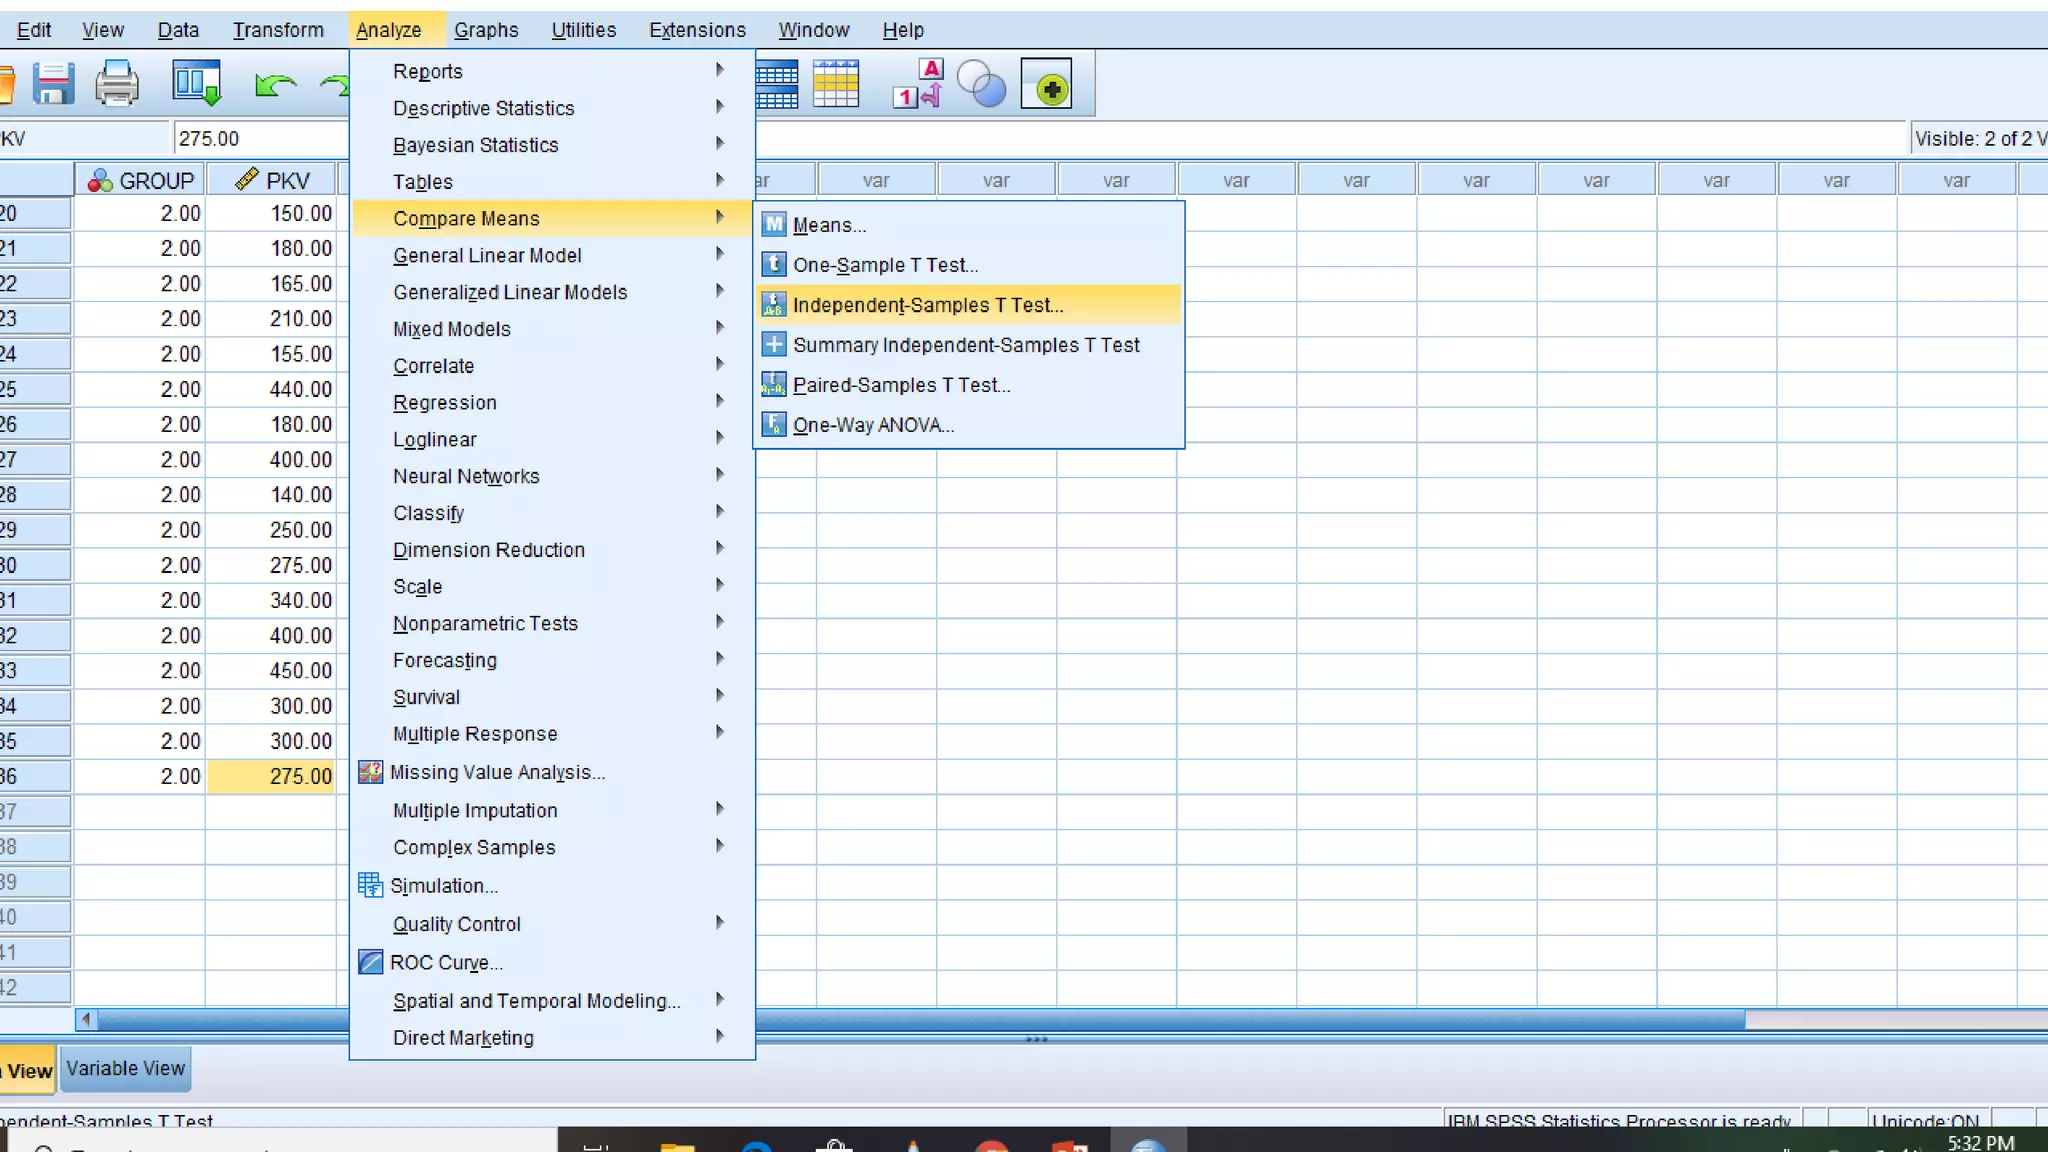
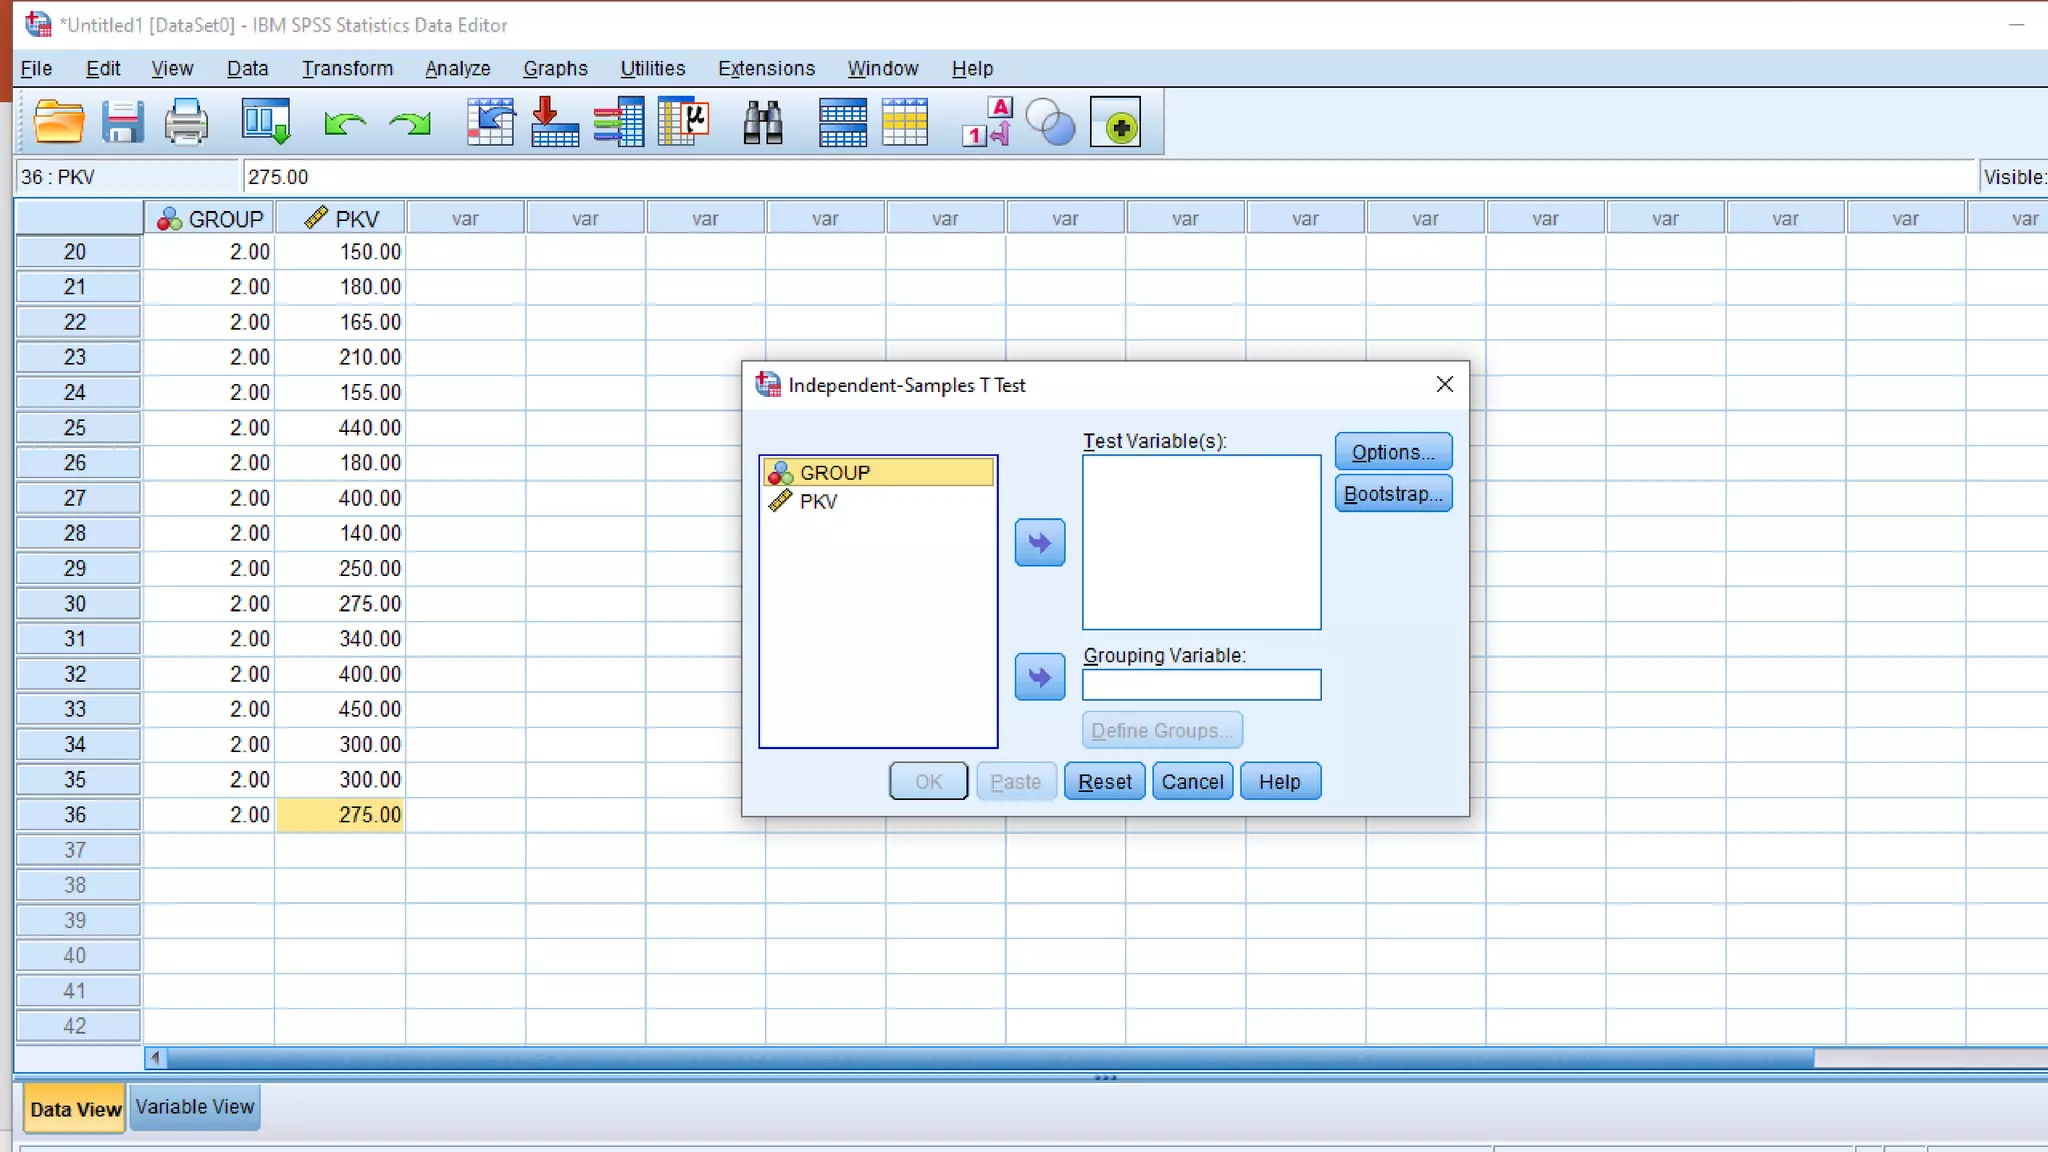
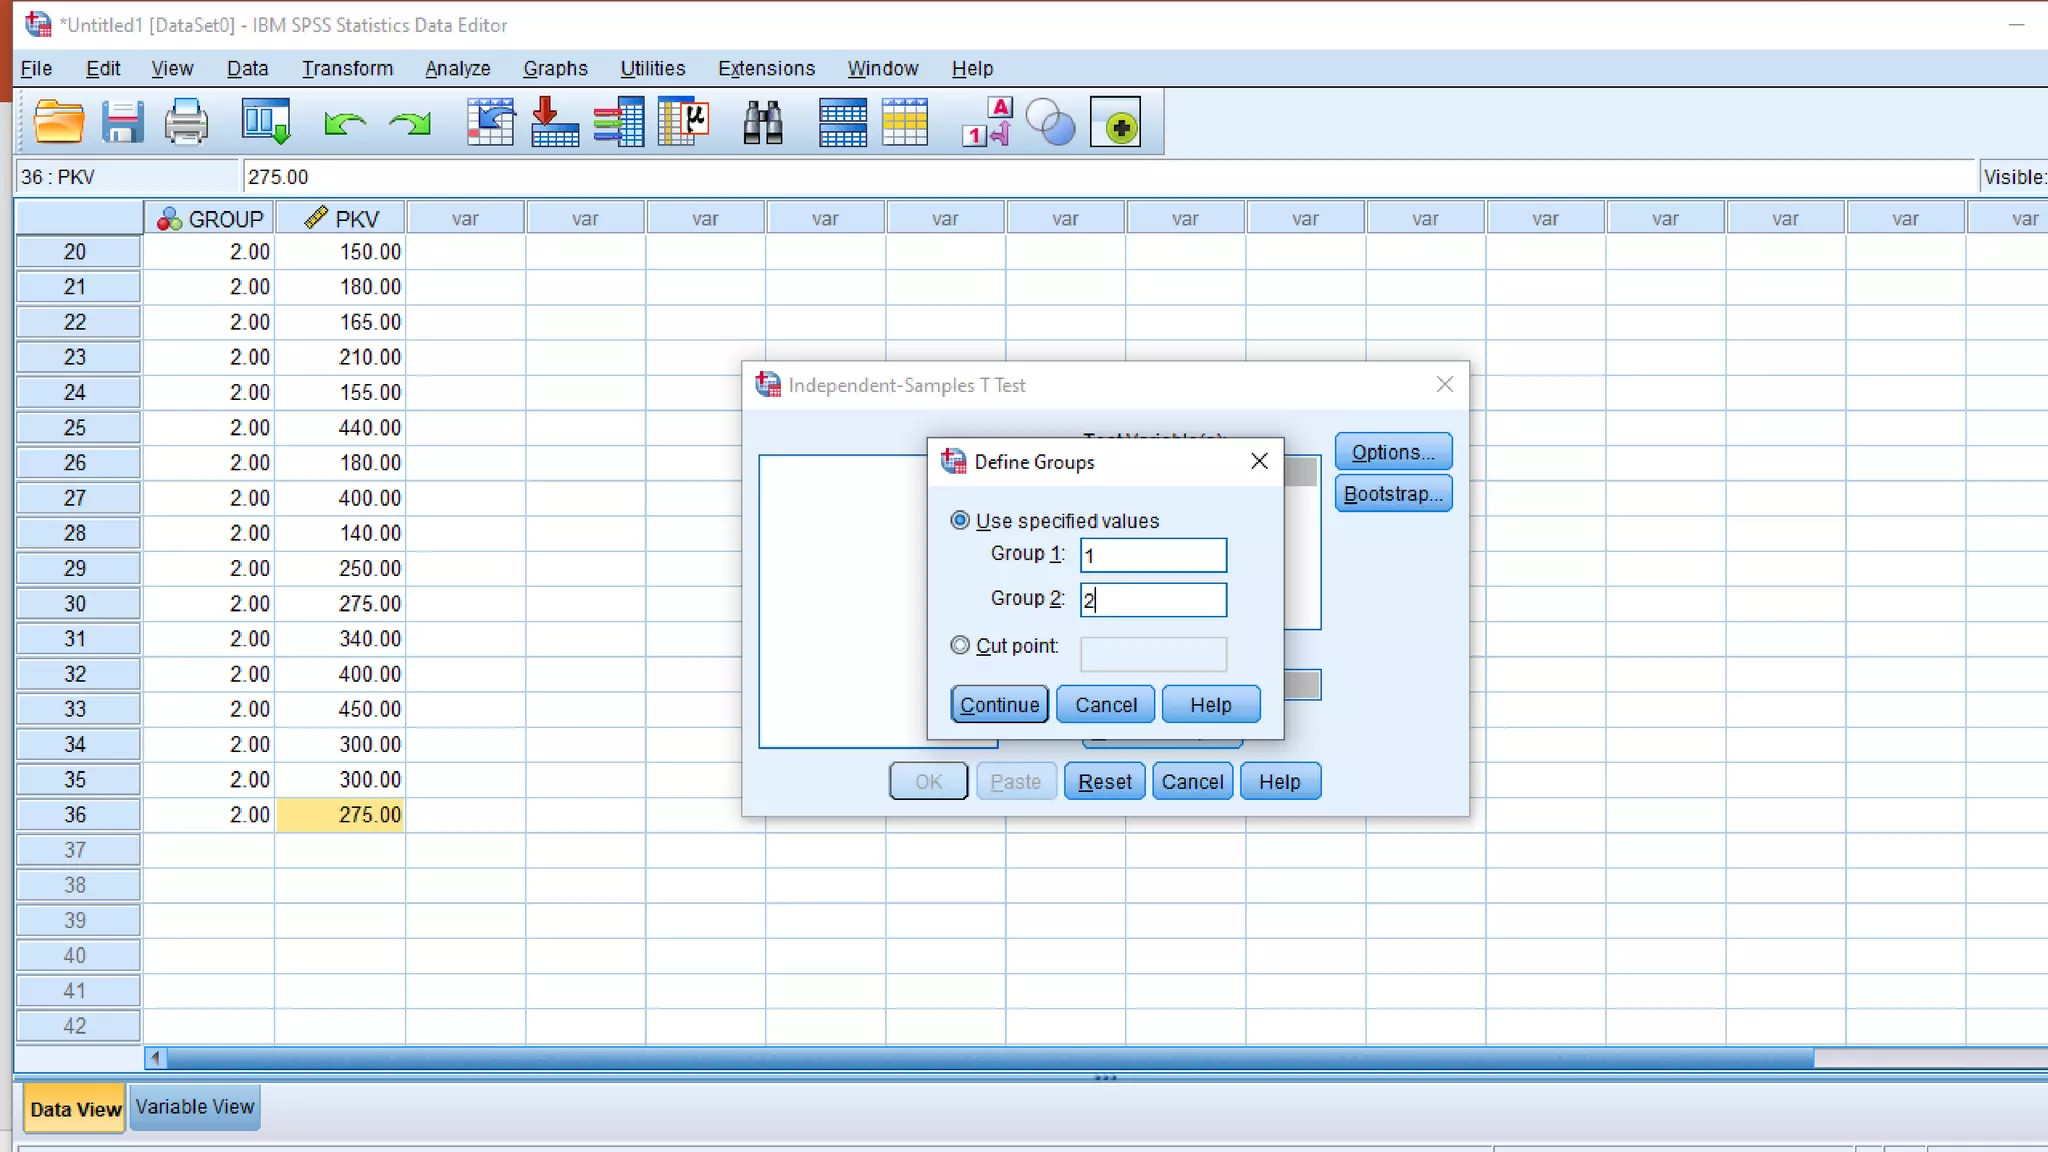
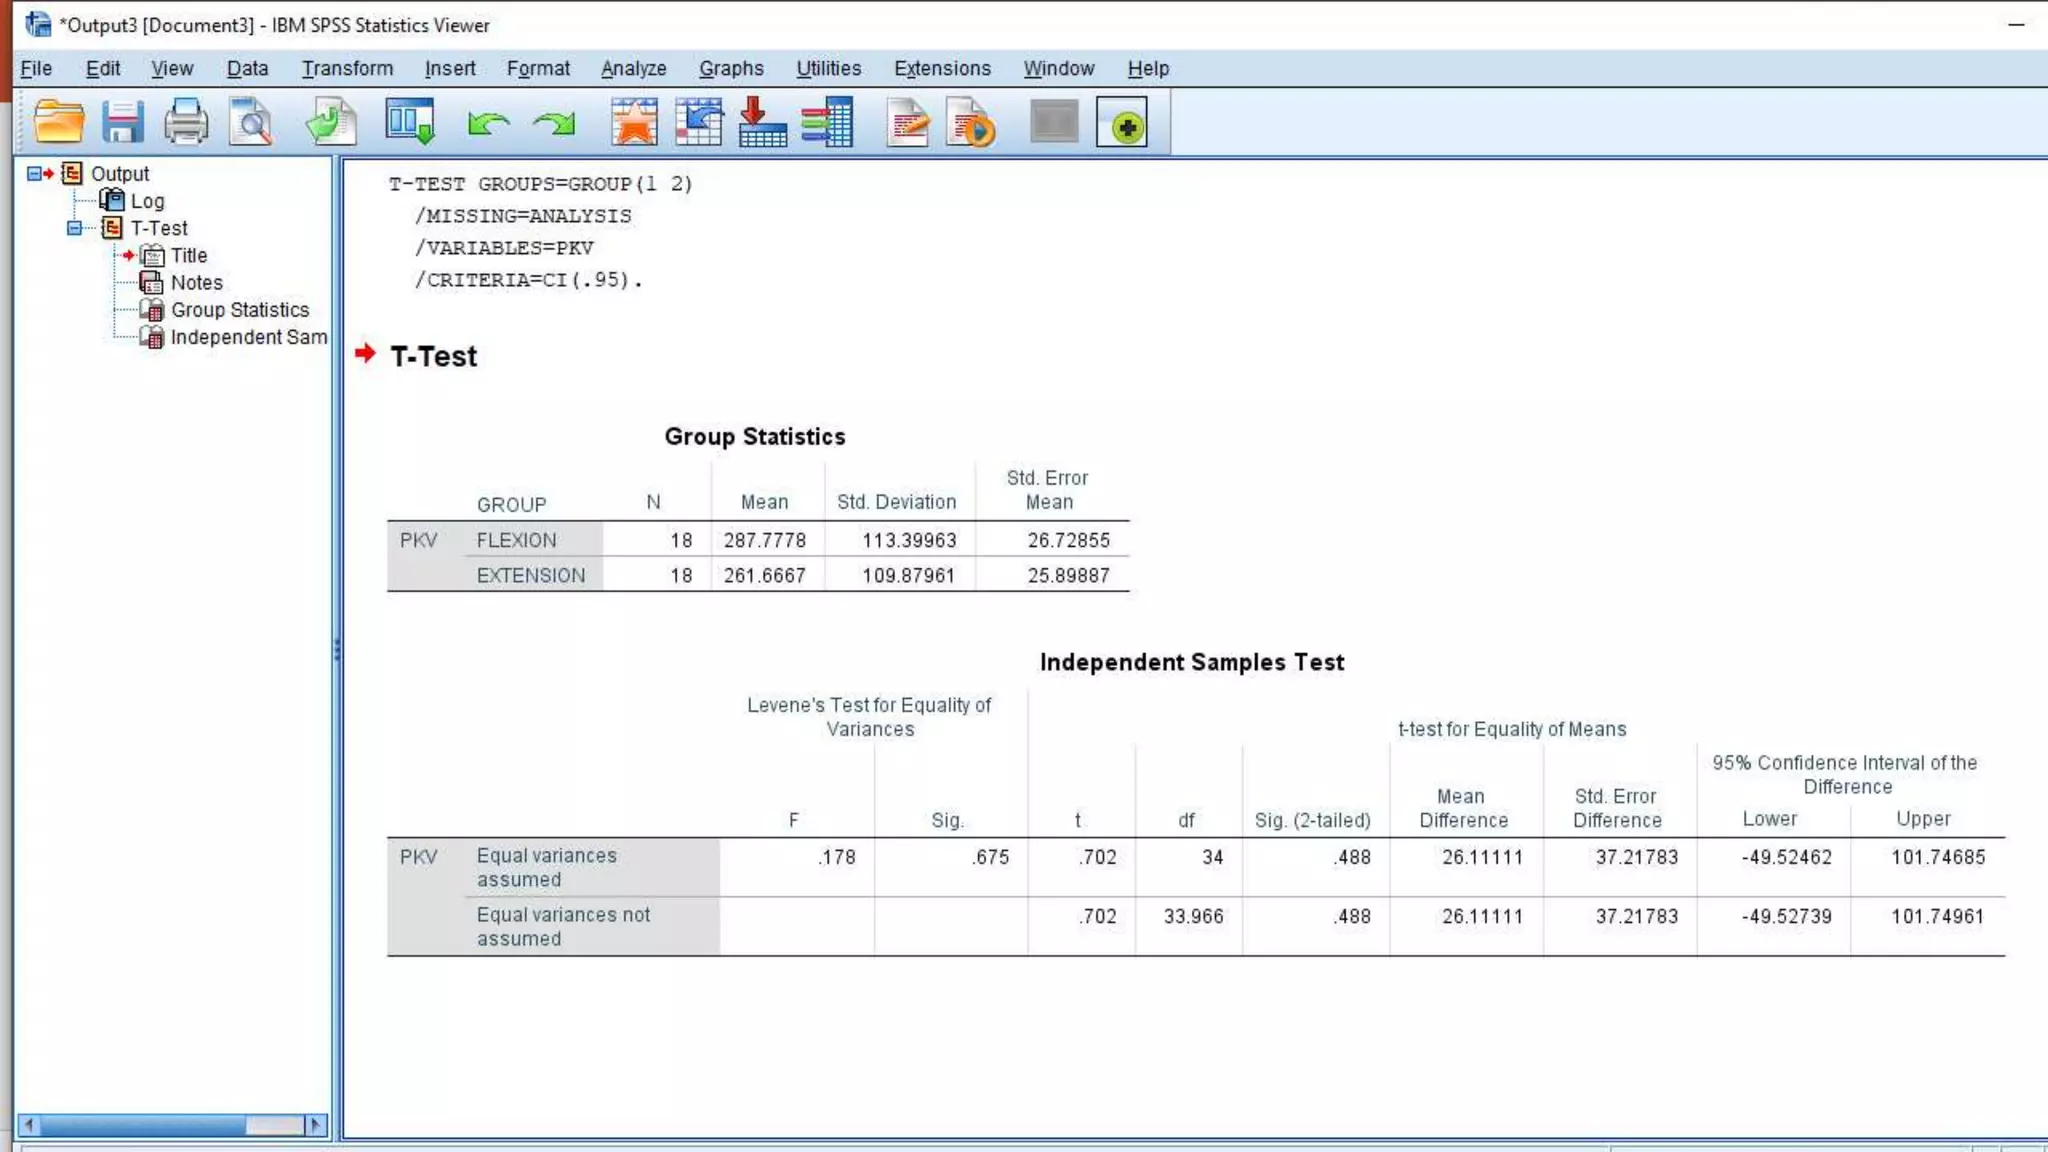
EXAMPLE:
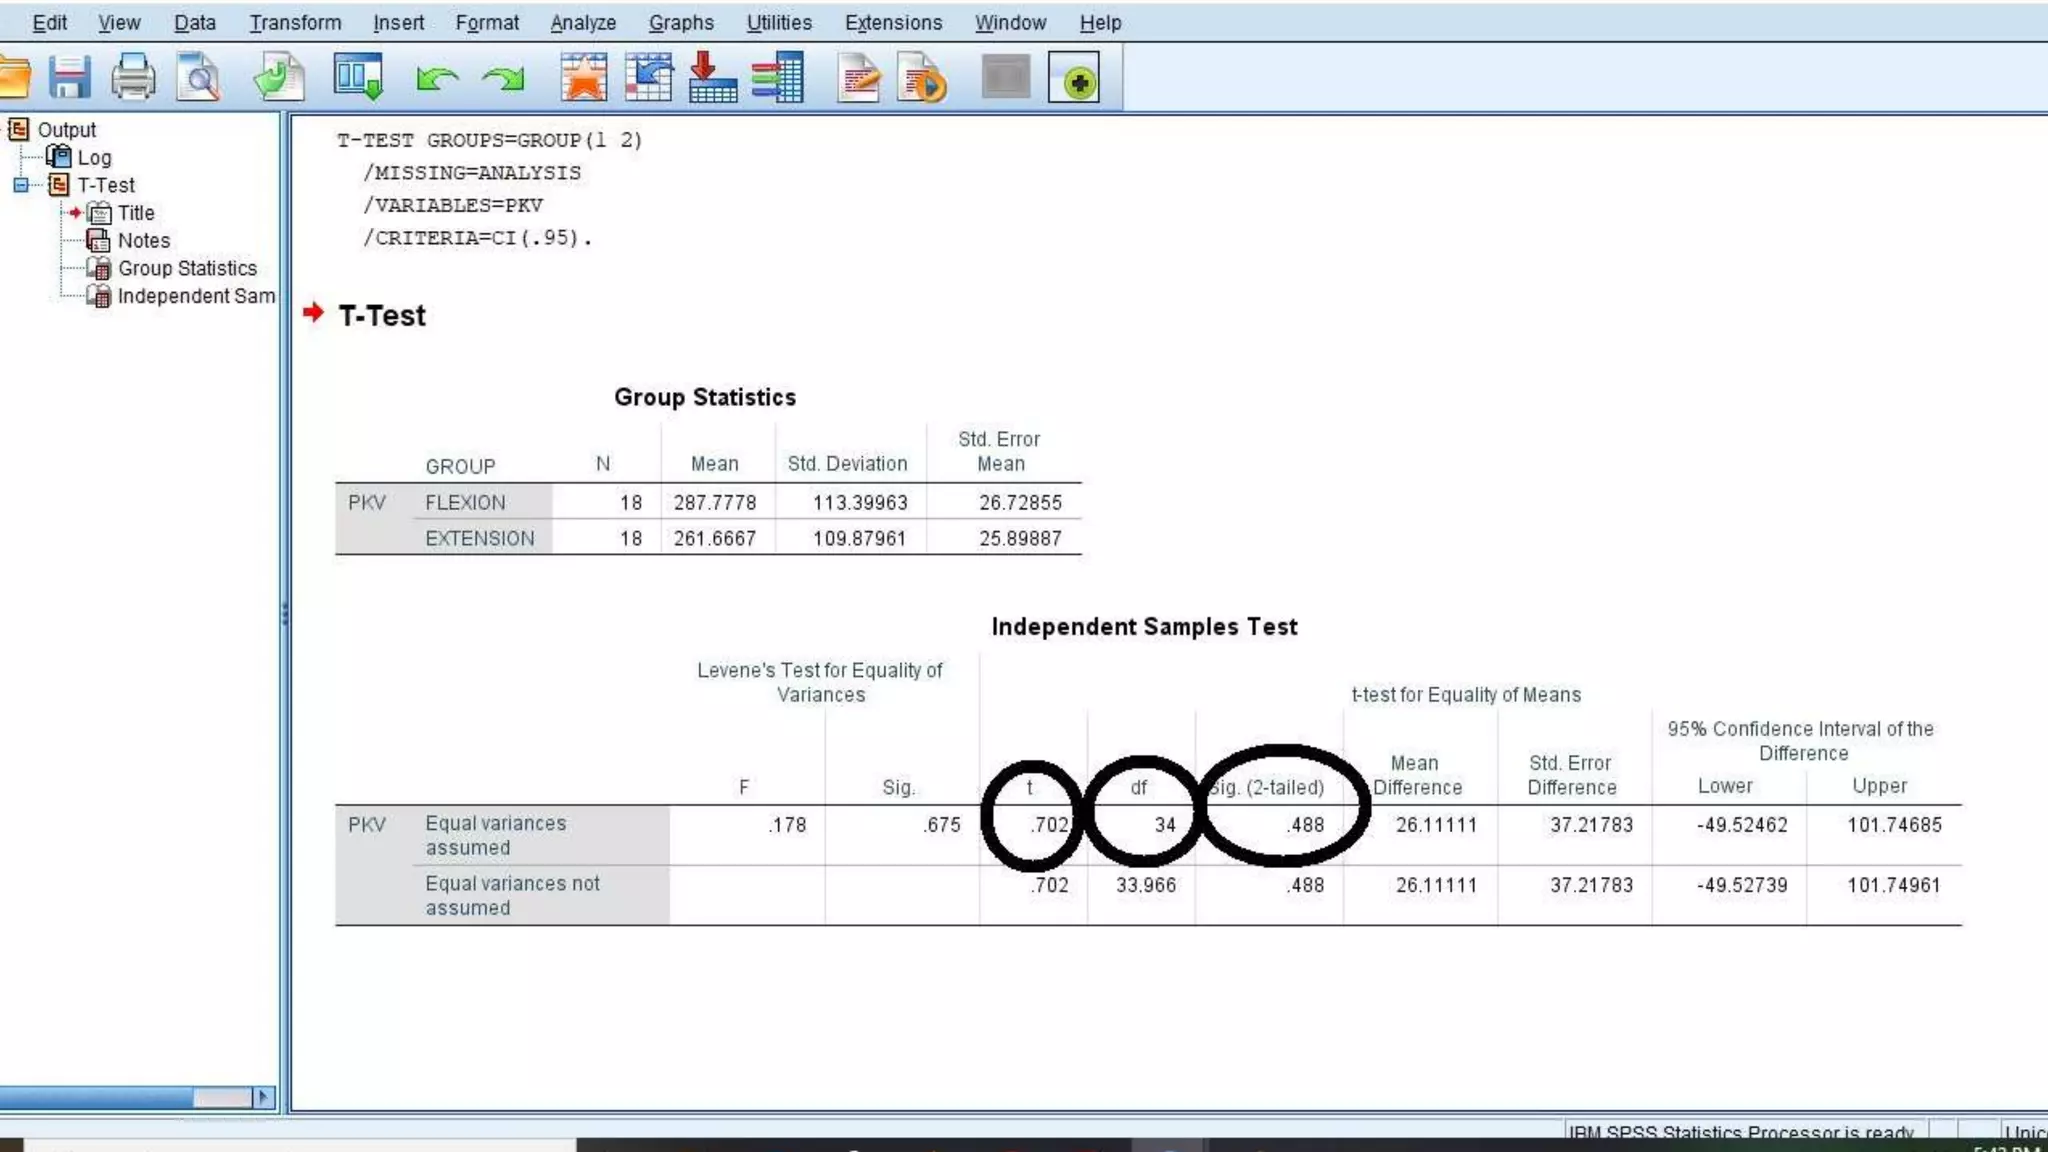
• A researcherreported the following data peak knee velocity in walking at flexion
and extension for 18 subjects with CP
• FLEXION OF 18 SUBJECTS:
• 100,150,210,255,200,185,440,410,400,160,150,425,375,400,400,300,300,320
• EXTENSION OF 18 SUBJECTS:
• 100,150,180,165,210,155,440,180,400,140,250,275,340,400,450,300,300,275
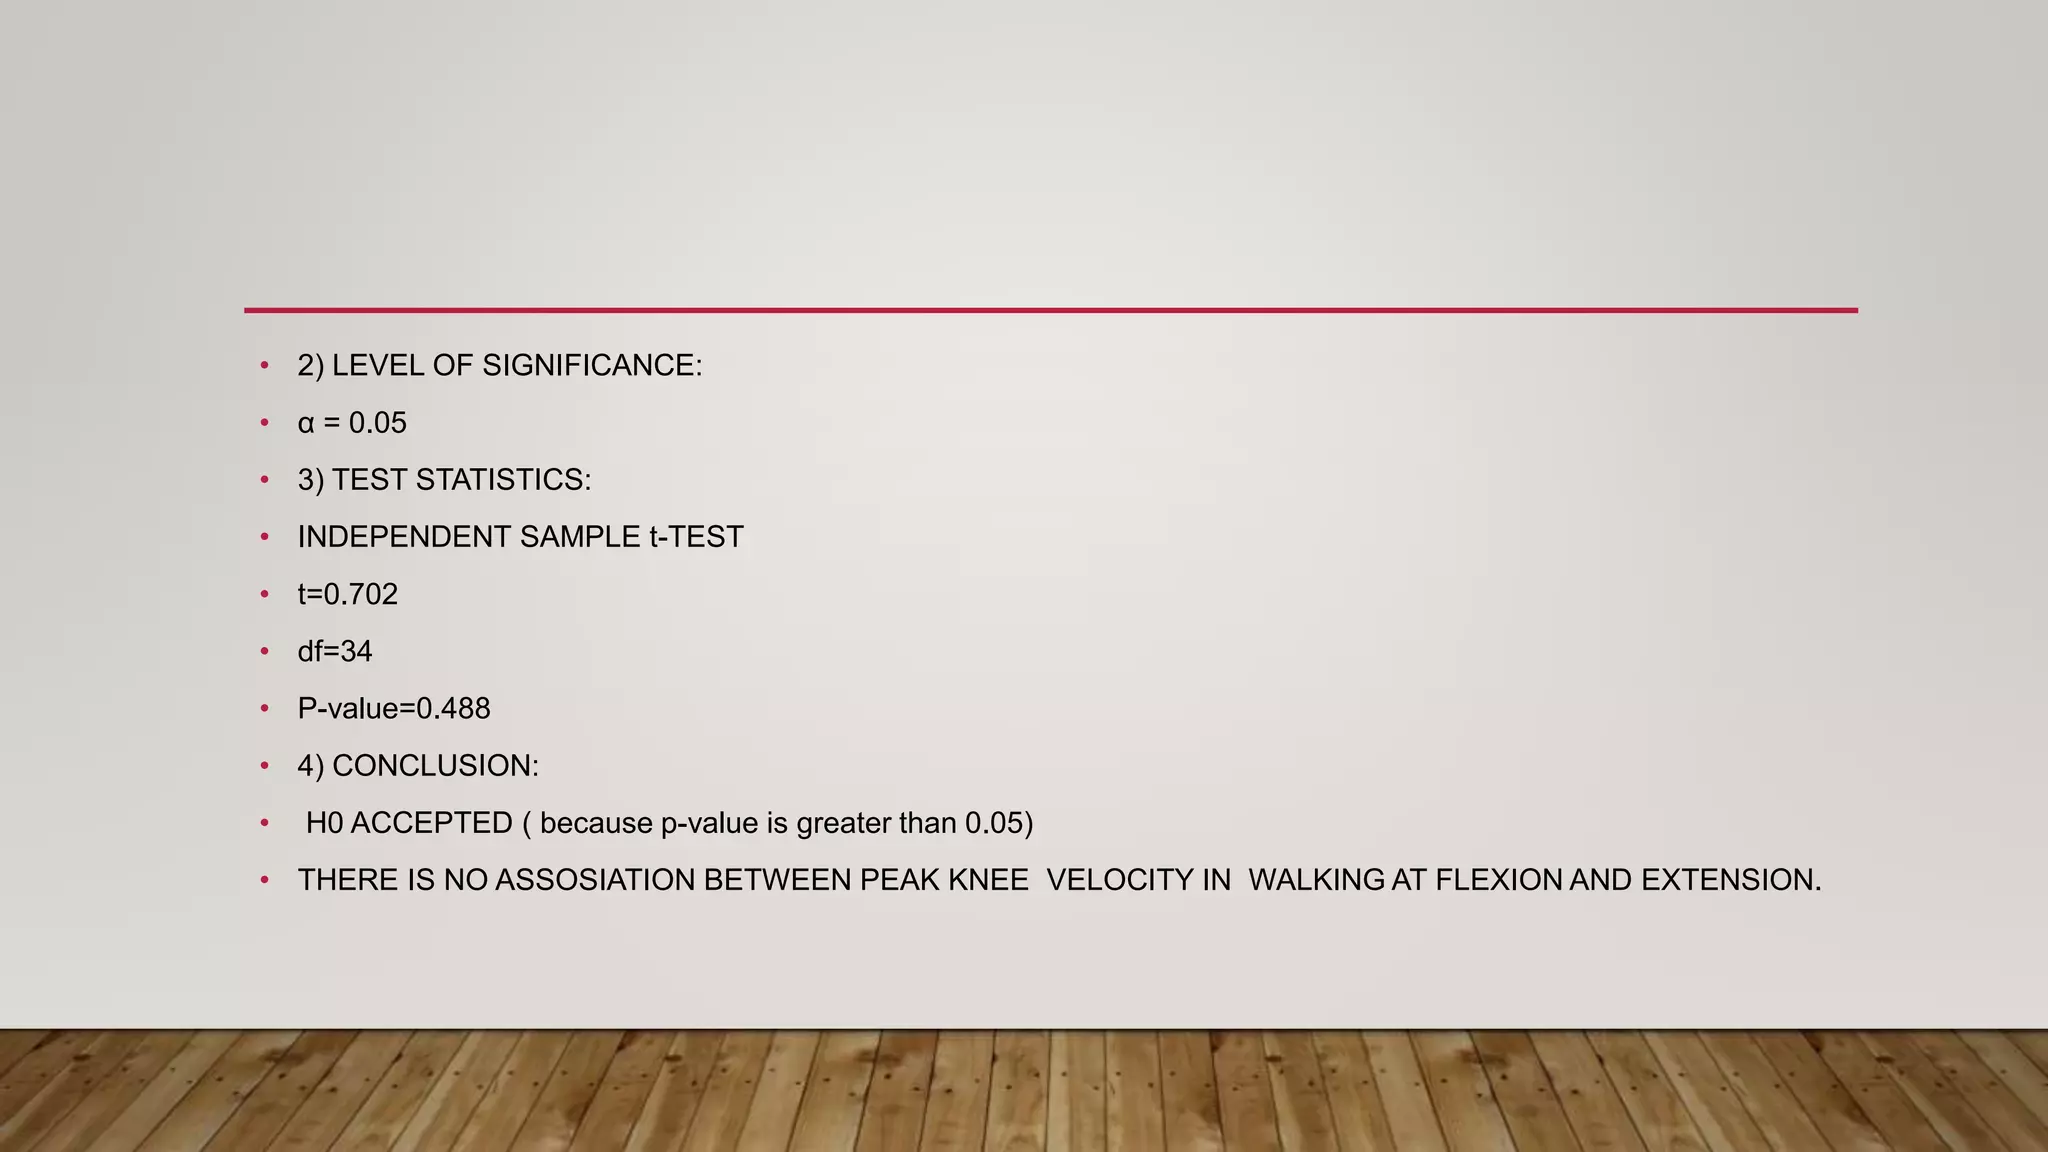
• 2) LEVELOF SIGNIFICANCE:
• α = 0.05
• 3) TEST STATISTICS:
• INDEPENDENT SAMPLE t-TEST
• t=0.702
• df=34
• P-value=0.488
• 4) CONCLUSION:
• H0 ACCEPTED ( because p-value is greater than 0.05)
• THERE IS NO ASSOSIATION BETWEEN PEAK KNEE VELOCITY IN WALKING AT FLEXION AND EXTENSION.
23.
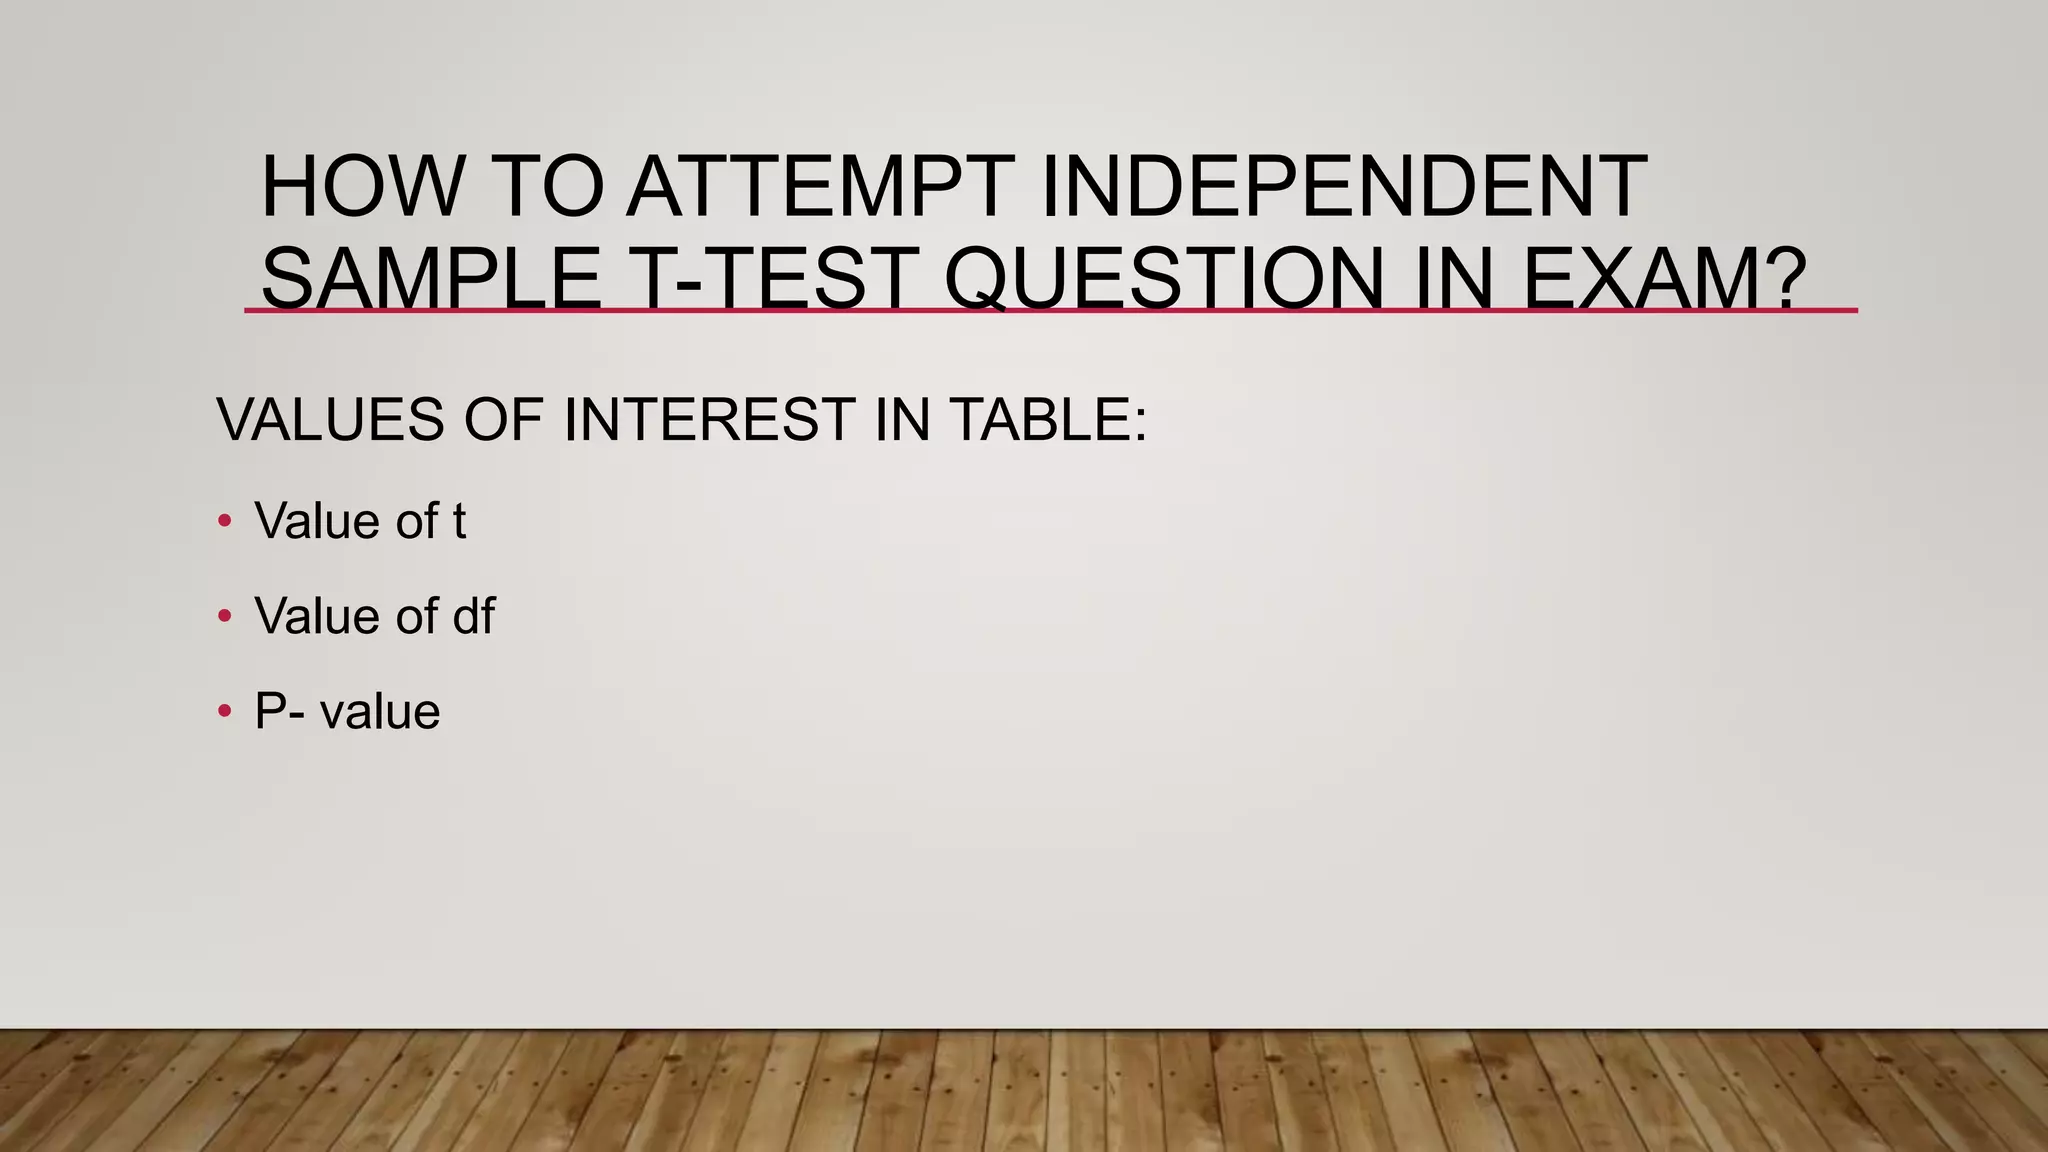
HOW TO ATTEMPTINDEPENDENT
SAMPLE T-TEST QUESTION IN EXAM?
VALUES OF INTEREST IN TABLE:
• Value of t
• Value of df
• P- value