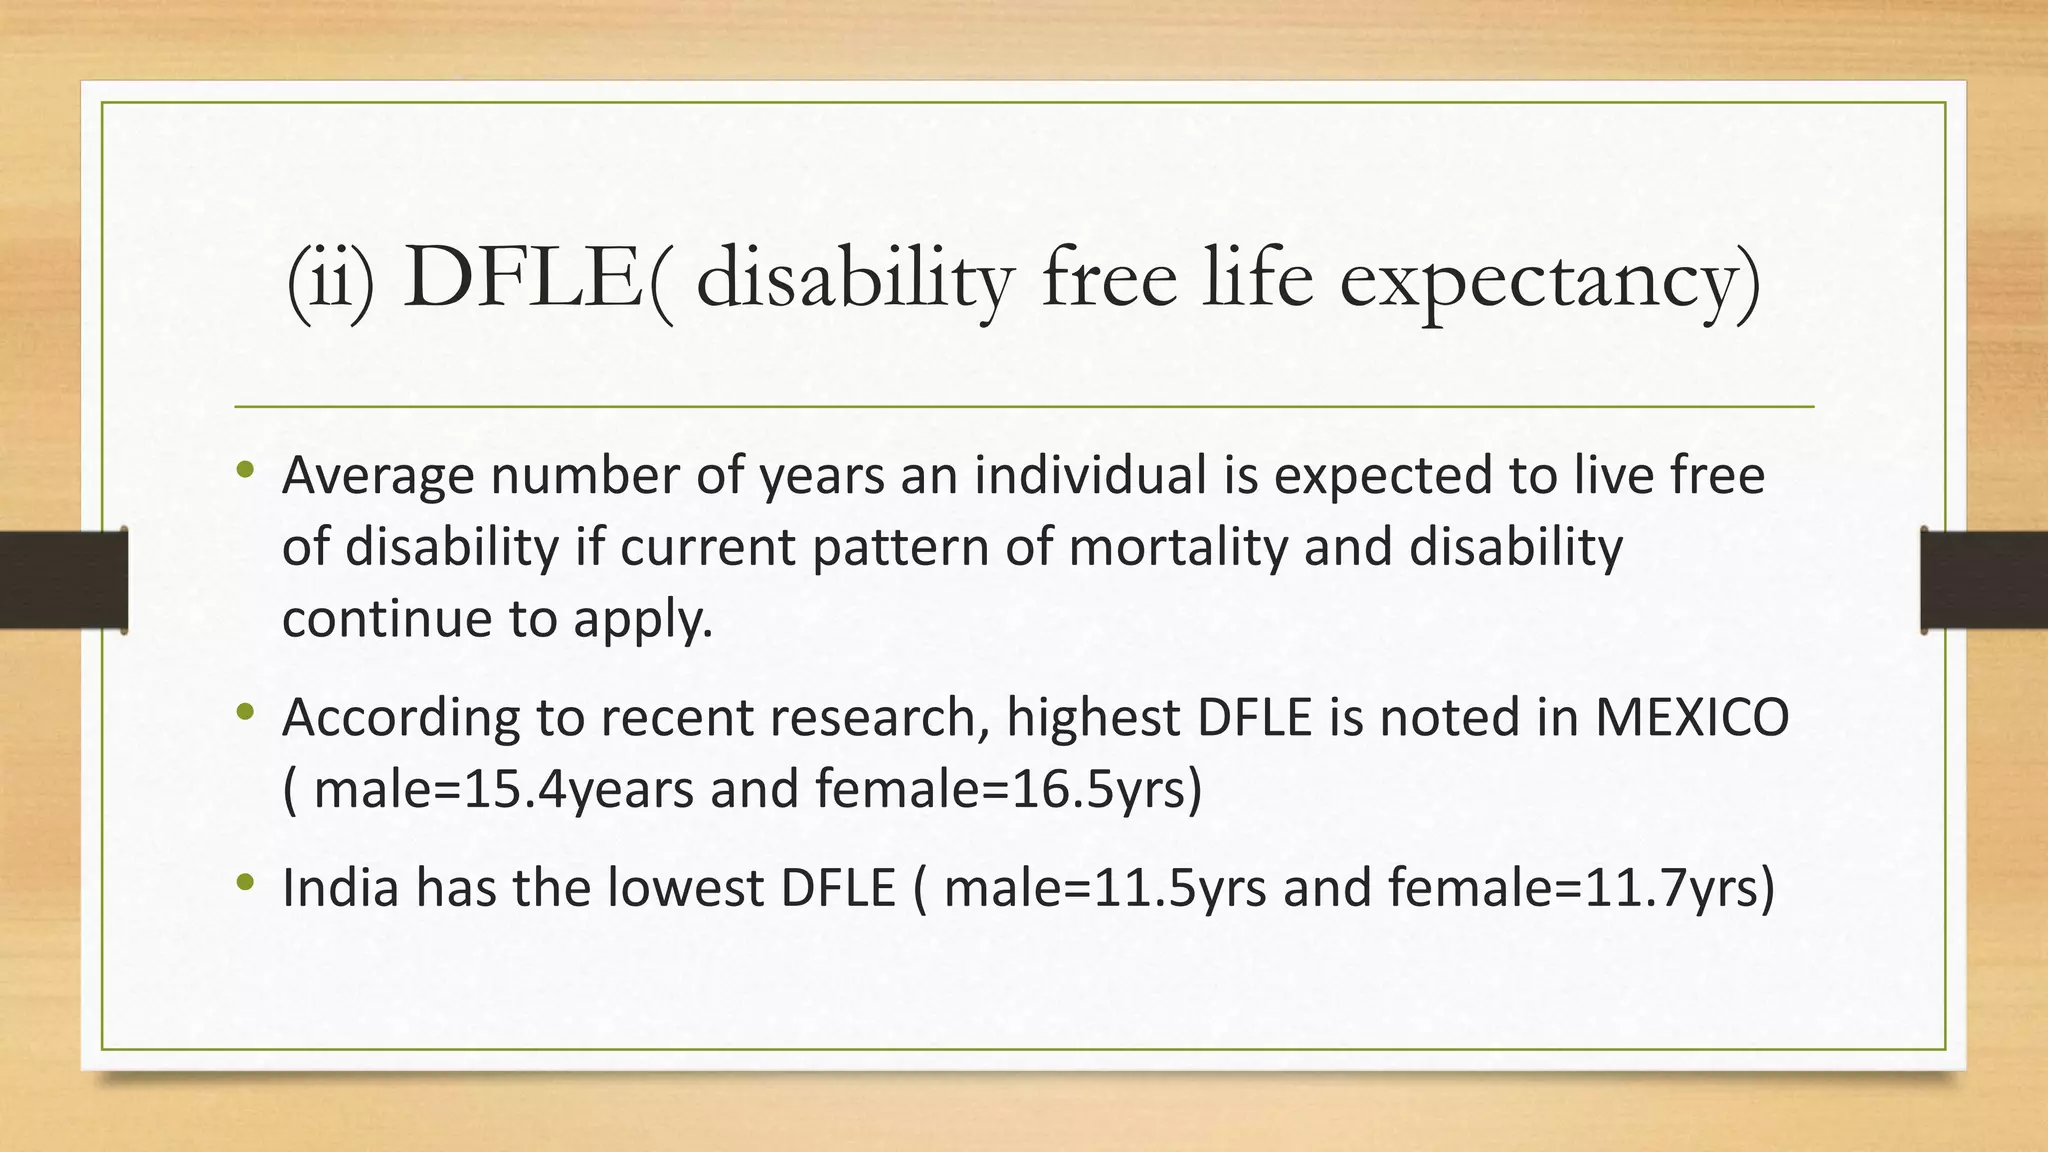
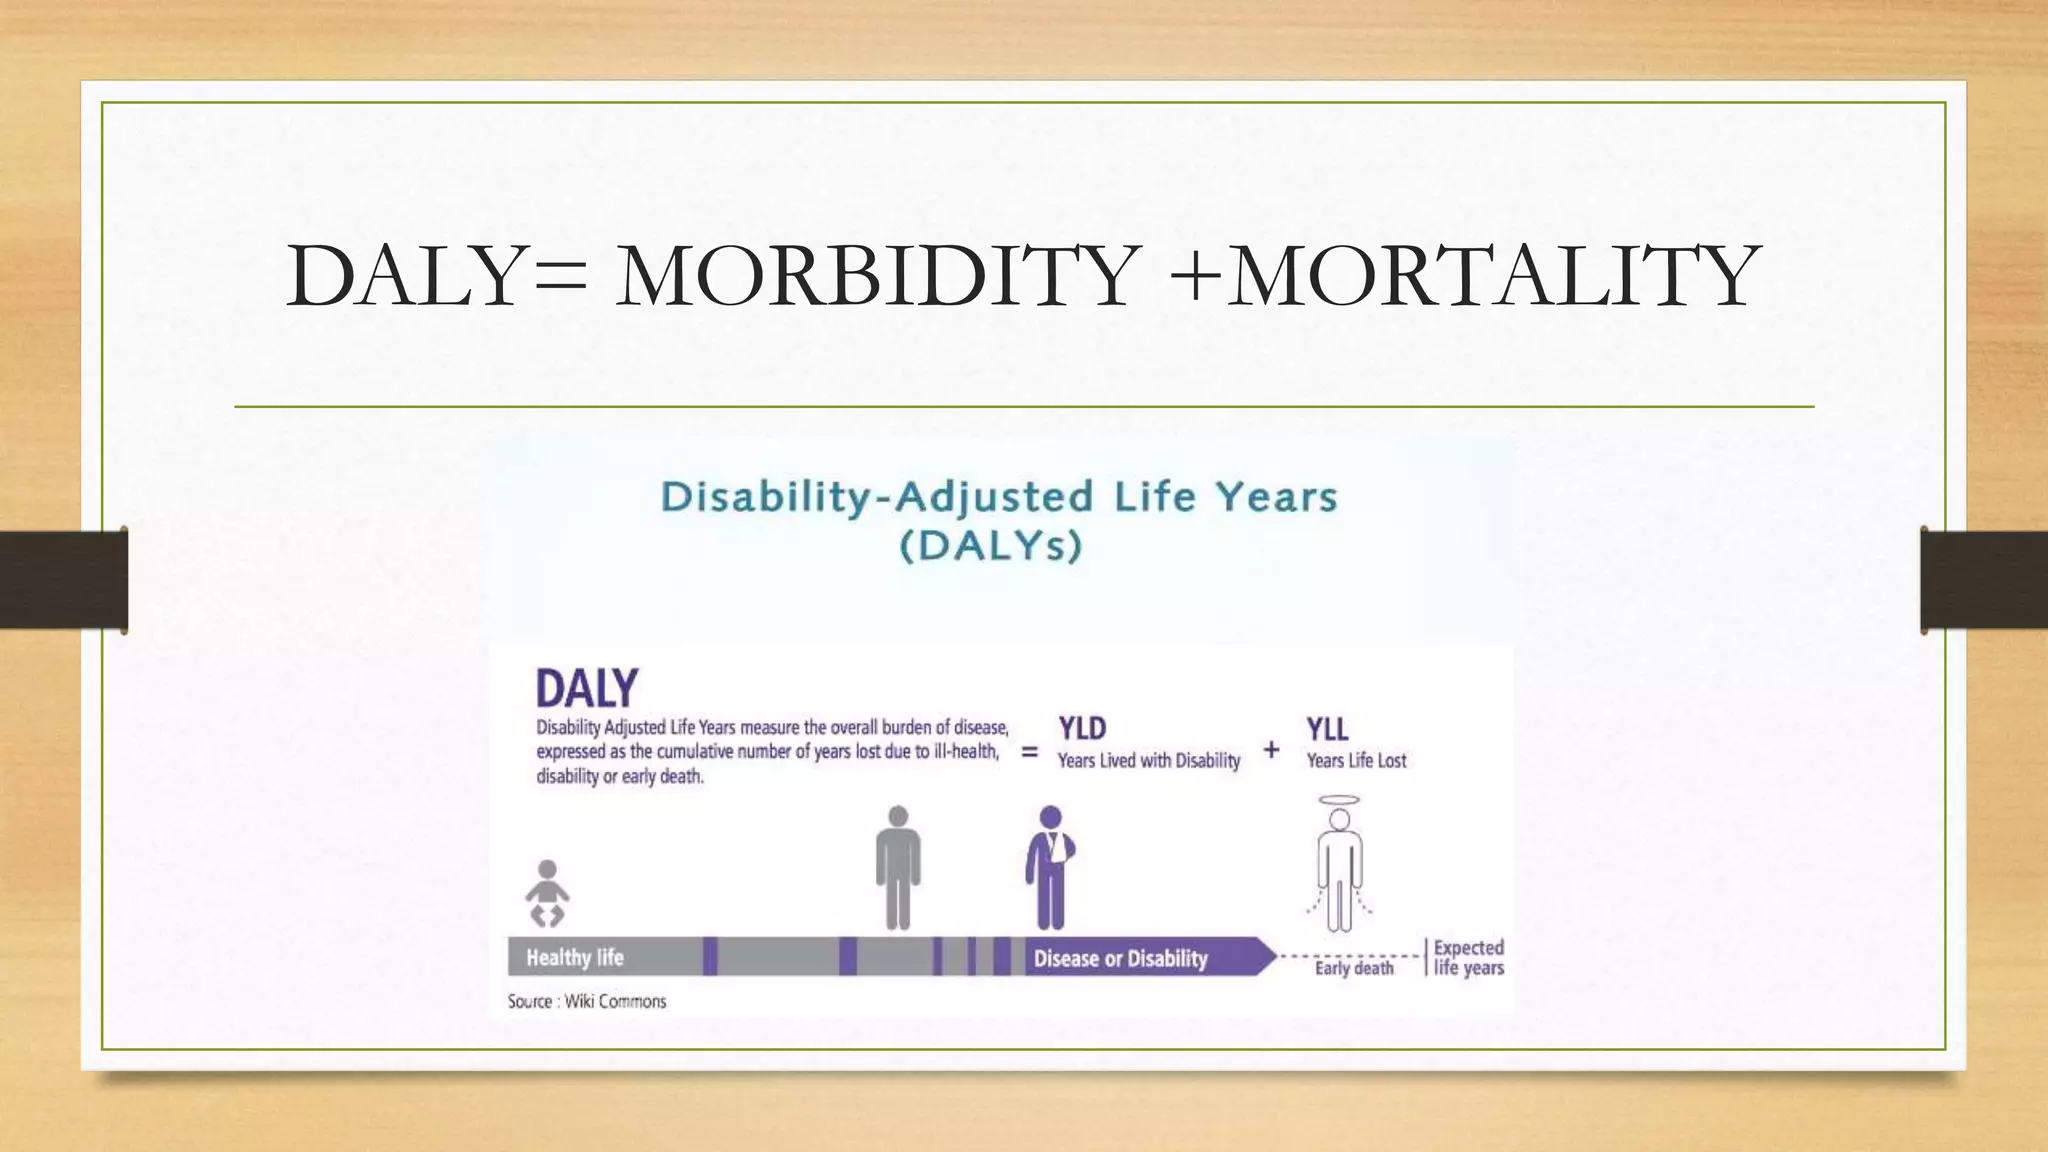
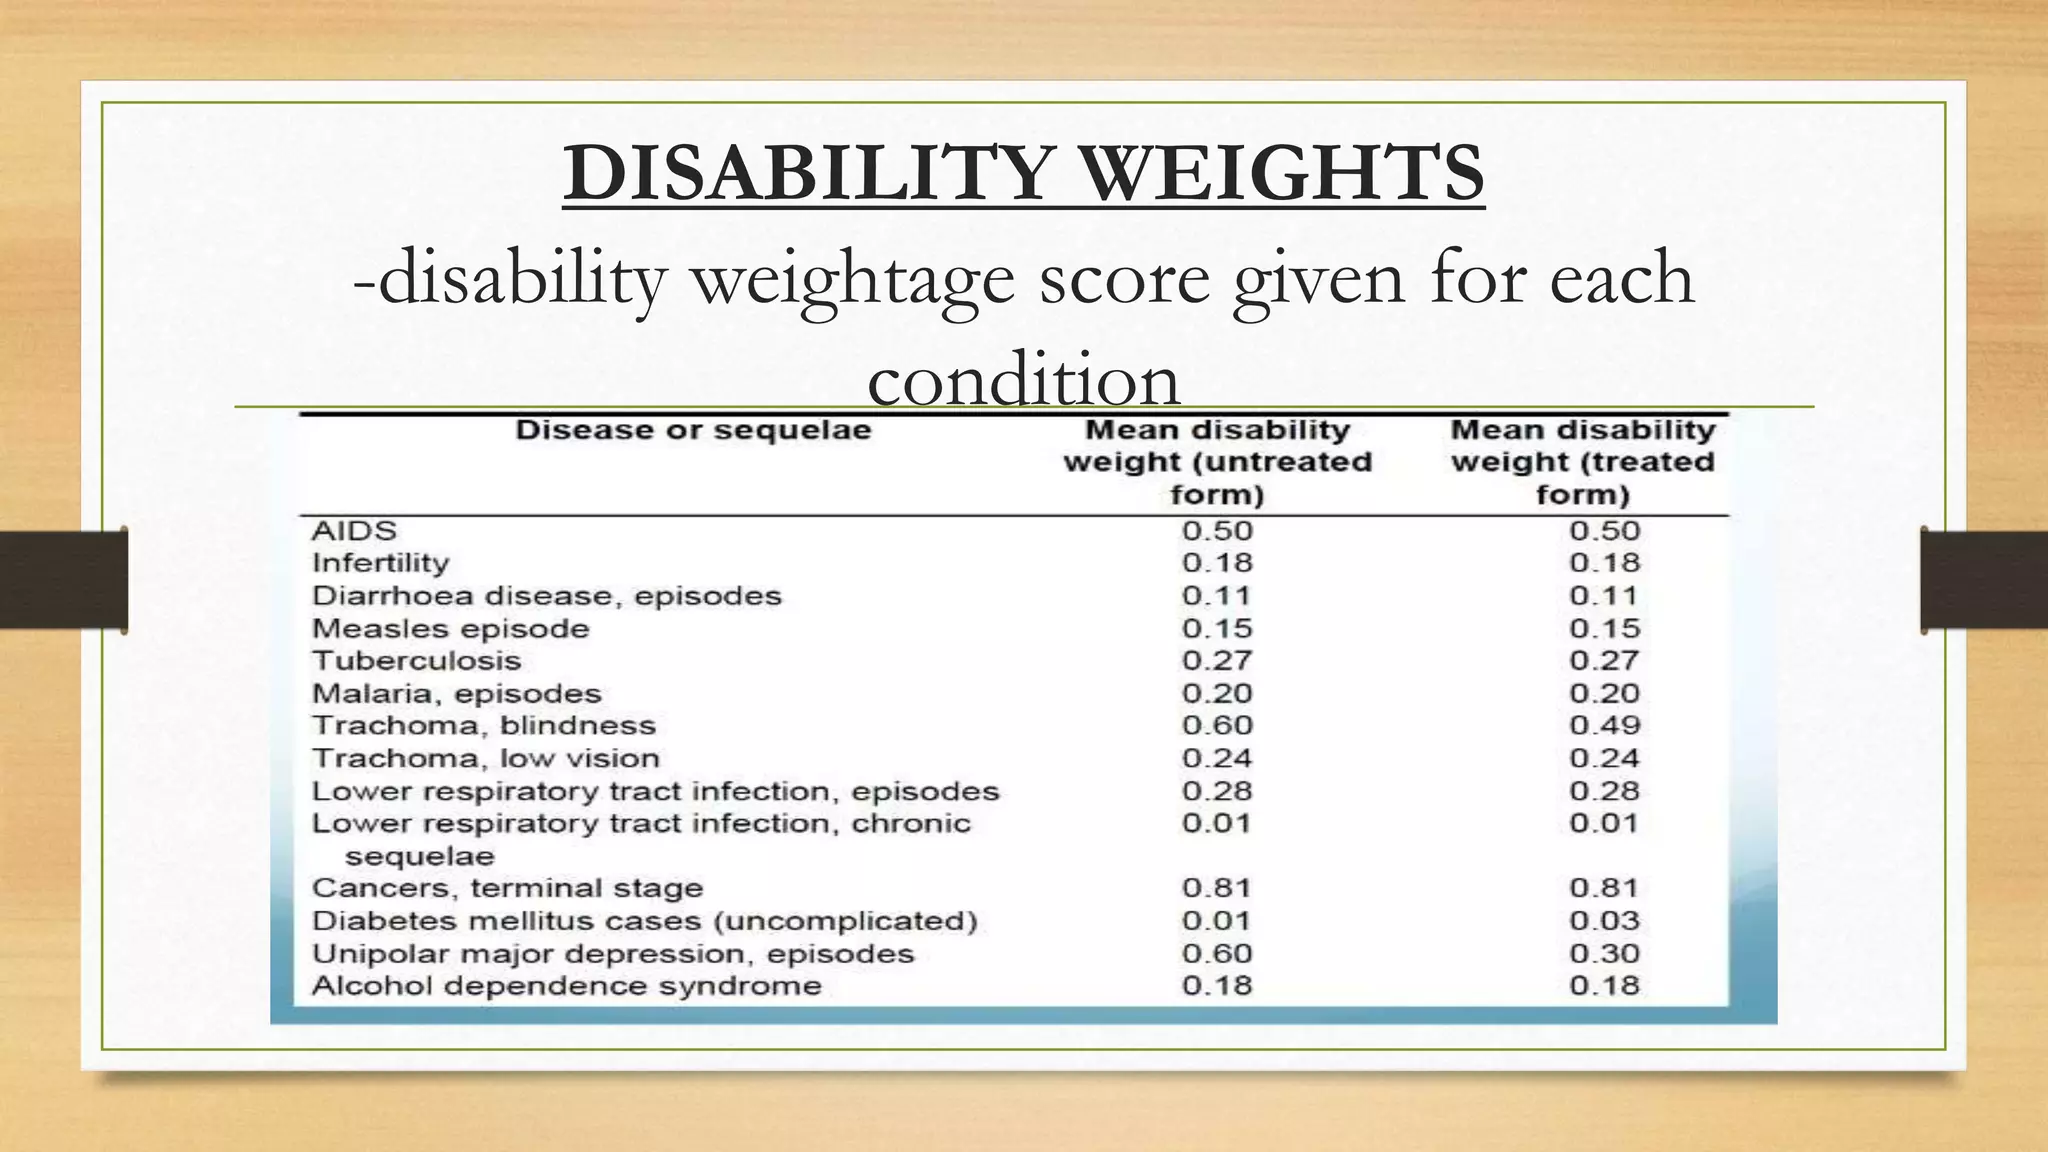
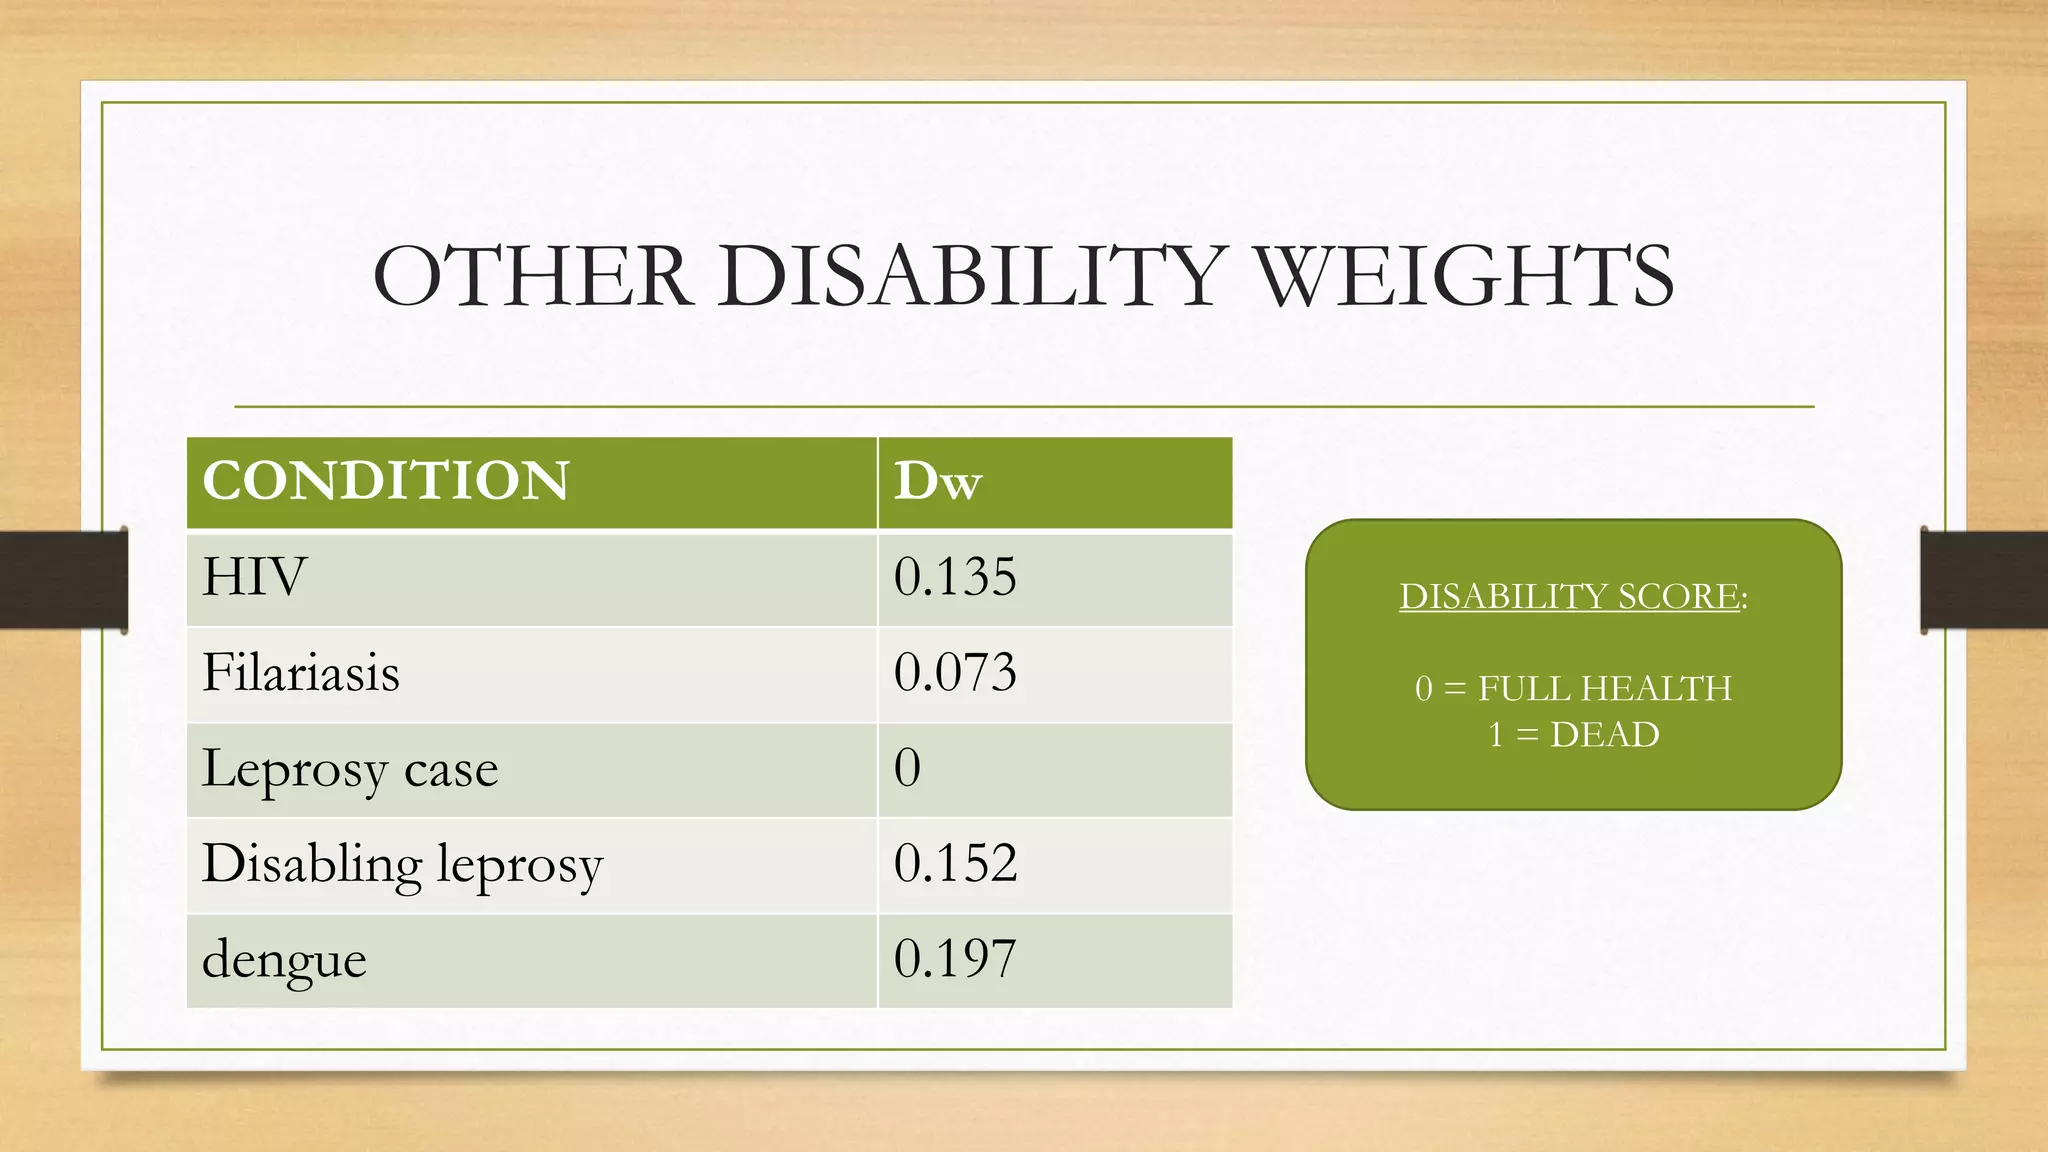
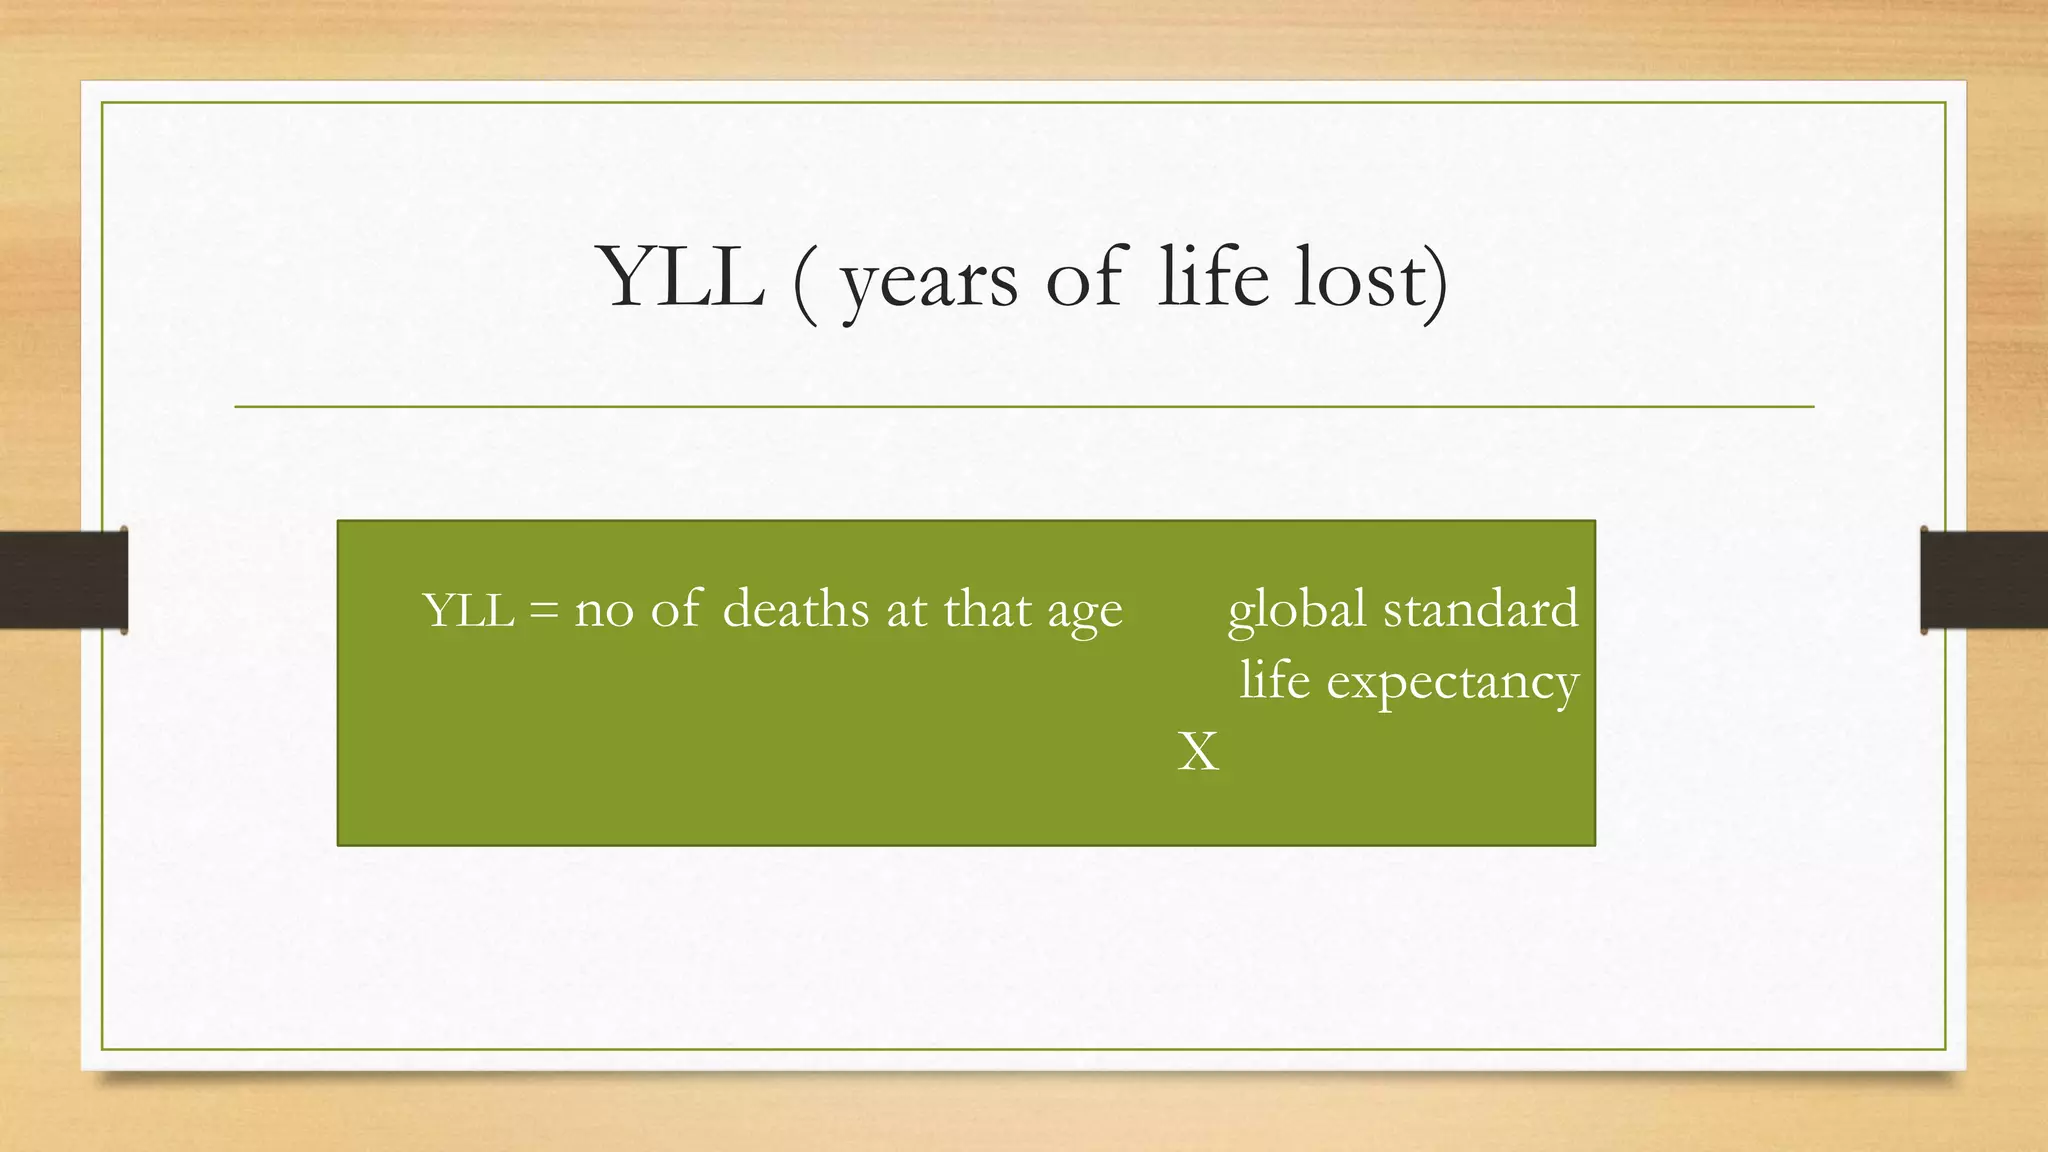
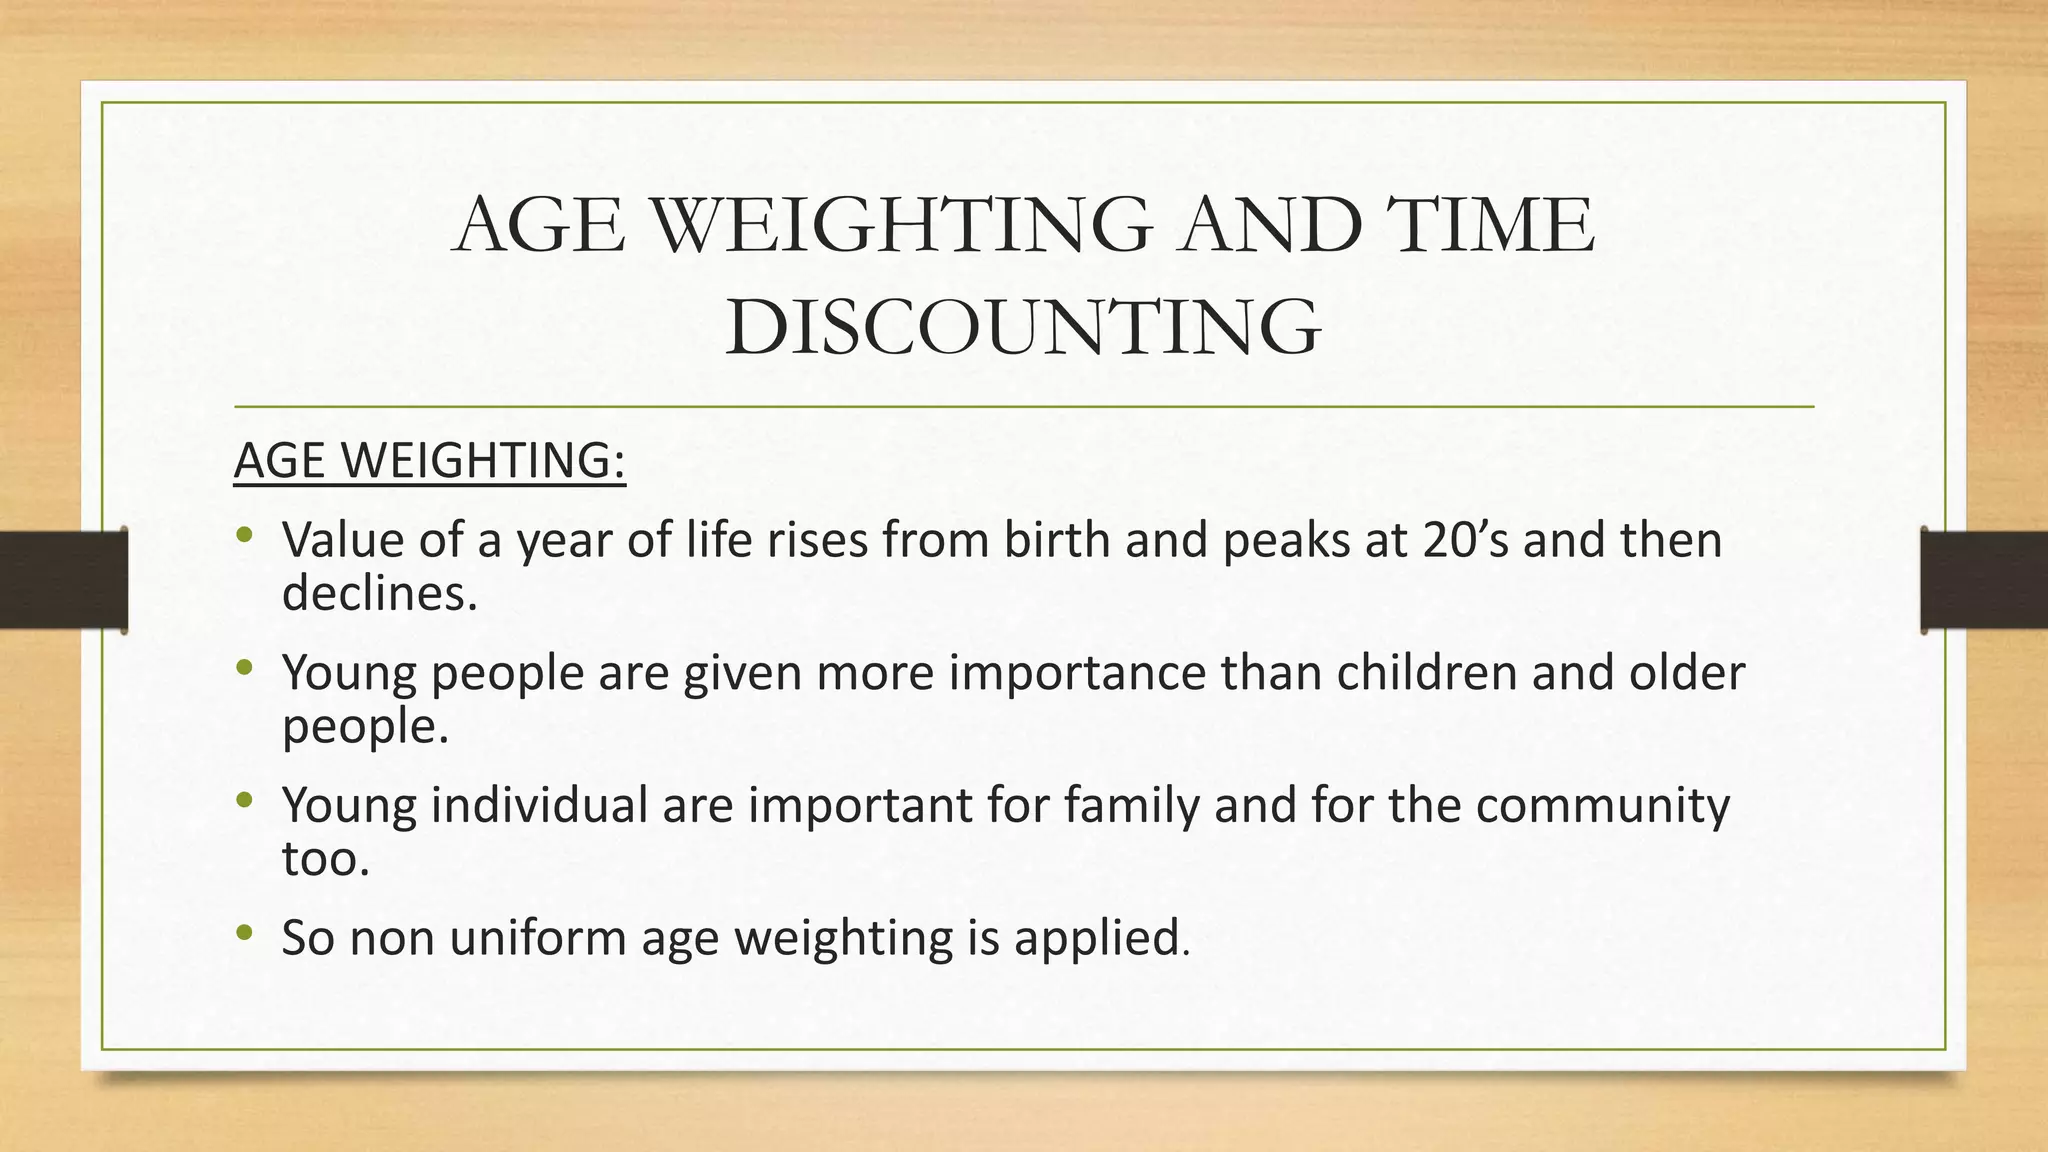
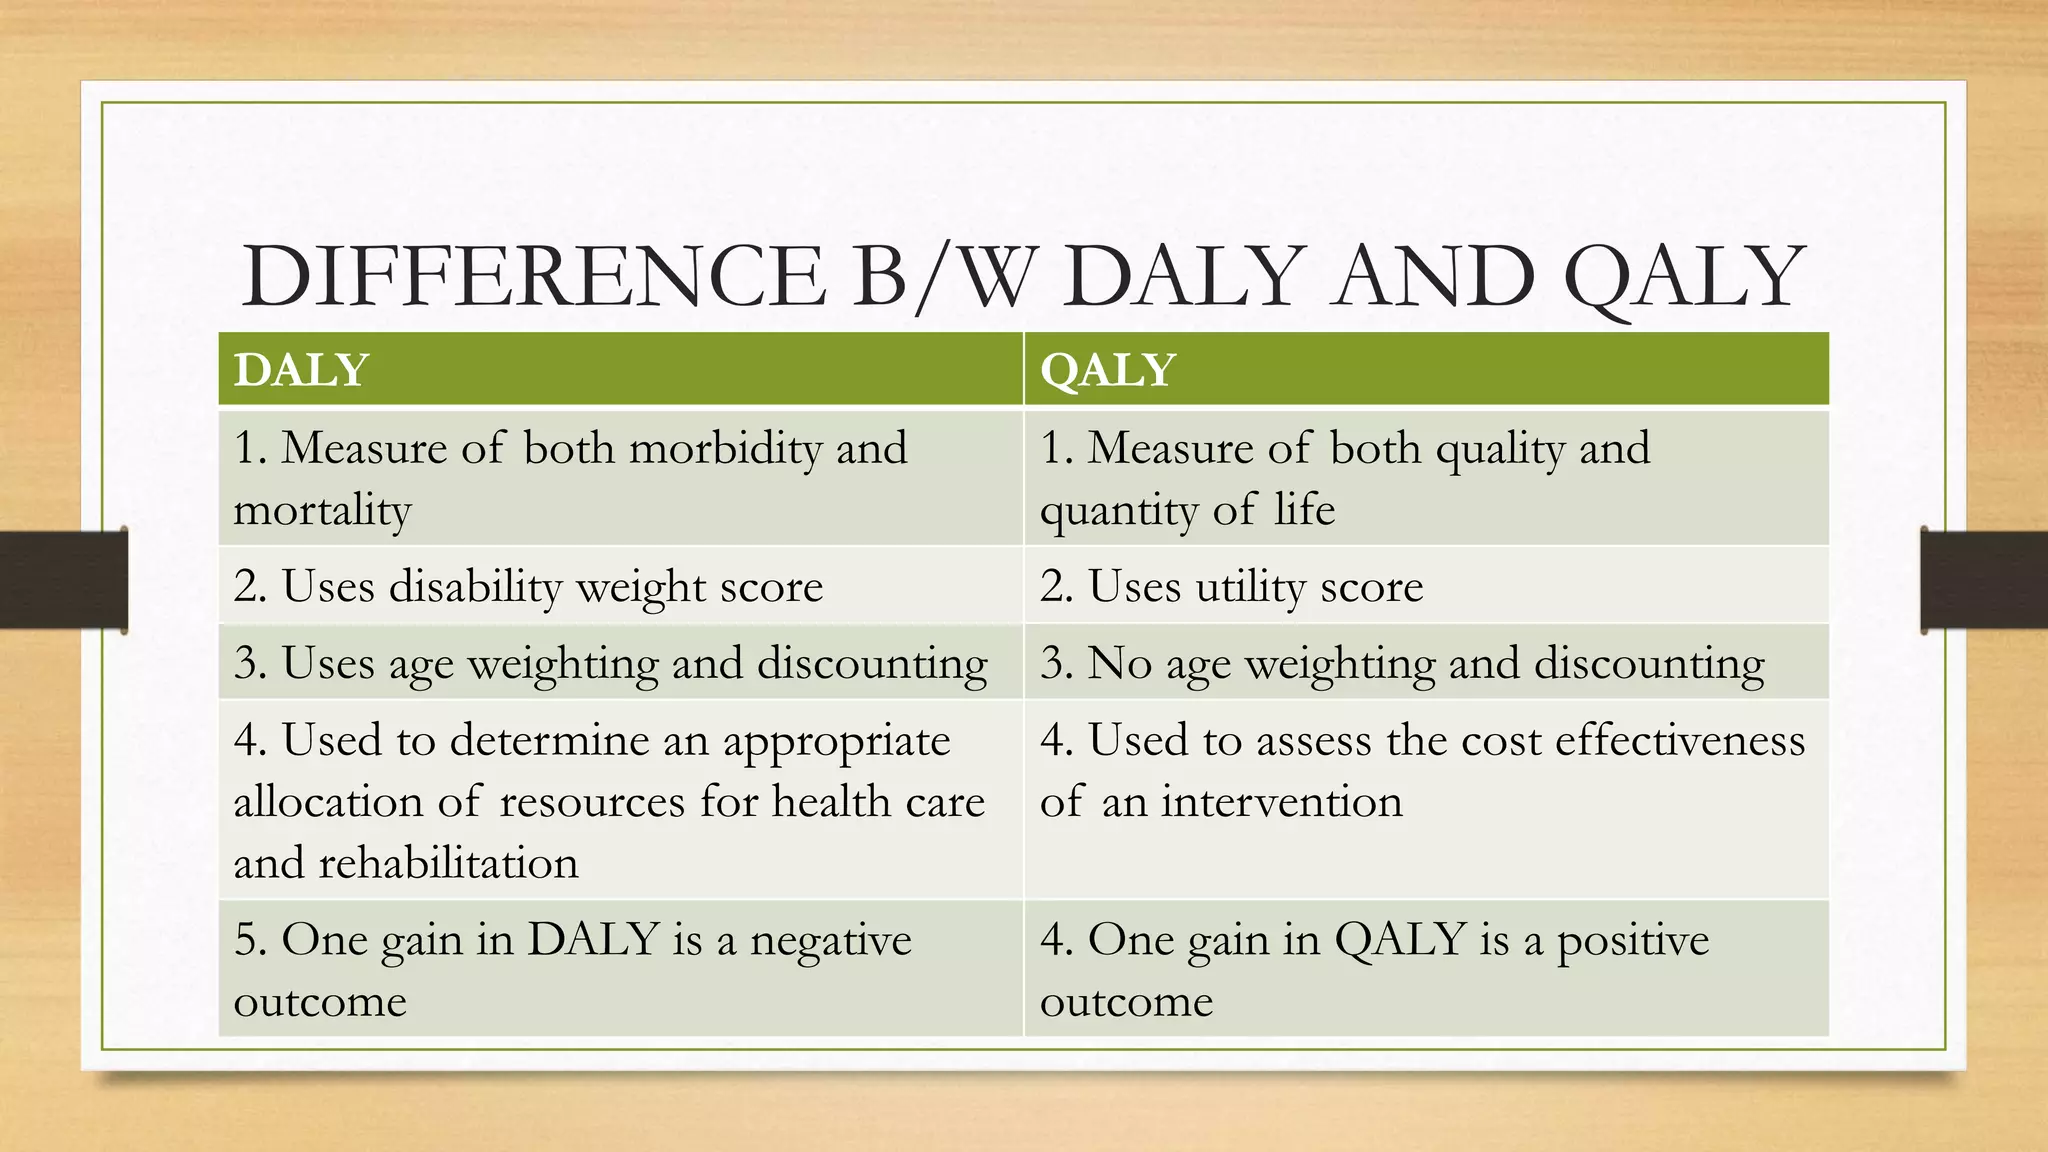
4. INTRODUCTION & TYPES
DISABILTY: An impairment/ limitation/ restriction
experienced by a person in executing a task or action.
TYPES:
1. Sullivan index
2. DALY
3. QALY
4. HALE
5. GLOBAL BURDEN OF DISEASE
• Comprehensive worldwide observational epidemiological
study.
• Describes mortality and morbidity from major diseases,
injuries and risk factors to health at global, national and
regional levels.
• First GBD study was started in 1990, quantified health effects
for more than 100 diseases and injuries for eight regions of the
world.
6. GLOBAL BURDEN OF DISEASE
• Standardized measure to estimate the GBD is DALY.
• Epidemiological survey, health survey and health facility data
are the various sources for assessing the global burden of
disease.
• GBD varies according to disease.
• Eg: polio: has high GBD because of increased surveillance data
compared to others.
7. CURRENT TRENDS IN GBD-2017
1. Trends in cause of death
2. Trends in cause of disability
3. Trends in cause of early death and disability
4. Trends in leading risk factors for early death and disability
8. 1.TRENDS IN CAUSE OF DEATH
1. Decrease in under 5 mortality
2. Females live longer than males
3. Increase in proportion of death in those over 75years by
39%
9.
10. 2.TRENDS IN CAUSE OF DISABILITY
-disability has accounted for increase in global burden by 52%
11. 3.TRENDS IN CAUSE OF EARLY DEATH
AND DISABILITY
1. 41% decrease in deaths due to
communicable disease and
neonatal disease
2. 40% increase in deaths due to
non communicable disease .
LOW SDI COUNTRIES HIGH SDI
COUNTRIES
1.Neonatal disorders 1.Ischemic heart disease
2.LRI 2. Low back pain
3.Diarrhoea 3.Stroke
4.Malaria 4.Lung cancer
5.Congenital disease 5.COPD
12. 4.TRENDS IN LEADING RISK FACTORS
FOR EARLY DEATH AND DISABIITY
MALES FEMALES
1. Smoking 1. Increased SBP
2. Increased SBP 2. Increased FBS
3. Increased FBS 3. Increased BMI
4. Alcohol 4. Short gestation for birth
weight
5. Short gestation for birth
weight
5. LBW for gestation
13. MEASURES OF POPULATION HEALTH
-to reflect the impact of morbidity or disability
Health expectancy
• DFLE( disability free life expectancy)
• HALE (health adjusted life expectancy)
Health gap
• HLY( Healthy life years)
• DALY ( disability adjusted life years)
15. LIFE EXPECTANCY
• Average number of years an individual is expected to live from
birth.
• As of 2019 , Indians have a life expectancy of 69years. (#165)
WORLD RANKING AND LE -2019
COUNTRY RANK LE
Monaco 1 89.32
Japan 2 85.77
Singapore 3 85.73
16. HEALTHY LIFE EXPECTANCY
• Average number of years an individual is expected to live in
GOOD HEALTH from birth by taking into account years lived
in less than full health due to disease or injury.
• According to WHO 2016, HLE at birth for SEAR countries =
60.4 and globally = 63.3 years
HLE = LE – YEARS LIVED IN DISABILITY
17. 1. HEALTH EXPECTANCY MEASURE
(i) DALE/HALE:
• Earlier the term disability adjusted life expectancy was used an now it has
been replaced by HALE ( health adjusted life expectancy)
• HALE is based on life expectancy at birth with inclusion to life spent in poor
health.
• Similar to HLE.
• LE, HLE, HALE are not applied to individuals.
• They are applied to a specified group of population in a defined period of
time.
18. (ii) DFLE( disability free life expectancy)
• Average number of years an individual is expected to live free
of disability if current pattern of mortality and disability
continue to apply.
• According to recent research, highest DFLE is noted in MEXICO
( male=15.4years and female=16.5yrs)
• India has the lowest DFLE ( male=11.5yrs and female=11.7yrs)
19. 2. Health gaps measure:
(i) DALY(Disability adjusted life years)
• Developed by WHO in collaboration with World bank.
• Quantitative estimate of burden of disease and disability
across populations in different nations.
• Disability plays a major role in determining the overall health
status of a population.
• Used to quantify both burden of fatal and non fatal outcomes
under one measure.
• Unit: Time
21. YLD( YEARS LOST TO DISABILITY)
Based on incidence:
Based on prevalence:
YLD = no of incident cases at each average duration disability
age (Dx) x of a condition x weight
YLD = PREVALENCE X DISABILITY WEIGHT
22. YLD can also be calculated based on;
Eg:
For oncocerchiasis,
YLD = average no of cases (or) adding the YLD for the sequelae of low
vision, blindness and itchy dermatitis.
the average number of incident cases of a given disease
(or)
one / more disabling sequelae of the disease.
24. OTHER DISABILITY WEIGHTS
CONDITION Dw
HIV 0.135
Filariasis 0.073
Leprosy case 0
Disabling leprosy 0.152
dengue 0.197
DISABILITY SCORE:
0 = FULL HEALTH
1 = DEAD
25. YLL ( years of life lost)
YLL = no of deaths at that age global standard
life expectancy
X
26. AGE WEIGHTING AND TIME
DISCOUNTING
AGE WEIGHTING:
• Value of a year of life rises from birth and peaks at 20’s and then
declines.
• Young people are given more importance than children and older
people.
• Young individual are important for family and for the community
too.
• So non uniform age weighting is applied.
27. DISCOUNTING
• We discount future benefits over present health.
• Social preference of healthy years now than future
• DALY can be calculated with or without discounting
• Usually 3% discounting is used.
• Discounting future health reduces the value of interventions
that provide future benefit.
• Eg: hep b vaccine -> reduces the incidence of liver cancer.
28. DALY
ONE DALY = ONE LOST YEAR OF HEALTHY LIFE
TOTAL DALYS = MEASURE OF THE GAP B/W CURRENT HEALTH OF A
POPULATION AND IDEAL SITUATION WHEN A PERSON GETS OLD IN FULL
HEALTH.
29. QALY ( quality adjusted life years)
• Measure of disease burden which includes both QUALITY and
QUANTITY of life lived.
• QUALITY of life is based on UTILITY SCORE, which is the reverse of
disability score.
• One full year lived with healthy life = 1 QALY
• Half year lived with healthy life = 0.5 QALY
30. USES OF QALY
• It is used to assess the value for money of an intervention.
(cost effectiveness)
• GOLD STANDARD for measuring how well a medical treatement
improves and lengthens patient’s lives.
• Also based on the no of years added because of an
intervention.
32. DIFFERENCE B/W DALY AND QALY
DALY QALY
1. Measure of both morbidity and
mortality
1. Measure of both quality and
quantity of life
2. Uses disability weight score 2. Uses utility score
3. Uses age weighting and discounting 3. No age weighting and discounting
4. Used to determine an appropriate
allocation of resources for health care
and rehabilitation
4. Used to assess the cost effectiveness
of an intervention
5. One gain in DALY is a negative
outcome
4. One gain in QALY is a positive
outcome
33. SUMMARY
• LE is no of years a person is expected to live including good and
bad health.
• HLE is no of years a person is expected to live only in good
health.
• Similar terms : HLE, DALE/HALE, DFLE
• DALY quantifies the burden of a disease
.
34. SUMMARY
• QALY quantifies health.
• All above discussed indicators are used for whole specified
population in a defined time and not for individuals
• DALY : 0 = healthy / 1 = DEAD
• QALY: 0 = dead / 1 = Healthy
• Sullivan index: expectation of life free of disability
• Sullivan index : LE of country – propable duration of disability
• Most advanced indicator