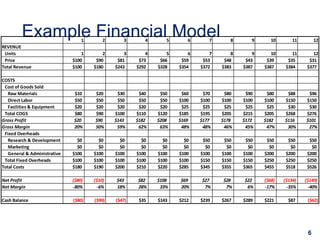
SlideShare a Scribd company logo
Financial Modeling
2013-07-10
Bryan Guido Hassin
Entrepreneur In Residence
Two Areas of the Business Model
Canvas require more detail
• The Business Model Canvas is a great
high-level tool
• But revenues and costs require more
detailed work to ensure your business is
sustainable
• These two areas comprise the Financial
Model (simplified)
2
3
images by JAM
customer
segments
key
partners
cost
structure
revenue
streams
channels
customer
relationships
key activities
key
resources
value
proposition
Courtesy of Steve Blank
R – C = P
REVENUES – COSTS = PROFIT
UNITS X PRICE MATERIALS
LABOR
FACILITIES
A basic Financial Model focuses
on your venture’s income
Your
Goal:
Source: John Pimentel
4
The best Financial Models are
built from the bottom up
Top Down
• “If we capture x%
of the market, we
can make y profit”
Bottom Up
• “If we employ x
sales people,
paying them y and
expecting z1 sales
per person in
month 1, z2 sales
in month 2, … etc”
• This is a wish
• But is useful for
reality checking
Source: John Pimentel
5
Example Financial Model1 2 3 4 5 6 7 8 9 10 11 12
REVENUE
Units 1 2 3 4 5 6 7 8 9 10 11 12
Price $100 $90 $81 $73 $66 $59 $53 $48 $43 $39 $35 $31
Total Revenue $100 $180 $243 $292 $328 $354 $372 $383 $387 $387 $384 $377
COSTS
Cost of Goods Sold
Raw Materials $10 $20 $30 $40 $50 $60 $70 $80 $90 $80 $88 $96
Direct Labor $50 $50 $50 $50 $50 $100 $100 $100 $100 $100 $150 $150
Facilities & Equipment $20 $20 $20 $20 $20 $25 $25 $25 $25 $25 $30 $30
Total COGS $80 $90 $100 $110 $120 $185 $195 $205 $215 $205 $268 $276
Gross Profit $20 $90 $143 $182 $208 $169 $177 $178 $172 $182 $116 $101
Gross Margin 20% 50% 59% 62% 63% 48% 48% 46% 45% 47% 30% 27%
Fixed Overheads
Research & Development $0 $0 $0 $0 $0 $0 $50 $50 $50 $50 $50 $50
Marketing $0 $0 $0 $0 $0 $0 $0 $0 $0 $0 $0 $0
General & Administrative $100 $100 $100 $100 $100 $100 $100 $100 $100 $200 $200 $200
Total Fixed Overheads $100 $100 $100 $100 $100 $100 $150 $150 $150 $250 $250 $250
Total Costs $180 $190 $200 $210 $220 $285 $345 $355 $365 $455 $518 $526
Net Profit ($80) ($10) $43 $82 $108 $69 $27 $28 $22 ($68) ($134) ($149)
Net Margin -80% -6% 18% 28% 33% 20% 7% 7% 6% -17% -35% -40%
Cash Balance ($80) ($90) ($47) $35 $143 $212 $239 $267 $289 $221 $87 ($62)
6
1 2 3 4 5 6 7 8 9 10 11 12
REVENUE
Units 1 2 3 4 5 6 7 8 9 10 11 12
Price $100 $90 $81 $73 $66 $59 $53 $48 $43 $39 $35 $31
Total Revenue $100 $180 $243 $292 $328 $354 $372 $383 $387 $387 $384 $377
COSTS
Cost of Goods Sold
Raw Materials $10 $20 $30 $40 $50 $60 $70 $80 $90 $80 $88 $96
Direct Labor $50 $50 $50 $50 $50 $100 $100 $100 $100 $100 $150 $150
Facilities & Equipment $20 $20 $20 $20 $20 $25 $25 $25 $25 $25 $30 $30
Total COGS $80 $90 $100 $110 $120 $185 $195 $205 $215 $205 $268 $276
Gross Profit $20 $90 $143 $182 $208 $169 $177 $178 $172 $182 $116 $101
Gross Margin 20% 50% 59% 62% 63% 48% 48% 46% 45% 47% 30% 27%
Fixed Overheads
Research & Development $0 $0 $0 $0 $0 $0 $50 $50 $50 $50 $50 $50
Marketing $0 $0 $0 $0 $0 $0 $0 $0 $0 $0 $0 $0
General & Administrative $100 $100 $100 $100 $100 $100 $100 $100 $100 $200 $200 $200
Total Fixed Overheads $100 $100 $100 $100 $100 $100 $150 $150 $150 $250 $250 $250
Total Costs $180 $190 $200 $210 $220 $285 $345 $355 $365 $455 $518 $526
Net Profit ($80) ($10) $43 $82 $108 $69 $27 $28 $22 ($68) ($134) ($149)
Net Margin -80% -6% 18% 28% 33% 20% 7% 7% 6% -17% -35% -40%
Cash Balance ($80) ($90) ($47) $35 $143 $212 $239 $267 $289 $221 $87 ($62)
How much investment capital is
needed?
7
1 2 3 4 5 6 7 8 9 10 11 12
REVENUE
Units 1 2 3 4 5 6 7 8 9 10 11 12
Price $100 $90 $81 $73 $66 $59 $53 $48 $43 $39 $35 $31
Total Revenue $100 $180 $243 $292 $328 $354 $372 $383 $387 $387 $384 $377
COSTS
Cost of Goods Sold
Raw Materials $10 $20 $30 $40 $50 $60 $70 $80 $90 $80 $88 $96
Direct Labor $50 $50 $50 $50 $50 $100 $100 $100 $100 $100 $150 $150
Facilities & Equipment $20 $20 $20 $20 $20 $25 $25 $25 $25 $25 $30 $30
Total COGS $80 $90 $100 $110 $120 $185 $195 $205 $215 $205 $268 $276
Gross Profit $20 $90 $143 $182 $208 $169 $177 $178 $172 $182 $116 $101
Gross Margin 20% 50% 59% 62% 63% 48% 48% 46% 45% 47% 30% 27%
Fixed Overheads
Research & Development $0 $0 $0 $0 $0 $0 $50 $50 $50 $50 $50 $50
Marketing $0 $0 $0 $0 $0 $0 $0 $0 $0 $0 $0 $0
General & Administrative $100 $100 $100 $100 $100 $100 $100 $100 $100 $200 $200 $200
Total Fixed Overheads $100 $100 $100 $100 $100 $100 $150 $150 $150 $250 $250 $250
Total Costs $180 $190 $200 $210 $220 $285 $345 $355 $365 $455 $518 $526
Net Profit ($80) ($10) $43 $82 $108 $69 $27 $28 $22 ($68) ($134) ($149)
Net Margin -80% -6% 18% 28% 33% 20% 7% 7% 6% -17% -35% -40%
Cash Balance ($80) ($90) ($47) $35 $143 $212 $239 $267 $289 $221 $87 ($62)
What’s wrong with this model?
Profit peaks in month 5 => not scalable!
8
Use sensitivity analysis to identify
key financial model drivers
• Prices ↑ or ↓ (10%? 20%?)
• Unit volume ↑ or ↓ (10%? 20%?)
– Consider Marketing options
• COGS ↑ or ↓
– Consider alternative suppliers
• Fixed Overheads ↑ or ↓
– Delay hiring, buy used equipment
9
1 2 3 4 5 6 7 8 9 10 11 12
REVENUE
Units 1 2 3 4 5 6 7 8 9 10 11 12
Price $100 $90 $81 $73 $66 $59 $53 $48 $43 $39 $35 $31
Total Revenue $100 $180 $243 $292 $328 $354 $372 $383 $387 $387 $384 $377
COSTS
Cost of Goods Sold
Raw Materials $10 $20 $30 $40 $50 $60 $70 $80 $90 $80 $88 $96
Direct Labor $50 $50 $50 $50 $50 $100 $100 $100 $100 $100 $150 $150
Facilities & Equipment $20 $20 $20 $20 $20 $25 $25 $25 $25 $25 $30 $30
Total COGS $80 $90 $100 $110 $120 $185 $195 $205 $215 $205 $268 $276
Gross Profit $20 $90 $143 $182 $208 $169 $177 $178 $172 $182 $116 $101
Gross Margin 20% 50% 59% 62% 63% 48% 48% 46% 45% 47% 30% 27%
Fixed Overheads
Research & Development $0 $0 $0 $0 $0 $0 $50 $50 $50 $50 $50 $50
Marketing $0 $0 $0 $0 $0 $0 $0 $0 $0 $0 $0 $0
General & Administrative $100 $100 $100 $100 $100 $100 $100 $100 $100 $200 $200 $200
Total Fixed Overheads $100 $100 $100 $100 $100 $100 $150 $150 $150 $250 $250 $250
Total Costs $180 $190 $200 $210 $220 $285 $345 $355 $365 $455 $518 $526
Net Profit ($80) ($10) $43 $82 $108 $69 $27 $28 $22 ($68) ($134) ($149)
Net Margin -80% -6% 18% 28% 33% 20% 7% 7% 6% -17% -35% -40%
Cash Balance ($80) ($90) ($47) $35 $143 $212 $239 $267 $289 $221 $87 ($62)
Why does profit fall off?
Two cost lines are out of control and pricing doesn’t scale
10
1 2 3 4 5 6 7 8 9 10 11 12
REVENUE
Units 1 2 3 4 5 6 7 8 9 10 11 12
Price $100 $90 $81 $73 $66 $59 $53 $48 $43 $39 $35 $31
Total Revenue $100 $180 $243 $292 $328 $354 $372 $383 $387 $387 $384 $377
COSTS
Cost of Goods Sold
Raw Materials $10 $20 $30 $40 $50 $60 $70 $80 $90 $80 $88 $96
Direct Labor $50 $50 $50 $50 $50 $100 $100 $100 $100 $100 $150 $150
Facilities & Equipment $20 $20 $20 $20 $20 $25 $25 $25 $25 $25 $30 $30
Total COGS $80 $90 $100 $110 $120 $185 $195 $205 $215 $205 $268 $276
Gross Profit $20 $90 $143 $182 $208 $169 $177 $178 $172 $182 $116 $101
Gross Margin 20% 50% 59% 62% 63% 48% 48% 46% 45% 47% 30% 27%
Fixed Overheads
Research & Development $0 $0 $0 $0 $0 $0 $50 $50 $50 $50 $50 $50
Marketing $0 $0 $0 $0 $0 $0 $0 $0 $0 $0 $0 $0
General & Administrative $100 $100 $100 $100 $100 $100 $100 $100 $100 $200 $200 $200
Total Fixed Overheads $100 $100 $100 $100 $100 $100 $150 $150 $150 $250 $250 $250
Total Costs $180 $190 $200 $210 $220 $285 $345 $355 $365 $455 $518 $526
Net Profit ($80) ($10) $43 $82 $108 $69 $27 $28 $22 ($68) ($134) ($149)
Net Margin -80% -6% 18% 28% 33% 20% 7% 7% 6% -17% -35% -40%
Cash Balance ($80) ($90) ($47) $35 $143 $212 $239 $267 $289 $221 $87 ($62)
How should we address the profit
fall-off?
A marketing investment should buoy price, increase sales
11
Now this is an investable model!1 2 3 4 5 6 7 8 9 10 11 12
REVENUE
Units 1 3 5 7 9 11 13 15 17 19 21 23
Price $100 $95 $90 $86 $81 $77 $74 $70 $66 $63 $60 $57
Total Revenue $100 $285 $451 $600 $733 $851 $956 $1,048 $1,128 $1,197 $1,257 $1,308
COSTS
Cost of Goods Sold
Raw Materials $10 $30 $50 $70 $90 $110 $130 $150 $170 $152 $168 $184
Direct Labor $50 $50 $50 $50 $50 $100 $100 $100 $100 $100 $150 $150
Facilities & Equipment $20 $20 $20 $20 $20 $25 $25 $25 $25 $25 $30 $30
Total COGS $80 $100 $120 $140 $160 $235 $255 $275 $295 $277 $348 $364
Gross Profit $20 $185 $331 $460 $573 $616 $701 $773 $833 $920 $909 $944
Gross Margin 20% 65% 73% 77% 78% 72% 73% 74% 74% 77% 72% 72%
Fixed Overheads
Research & Development $0 $0 $0 $0 $0 $0 $50 $50 $50 $50 $50 $50
Marketing $10 $11 $12 $13 $15 $16 $18 $19 $21 $24 $26 $29
General & Administrative $100 $100 $100 $100 $100 $100 $100 $100 $100 $200 $200 $200
Total Fixed Overheads $110 $111 $112 $113 $115 $116 $168 $169 $171 $274 $276 $279
Total Costs $190 $211 $232 $253 $275 $351 $423 $444 $466 $551 $624 $643
Net Profit ($90) $74 $219 $347 $458 $500 $533 $603 $661 $647 $633 $666
Net Margin -90% 26% 49% 58% 63% 59% 56% 58% 59% 54% 50% 51%
Cash Balance ($90) ($16) $203 $550 $1,008 $1,508 $2,041 $2,644 $3,306 $3,953 $4,586 $5,252
12
1 2 3 4 5 6 7 8 9 10 11 12
REVENUE
Units 1 3 5 7 9 11 13 15 17 19 21 23
Price $100 $95 $90 $86 $81 $77 $74 $70 $66 $63 $60 $57
Total Revenue $100 $285 $451 $600 $733 $851 $956 $1,048 $1,128 $1,197 $1,257 $1,308
COSTS
Cost of Goods Sold
Raw Materials $10 $30 $50 $70 $90 $110 $130 $150 $170 $152 $168 $184
Direct Labor $50 $50 $50 $50 $50 $100 $100 $100 $100 $100 $150 $150
Facilities & Equipment $20 $20 $20 $20 $20 $25 $25 $25 $25 $25 $30 $30
Total COGS $80 $100 $120 $140 $160 $235 $255 $275 $295 $277 $348 $364
Gross Profit $20 $185 $331 $460 $573 $616 $701 $773 $833 $920 $909 $944
Gross Margin 20% 65% 73% 77% 78% 72% 73% 74% 74% 77% 72% 72%
Fixed Overheads
Research & Development $0 $0 $0 $0 $0 $0 $50 $50 $50 $50 $50 $50
Marketing $10 $11 $12 $13 $15 $16 $18 $19 $21 $24 $26 $29
General & Administrative $100 $100 $100 $100 $100 $100 $100 $100 $100 $200 $200 $200
Total Fixed Overheads $110 $111 $112 $113 $115 $116 $168 $169 $171 $274 $276 $279
Total Costs $190 $211 $232 $253 $275 $351 $423 $444 $466 $551 $624 $643
Net Profit ($90) $74 $219 $347 $458 $500 $533 $603 $661 $647 $633 $666
Net Margin -90% 26% 49% 58% 63% 59% 56% 58% 59% 54% 50% 51%
Cash Balance ($90) ($16) $203 $550 $1,008 $1,508 $2,041 $2,644 $3,306 $3,953 $4,586 $5,252
How much investment capital is
needed?
13
Investors look for key metrics in a
financial model
• Cash Burn or Burn Rate
• Revenues less costs
• Know on monthly or quarterly basis
• Runway
• # of months operating at a loss before all cash
is gone
• Cash Flow Break Even
• Point at which cash from revenues = or >
Cash Burn
• Cap Ex
• Cash required to build the product, facility,
PP&E
Source: John Pimentel
14
Modeling the costs of hiring is
more art than science
• A good estimate is $100,000 (fully
burdened, including healthcare, payroll
tax, etc.) per employee
15
Discussion
• Generate a rough financial model for
your venture
• Use sensitivity analysis to identify your
key financial drivers
16
Financial Modeling
2013-07-10
Bryan Guido Hassin
Entrepreneur In Residence

More Related Content

What's hot

CEO Dashboard Template in Excel
CEO Dashboard Template in ExcelCEO Dashboard Template in Excel
CEO Dashboard Template in Excel
Akram Hossain Siblee CPA, CA(UK)
 
CFO Dashboard Template in Excel
CFO Dashboard Template in ExcelCFO Dashboard Template in Excel
CFO Dashboard Template in Excel
Akram Hossain Siblee CPA, CA(UK)
 
Finance Dashboard Template in Excel
Finance Dashboard Template in ExcelFinance Dashboard Template in Excel
Finance Dashboard Template in Excel
Akram Hossain Siblee CPA, CA(UK)
 
Finance Budgeting Powerpoint Presentation Slides
Finance Budgeting Powerpoint Presentation SlidesFinance Budgeting Powerpoint Presentation Slides
Finance Budgeting Powerpoint Presentation Slides
SlideTeam
 
Financial Forecasting
Financial ForecastingFinancial Forecasting
Financial Forecasting
JamariHodges1
 
FIN 667 Hershey Valuation PPT- Final
FIN 667 Hershey Valuation PPT- FinalFIN 667 Hershey Valuation PPT- Final
FIN 667 Hershey Valuation PPT- FinalLisa Lee
 
Financial forecast
Financial forecastFinancial forecast
Financial forecast
MalenaApplewhite
 
KPI Dashboard Template in Excel
KPI Dashboard Template in ExcelKPI Dashboard Template in Excel
KPI Dashboard Template in Excel
Akram Hossain Siblee CPA, CA(UK)
 
Brunswick (BC) Pitch - Jonathan Chang - FINAL COPY
Brunswick (BC) Pitch - Jonathan Chang - FINAL COPYBrunswick (BC) Pitch - Jonathan Chang - FINAL COPY
Brunswick (BC) Pitch - Jonathan Chang - FINAL COPYJonathan Chang
 
Cash Flow Dashboard in Excel
Cash Flow Dashboard in ExcelCash Flow Dashboard in Excel
Cash Flow Dashboard in Excel
Akram Hossain Siblee CPA, CA(UK)
 
WatchOver - Alzheimer's Caregiver Wearable Technology
WatchOver - Alzheimer's Caregiver Wearable TechnologyWatchOver - Alzheimer's Caregiver Wearable Technology
WatchOver - Alzheimer's Caregiver Wearable Technology
John W. Quinn
 
Horniman Horticulture, FIL 349 ( Advanced Financial Theory and Problems)
Horniman Horticulture, FIL 349 ( Advanced Financial Theory and Problems)Horniman Horticulture, FIL 349 ( Advanced Financial Theory and Problems)
Horniman Horticulture, FIL 349 ( Advanced Financial Theory and Problems)
CameronMcintosh8
 
Value Stream Mapping: Undertanding the Current State - Webinar from 5S Supply
Value Stream Mapping: Undertanding the Current State - Webinar from 5S SupplyValue Stream Mapping: Undertanding the Current State - Webinar from 5S Supply
Value Stream Mapping: Undertanding the Current State - Webinar from 5S Supply
5S Supply
 
Budget Projection PowerPoint Presentation Slides
Budget Projection PowerPoint Presentation SlidesBudget Projection PowerPoint Presentation Slides
Budget Projection PowerPoint Presentation Slides
SlideTeam
 
Budget Vs Actual Variance Analysis PowerPoint Presentation Slides
Budget Vs Actual Variance Analysis PowerPoint Presentation SlidesBudget Vs Actual Variance Analysis PowerPoint Presentation Slides
Budget Vs Actual Variance Analysis PowerPoint Presentation Slides
SlideTeam
 
Km Zonalito Feb 2010
Km Zonalito Feb 2010Km Zonalito Feb 2010
Km Zonalito Feb 2010
guest69ba7b
 
Actual Cost Vs Budget PowerPoint Presentation Slides
Actual Cost Vs Budget PowerPoint Presentation Slides Actual Cost Vs Budget PowerPoint Presentation Slides
Actual Cost Vs Budget PowerPoint Presentation Slides
SlideTeam
 
Senario Analysis for Risk management in Corporate Finance
Senario Analysis for Risk management in Corporate FinanceSenario Analysis for Risk management in Corporate Finance
Senario Analysis for Risk management in Corporate Finance
Iman Najafi
 
Financial Model Manufacturing And Retail Businesses
Financial Model Manufacturing And Retail BusinessesFinancial Model Manufacturing And Retail Businesses
Financial Model Manufacturing And Retail Businesses
Elisha A. A. (Capital) Ltd
 

What's hot (20)

CEO Dashboard Template in Excel
CEO Dashboard Template in ExcelCEO Dashboard Template in Excel
CEO Dashboard Template in Excel
 
CFO Dashboard Template in Excel
CFO Dashboard Template in ExcelCFO Dashboard Template in Excel
CFO Dashboard Template in Excel
 
Finance Dashboard Template in Excel
Finance Dashboard Template in ExcelFinance Dashboard Template in Excel
Finance Dashboard Template in Excel
 
Finance Budgeting Powerpoint Presentation Slides
Finance Budgeting Powerpoint Presentation SlidesFinance Budgeting Powerpoint Presentation Slides
Finance Budgeting Powerpoint Presentation Slides
 
Financial Forecasting
Financial ForecastingFinancial Forecasting
Financial Forecasting
 
FIN 667 Hershey Valuation PPT- Final
FIN 667 Hershey Valuation PPT- FinalFIN 667 Hershey Valuation PPT- Final
FIN 667 Hershey Valuation PPT- Final
 
Financial forecast
Financial forecastFinancial forecast
Financial forecast
 
KPI Dashboard Template in Excel
KPI Dashboard Template in ExcelKPI Dashboard Template in Excel
KPI Dashboard Template in Excel
 
Brunswick (BC) Pitch - Jonathan Chang - FINAL COPY
Brunswick (BC) Pitch - Jonathan Chang - FINAL COPYBrunswick (BC) Pitch - Jonathan Chang - FINAL COPY
Brunswick (BC) Pitch - Jonathan Chang - FINAL COPY
 
Cash Flow Dashboard in Excel
Cash Flow Dashboard in ExcelCash Flow Dashboard in Excel
Cash Flow Dashboard in Excel
 
WatchOver - Alzheimer's Caregiver Wearable Technology
WatchOver - Alzheimer's Caregiver Wearable TechnologyWatchOver - Alzheimer's Caregiver Wearable Technology
WatchOver - Alzheimer's Caregiver Wearable Technology
 
Horniman Horticulture, FIL 349 ( Advanced Financial Theory and Problems)
Horniman Horticulture, FIL 349 ( Advanced Financial Theory and Problems)Horniman Horticulture, FIL 349 ( Advanced Financial Theory and Problems)
Horniman Horticulture, FIL 349 ( Advanced Financial Theory and Problems)
 
Mangas campeonato nacional 2015
Mangas campeonato nacional 2015Mangas campeonato nacional 2015
Mangas campeonato nacional 2015
 
Value Stream Mapping: Undertanding the Current State - Webinar from 5S Supply
Value Stream Mapping: Undertanding the Current State - Webinar from 5S SupplyValue Stream Mapping: Undertanding the Current State - Webinar from 5S Supply
Value Stream Mapping: Undertanding the Current State - Webinar from 5S Supply
 
Budget Projection PowerPoint Presentation Slides
Budget Projection PowerPoint Presentation SlidesBudget Projection PowerPoint Presentation Slides
Budget Projection PowerPoint Presentation Slides
 
Budget Vs Actual Variance Analysis PowerPoint Presentation Slides
Budget Vs Actual Variance Analysis PowerPoint Presentation SlidesBudget Vs Actual Variance Analysis PowerPoint Presentation Slides
Budget Vs Actual Variance Analysis PowerPoint Presentation Slides
 
Km Zonalito Feb 2010
Km Zonalito Feb 2010Km Zonalito Feb 2010
Km Zonalito Feb 2010
 
Actual Cost Vs Budget PowerPoint Presentation Slides
Actual Cost Vs Budget PowerPoint Presentation Slides Actual Cost Vs Budget PowerPoint Presentation Slides
Actual Cost Vs Budget PowerPoint Presentation Slides
 
Senario Analysis for Risk management in Corporate Finance
Senario Analysis for Risk management in Corporate FinanceSenario Analysis for Risk management in Corporate Finance
Senario Analysis for Risk management in Corporate Finance
 
Financial Model Manufacturing And Retail Businesses
Financial Model Manufacturing And Retail BusinessesFinancial Model Manufacturing And Retail Businesses
Financial Model Manufacturing And Retail Businesses
 

Viewers also liked

Profiting From "Smart City" APIs
Profiting From "Smart City" APIsProfiting From "Smart City" APIs
Profiting From "Smart City" APIs
ProgrammableWeb
 
Is your business model ready for the future?
Is your business model ready for the future?Is your business model ready for the future?
Is your business model ready for the future?
Patrick Van der Pijl
 
Business model canvas- Entrepreneurship
Business model canvas- Entrepreneurship Business model canvas- Entrepreneurship
Business model canvas- Entrepreneurship
Abeer Ali
 
Business model for critical engineering services
Business model for critical engineering servicesBusiness model for critical engineering services
Business model for critical engineering services
Chris Payne
 
Startup - Finance and funding 1
Startup - Finance and funding 1Startup - Finance and funding 1
Startup - Finance and funding 1
NowMaster Academy
 
Master Workshop Business Modeling - The Institute Mexico
Master Workshop Business Modeling - The Institute MexicoMaster Workshop Business Modeling - The Institute Mexico
Master Workshop Business Modeling - The Institute MexicoTheInstituteMexico
 
Financial Planning for the startup CEO - Entrepreneurship 101 (2012/2013)
Financial Planning for the startup CEO - Entrepreneurship 101 (2012/2013)Financial Planning for the startup CEO - Entrepreneurship 101 (2012/2013)
Financial Planning for the startup CEO - Entrepreneurship 101 (2012/2013)
MaRS Discovery District
 
10 Tips 4 Business Model Innovation
10 Tips 4 Business Model Innovation10 Tips 4 Business Model Innovation
10 Tips 4 Business Model Innovation
Patrick Van der Pijl
 
Start-up Financial Forecasting
Start-up Financial ForecastingStart-up Financial Forecasting
Start-up Financial Forecasting
Eric Tachibana
 
Start Up Finance
Start Up FinanceStart Up Finance
Start Up FinanceGina Evans
 
Advanced Business Model Canvas
Advanced Business Model CanvasAdvanced Business Model Canvas
Advanced Business Model Canvas
Rod King, Ph.D.
 
Visually Integrating Porter’s 5 Forces of Competition with the Business Model...
Visually Integrating Porter’s 5 Forces of Competition with the Business Model...Visually Integrating Porter’s 5 Forces of Competition with the Business Model...
Visually Integrating Porter’s 5 Forces of Competition with the Business Model...
Rod King, Ph.D.
 
APExampleAnalysis
APExampleAnalysisAPExampleAnalysis
APExampleAnalysis
Timo Nurminiemi
 
Basics of Startup Financial Planning
Basics of Startup Financial PlanningBasics of Startup Financial Planning
Basics of Startup Financial Planning
eCornell
 
Presenting your startup budget
Presenting your startup budgetPresenting your startup budget
Presenting your startup budgetJan Bendtsen
 

Viewers also liked (16)

Profiting From "Smart City" APIs
Profiting From "Smart City" APIsProfiting From "Smart City" APIs
Profiting From "Smart City" APIs
 
Is your business model ready for the future?
Is your business model ready for the future?Is your business model ready for the future?
Is your business model ready for the future?
 
Business model canvas- Entrepreneurship
Business model canvas- Entrepreneurship Business model canvas- Entrepreneurship
Business model canvas- Entrepreneurship
 
Business model for critical engineering services
Business model for critical engineering servicesBusiness model for critical engineering services
Business model for critical engineering services
 
Startup - Finance and funding 1
Startup - Finance and funding 1Startup - Finance and funding 1
Startup - Finance and funding 1
 
Master Workshop Business Modeling - The Institute Mexico
Master Workshop Business Modeling - The Institute MexicoMaster Workshop Business Modeling - The Institute Mexico
Master Workshop Business Modeling - The Institute Mexico
 
Financial Planning for the startup CEO - Entrepreneurship 101 (2012/2013)
Financial Planning for the startup CEO - Entrepreneurship 101 (2012/2013)Financial Planning for the startup CEO - Entrepreneurship 101 (2012/2013)
Financial Planning for the startup CEO - Entrepreneurship 101 (2012/2013)
 
10 Tips 4 Business Model Innovation
10 Tips 4 Business Model Innovation10 Tips 4 Business Model Innovation
10 Tips 4 Business Model Innovation
 
Start-up Financial Forecasting
Start-up Financial ForecastingStart-up Financial Forecasting
Start-up Financial Forecasting
 
Start Up Finance
Start Up FinanceStart Up Finance
Start Up Finance
 
Advanced Business Model Canvas
Advanced Business Model CanvasAdvanced Business Model Canvas
Advanced Business Model Canvas
 
Visually Integrating Porter’s 5 Forces of Competition with the Business Model...
Visually Integrating Porter’s 5 Forces of Competition with the Business Model...Visually Integrating Porter’s 5 Forces of Competition with the Business Model...
Visually Integrating Porter’s 5 Forces of Competition with the Business Model...
 
APExampleAnalysis
APExampleAnalysisAPExampleAnalysis
APExampleAnalysis
 
Basics of Startup Financial Planning
Basics of Startup Financial PlanningBasics of Startup Financial Planning
Basics of Startup Financial Planning
 
Presenting your startup budget
Presenting your startup budgetPresenting your startup budget
Presenting your startup budget
 
Canvas examples
Canvas examplesCanvas examples
Canvas examples
 

Similar to Startup Financial Modeling

AIA2019 - Rick Rasmussen - Startup Financials
AIA2019 - Rick Rasmussen - Startup FinancialsAIA2019 - Rick Rasmussen - Startup Financials
AIA2019 - Rick Rasmussen - Startup Financials
European Innovation Academy
 
Financial Forecasting
Financial ForecastingFinancial Forecasting
Financial Forecasting
TravonnLee
 
Financial Forecasting
Financial ForecastingFinancial Forecasting
Financial Forecasting
AlayshaOrtiz1
 
Clinton Global Initiative Hult Prize Finalist Presentation - Harambee
Clinton Global Initiative Hult Prize Finalist Presentation - HarambeeClinton Global Initiative Hult Prize Finalist Presentation - Harambee
Clinton Global Initiative Hult Prize Finalist Presentation - Harambee
Big Fish Presentations
 
Profit blueprint
Profit blueprintProfit blueprint
Principals of Business Finance
Principals of Business FinancePrincipals of Business Finance
Principals of Business Finance
Kathleen Boushele
 
Swifton CFOs LLC - Boston BizSpark presentation - Financial Projections for I...
Swifton CFOs LLC - Boston BizSpark presentation - Financial Projections for I...Swifton CFOs LLC - Boston BizSpark presentation - Financial Projections for I...
Swifton CFOs LLC - Boston BizSpark presentation - Financial Projections for I...David Fogel
 
Financial Forecast
Financial ForecastFinancial Forecast
Financial Forecast
Marc Tejeda
 
Best CaseIncome Statement (Unaudited)(for years ending September 1.docx
Best CaseIncome Statement (Unaudited)(for years ending September 1.docxBest CaseIncome Statement (Unaudited)(for years ending September 1.docx
Best CaseIncome Statement (Unaudited)(for years ending September 1.docx
AASTHA76
 
Financial Forecasting: Pro Forma Marketing Budget & Income Statement for a Li...
Financial Forecasting: Pro Forma Marketing Budget & Income Statement for a Li...Financial Forecasting: Pro Forma Marketing Budget & Income Statement for a Li...
Financial Forecasting: Pro Forma Marketing Budget & Income Statement for a Li...
Alexzandra Halbritter
 
EmbroidMe NYC Presentation
EmbroidMe NYC PresentationEmbroidMe NYC Presentation
EmbroidMe NYC Presentation
karenezzi
 
~$Embroid me nyc presentation2
~$Embroid me nyc presentation2~$Embroid me nyc presentation2
~$Embroid me nyc presentation2karenezzi
 
Financial statements
Financial statementsFinancial statements
Financial statements
Britteny2
 
Afternoon Sessions
Afternoon SessionsAfternoon Sessions
Afternoon Sessionsgmm0611
 
Round 2 - 2020Sim ID Z79546_8High Level OverviewTe.docx
Round 2 - 2020Sim ID Z79546_8High Level OverviewTe.docxRound 2 - 2020Sim ID Z79546_8High Level OverviewTe.docx
Round 2 - 2020Sim ID Z79546_8High Level OverviewTe.docx
daniely50
 
EIA2019Portugal - Building Your Financials - Rick Rasmussen
EIA2019Portugal - Building Your Financials - Rick RasmussenEIA2019Portugal - Building Your Financials - Rick Rasmussen
EIA2019Portugal - Building Your Financials - Rick Rasmussen
European Innovation Academy
 
Модель органической фермы. Роман Макухин
Модель органической фермы. Роман МакухинМодель органической фермы. Роман Макухин
Модель органической фермы. Роман Макухин
Зелена Школа
 
Executive Summary Final
Executive Summary FinalExecutive Summary Final
Executive Summary FinalAVINRAM
 

Similar to Startup Financial Modeling (20)

AIA2019 - Rick Rasmussen - Startup Financials
AIA2019 - Rick Rasmussen - Startup FinancialsAIA2019 - Rick Rasmussen - Startup Financials
AIA2019 - Rick Rasmussen - Startup Financials
 
Financial Forecasting
Financial ForecastingFinancial Forecasting
Financial Forecasting
 
Financial Forecasting
Financial ForecastingFinancial Forecasting
Financial Forecasting
 
Clinton Global Initiative Hult Prize Finalist Presentation - Harambee
Clinton Global Initiative Hult Prize Finalist Presentation - HarambeeClinton Global Initiative Hult Prize Finalist Presentation - Harambee
Clinton Global Initiative Hult Prize Finalist Presentation - Harambee
 
Profit blueprint
Profit blueprintProfit blueprint
Profit blueprint
 
Principals of Business Finance
Principals of Business FinancePrincipals of Business Finance
Principals of Business Finance
 
Swifton CFOs LLC - Boston BizSpark presentation - Financial Projections for I...
Swifton CFOs LLC - Boston BizSpark presentation - Financial Projections for I...Swifton CFOs LLC - Boston BizSpark presentation - Financial Projections for I...
Swifton CFOs LLC - Boston BizSpark presentation - Financial Projections for I...
 
Financial Forecast
Financial ForecastFinancial Forecast
Financial Forecast
 
Best CaseIncome Statement (Unaudited)(for years ending September 1.docx
Best CaseIncome Statement (Unaudited)(for years ending September 1.docxBest CaseIncome Statement (Unaudited)(for years ending September 1.docx
Best CaseIncome Statement (Unaudited)(for years ending September 1.docx
 
Financial Forecasting: Pro Forma Marketing Budget & Income Statement for a Li...
Financial Forecasting: Pro Forma Marketing Budget & Income Statement for a Li...Financial Forecasting: Pro Forma Marketing Budget & Income Statement for a Li...
Financial Forecasting: Pro Forma Marketing Budget & Income Statement for a Li...
 
EmbroidMe NYC Presentation
EmbroidMe NYC PresentationEmbroidMe NYC Presentation
EmbroidMe NYC Presentation
 
~$Embroid me nyc presentation2
~$Embroid me nyc presentation2~$Embroid me nyc presentation2
~$Embroid me nyc presentation2
 
Case 2
Case 2Case 2
Case 2
 
Financial statements
Financial statementsFinancial statements
Financial statements
 
Afternoon Sessions
Afternoon SessionsAfternoon Sessions
Afternoon Sessions
 
Round 2 - 2020Sim ID Z79546_8High Level OverviewTe.docx
Round 2 - 2020Sim ID Z79546_8High Level OverviewTe.docxRound 2 - 2020Sim ID Z79546_8High Level OverviewTe.docx
Round 2 - 2020Sim ID Z79546_8High Level OverviewTe.docx
 
Exhibits - Copy
Exhibits - CopyExhibits - Copy
Exhibits - Copy
 
EIA2019Portugal - Building Your Financials - Rick Rasmussen
EIA2019Portugal - Building Your Financials - Rick RasmussenEIA2019Portugal - Building Your Financials - Rick Rasmussen
EIA2019Portugal - Building Your Financials - Rick Rasmussen
 
Модель органической фермы. Роман Макухин
Модель органической фермы. Роман МакухинМодель органической фермы. Роман Макухин
Модель органической фермы. Роман Макухин
 
Executive Summary Final
Executive Summary FinalExecutive Summary Final
Executive Summary Final
 

More from Bryan Hassin

Startup Fundraising
Startup FundraisingStartup Fundraising
Startup Fundraising
Bryan Hassin
 
Startup Fundraising Strategies: The Good, The Bad, and The Ugly
Startup Fundraising Strategies: The Good, The Bad, and The UglyStartup Fundraising Strategies: The Good, The Bad, and The Ugly
Startup Fundraising Strategies: The Good, The Bad, and The Ugly
Bryan Hassin
 
Entrepreneurial Leadership
Entrepreneurial LeadershipEntrepreneurial Leadership
Entrepreneurial Leadership
Bryan Hassin
 
The Entrepreneur's Journey - We Are The Explorers
The Entrepreneur's Journey - We Are The ExplorersThe Entrepreneur's Journey - We Are The Explorers
The Entrepreneur's Journey - We Are The Explorers
Bryan Hassin
 
The Future of Energy: Engaging the Consumer
The Future of Energy: Engaging the ConsumerThe Future of Energy: Engaging the Consumer
The Future of Energy: Engaging the Consumer
Bryan Hassin
 
Smart OES Presentation at IMD MBA 2008 5-Year Reunion
Smart OES Presentation at IMD MBA 2008 5-Year ReunionSmart OES Presentation at IMD MBA 2008 5-Year Reunion
Smart OES Presentation at IMD MBA 2008 5-Year Reunion
Bryan Hassin
 
Smart Office Energy Solutions 5-Min Presentation
Smart Office Energy Solutions 5-Min PresentationSmart Office Energy Solutions 5-Min Presentation
Smart Office Energy Solutions 5-Min Presentation
Bryan Hassin
 
Marketing and Sales for Startups
Marketing and Sales for StartupsMarketing and Sales for Startups
Marketing and Sales for Startups
Bryan Hassin
 
Customer Development Deep Dive
Customer Development Deep DiveCustomer Development Deep Dive
Customer Development Deep Dive
Bryan Hassin
 
Designing a Business
Designing a BusinessDesigning a Business
Designing a Business
Bryan Hassin
 
Entrepreneurship for Big Corporate
Entrepreneurship for Big CorporateEntrepreneurship for Big Corporate
Entrepreneurship for Big Corporate
Bryan Hassin
 
The Entrepreneur's Journey
The Entrepreneur's JourneyThe Entrepreneur's Journey
The Entrepreneur's Journey
Bryan Hassin
 
Startup Weekend Houston Keynote July 2012
Startup Weekend Houston Keynote July 2012Startup Weekend Houston Keynote July 2012
Startup Weekend Houston Keynote July 2012
Bryan Hassin
 
A Meaningful Journey: One Entrepreneur's Quest to Bring Together Capitalism a...
A Meaningful Journey: One Entrepreneur's Quest to Bring Together Capitalism a...A Meaningful Journey: One Entrepreneur's Quest to Bring Together Capitalism a...
A Meaningful Journey: One Entrepreneur's Quest to Bring Together Capitalism a...
Bryan Hassin
 
Strength Training for Executives
Strength Training for ExecutivesStrength Training for Executives
Strength Training for Executives
Bryan Hassin
 
The Power of Informed People
The Power of Informed PeopleThe Power of Informed People
The Power of Informed People
Bryan Hassin
 

More from Bryan Hassin (16)

Startup Fundraising
Startup FundraisingStartup Fundraising
Startup Fundraising
 
Startup Fundraising Strategies: The Good, The Bad, and The Ugly
Startup Fundraising Strategies: The Good, The Bad, and The UglyStartup Fundraising Strategies: The Good, The Bad, and The Ugly
Startup Fundraising Strategies: The Good, The Bad, and The Ugly
 
Entrepreneurial Leadership
Entrepreneurial LeadershipEntrepreneurial Leadership
Entrepreneurial Leadership
 
The Entrepreneur's Journey - We Are The Explorers
The Entrepreneur's Journey - We Are The ExplorersThe Entrepreneur's Journey - We Are The Explorers
The Entrepreneur's Journey - We Are The Explorers
 
The Future of Energy: Engaging the Consumer
The Future of Energy: Engaging the ConsumerThe Future of Energy: Engaging the Consumer
The Future of Energy: Engaging the Consumer
 
Smart OES Presentation at IMD MBA 2008 5-Year Reunion
Smart OES Presentation at IMD MBA 2008 5-Year ReunionSmart OES Presentation at IMD MBA 2008 5-Year Reunion
Smart OES Presentation at IMD MBA 2008 5-Year Reunion
 
Smart Office Energy Solutions 5-Min Presentation
Smart Office Energy Solutions 5-Min PresentationSmart Office Energy Solutions 5-Min Presentation
Smart Office Energy Solutions 5-Min Presentation
 
Marketing and Sales for Startups
Marketing and Sales for StartupsMarketing and Sales for Startups
Marketing and Sales for Startups
 
Customer Development Deep Dive
Customer Development Deep DiveCustomer Development Deep Dive
Customer Development Deep Dive
 
Designing a Business
Designing a BusinessDesigning a Business
Designing a Business
 
Entrepreneurship for Big Corporate
Entrepreneurship for Big CorporateEntrepreneurship for Big Corporate
Entrepreneurship for Big Corporate
 
The Entrepreneur's Journey
The Entrepreneur's JourneyThe Entrepreneur's Journey
The Entrepreneur's Journey
 
Startup Weekend Houston Keynote July 2012
Startup Weekend Houston Keynote July 2012Startup Weekend Houston Keynote July 2012
Startup Weekend Houston Keynote July 2012
 
A Meaningful Journey: One Entrepreneur's Quest to Bring Together Capitalism a...
A Meaningful Journey: One Entrepreneur's Quest to Bring Together Capitalism a...A Meaningful Journey: One Entrepreneur's Quest to Bring Together Capitalism a...
A Meaningful Journey: One Entrepreneur's Quest to Bring Together Capitalism a...
 
Strength Training for Executives
Strength Training for ExecutivesStrength Training for Executives
Strength Training for Executives
 
The Power of Informed People
The Power of Informed PeopleThe Power of Informed People
The Power of Informed People
 

Recently uploaded

Organizational Change Leadership Agile Tour Geneve 2024
Organizational Change Leadership Agile Tour Geneve 2024Organizational Change Leadership Agile Tour Geneve 2024
Organizational Change Leadership Agile Tour Geneve 2024
Kirill Klimov
 
Exploring Patterns of Connection with Social Dreaming
Exploring Patterns of Connection with Social DreamingExploring Patterns of Connection with Social Dreaming
Exploring Patterns of Connection with Social Dreaming
Nicola Wreford-Howard
 
Buy Verified PayPal Account | Buy Google 5 Star Reviews
Buy Verified PayPal Account | Buy Google 5 Star ReviewsBuy Verified PayPal Account | Buy Google 5 Star Reviews
Buy Verified PayPal Account | Buy Google 5 Star Reviews
usawebmarket
 
Recruiting in the Digital Age: A Social Media Masterclass
Recruiting in the Digital Age: A Social Media MasterclassRecruiting in the Digital Age: A Social Media Masterclass
Recruiting in the Digital Age: A Social Media Masterclass
LuanWise
 
Introduction to Amazon company 111111111111
Introduction to Amazon company 111111111111Introduction to Amazon company 111111111111
Introduction to Amazon company 111111111111
zoyaansari11365
 
ikea_woodgreen_petscharity_cat-alogue_digital.pdf
ikea_woodgreen_petscharity_cat-alogue_digital.pdfikea_woodgreen_petscharity_cat-alogue_digital.pdf
ikea_woodgreen_petscharity_cat-alogue_digital.pdf
agatadrynko
 
Building Your Employer Brand with Social Media
Building Your Employer Brand with Social MediaBuilding Your Employer Brand with Social Media
Building Your Employer Brand with Social Media
LuanWise
 
The effects of customers service quality and online reviews on customer loyal...
The effects of customers service quality and online reviews on customer loyal...The effects of customers service quality and online reviews on customer loyal...
The effects of customers service quality and online reviews on customer loyal...
balatucanapplelovely
 
Digital Transformation and IT Strategy Toolkit and Templates
Digital Transformation and IT Strategy Toolkit and TemplatesDigital Transformation and IT Strategy Toolkit and Templates
Digital Transformation and IT Strategy Toolkit and Templates
Aurelien Domont, MBA
 
Mastering B2B Payments Webinar from BlueSnap
Mastering B2B Payments Webinar from BlueSnapMastering B2B Payments Webinar from BlueSnap
Mastering B2B Payments Webinar from BlueSnap
Norma Mushkat Gaffin
 
Business Valuation Principles for Entrepreneurs
Business Valuation Principles for EntrepreneursBusiness Valuation Principles for Entrepreneurs
Business Valuation Principles for Entrepreneurs
Ben Wann
 
ikea_woodgreen_petscharity_dog-alogue_digital.pdf
ikea_woodgreen_petscharity_dog-alogue_digital.pdfikea_woodgreen_petscharity_dog-alogue_digital.pdf
ikea_woodgreen_petscharity_dog-alogue_digital.pdf
agatadrynko
 
Authentically Social Presented by Corey Perlman
Authentically Social Presented by Corey PerlmanAuthentically Social Presented by Corey Perlman
Authentically Social Presented by Corey Perlman
Corey Perlman, Social Media Speaker and Consultant
 
Bài tập - Tiếng anh 11 Global Success UNIT 1 - Bản HS.doc
Bài tập - Tiếng anh 11 Global Success UNIT 1 - Bản HS.docBài tập - Tiếng anh 11 Global Success UNIT 1 - Bản HS.doc
Bài tập - Tiếng anh 11 Global Success UNIT 1 - Bản HS.doc
daothibichhang1
 
FINAL PRESENTATION.pptx12143241324134134
FINAL PRESENTATION.pptx12143241324134134FINAL PRESENTATION.pptx12143241324134134
FINAL PRESENTATION.pptx12143241324134134
LR1709MUSIC
 
Evgen Osmak: Methods of key project parameters estimation: from the shaman-in...
Evgen Osmak: Methods of key project parameters estimation: from the shaman-in...Evgen Osmak: Methods of key project parameters estimation: from the shaman-in...
Evgen Osmak: Methods of key project parameters estimation: from the shaman-in...
Lviv Startup Club
 
LA HUG - Video Testimonials with Chynna Morgan - June 2024
LA HUG - Video Testimonials with Chynna Morgan - June 2024LA HUG - Video Testimonials with Chynna Morgan - June 2024
LA HUG - Video Testimonials with Chynna Morgan - June 2024
Lital Barkan
 
Agency Managed Advisory Board As a Solution To Career Path Defining Business ...
Agency Managed Advisory Board As a Solution To Career Path Defining Business ...Agency Managed Advisory Board As a Solution To Career Path Defining Business ...
Agency Managed Advisory Board As a Solution To Career Path Defining Business ...
Boris Ziegler
 
Improving profitability for small business
Improving profitability for small businessImproving profitability for small business
Improving profitability for small business
Ben Wann
 
Project File Report BBA 6th semester.pdf
Project File Report BBA 6th semester.pdfProject File Report BBA 6th semester.pdf
Project File Report BBA 6th semester.pdf
RajPriye
 

Recently uploaded (20)

Organizational Change Leadership Agile Tour Geneve 2024
Organizational Change Leadership Agile Tour Geneve 2024Organizational Change Leadership Agile Tour Geneve 2024
Organizational Change Leadership Agile Tour Geneve 2024
 
Exploring Patterns of Connection with Social Dreaming
Exploring Patterns of Connection with Social DreamingExploring Patterns of Connection with Social Dreaming
Exploring Patterns of Connection with Social Dreaming
 
Buy Verified PayPal Account | Buy Google 5 Star Reviews
Buy Verified PayPal Account | Buy Google 5 Star ReviewsBuy Verified PayPal Account | Buy Google 5 Star Reviews
Buy Verified PayPal Account | Buy Google 5 Star Reviews
 
Recruiting in the Digital Age: A Social Media Masterclass
Recruiting in the Digital Age: A Social Media MasterclassRecruiting in the Digital Age: A Social Media Masterclass
Recruiting in the Digital Age: A Social Media Masterclass
 
Introduction to Amazon company 111111111111
Introduction to Amazon company 111111111111Introduction to Amazon company 111111111111
Introduction to Amazon company 111111111111
 
ikea_woodgreen_petscharity_cat-alogue_digital.pdf
ikea_woodgreen_petscharity_cat-alogue_digital.pdfikea_woodgreen_petscharity_cat-alogue_digital.pdf
ikea_woodgreen_petscharity_cat-alogue_digital.pdf
 
Building Your Employer Brand with Social Media
Building Your Employer Brand with Social MediaBuilding Your Employer Brand with Social Media
Building Your Employer Brand with Social Media
 
The effects of customers service quality and online reviews on customer loyal...
The effects of customers service quality and online reviews on customer loyal...The effects of customers service quality and online reviews on customer loyal...
The effects of customers service quality and online reviews on customer loyal...
 
Digital Transformation and IT Strategy Toolkit and Templates
Digital Transformation and IT Strategy Toolkit and TemplatesDigital Transformation and IT Strategy Toolkit and Templates
Digital Transformation and IT Strategy Toolkit and Templates
 
Mastering B2B Payments Webinar from BlueSnap
Mastering B2B Payments Webinar from BlueSnapMastering B2B Payments Webinar from BlueSnap
Mastering B2B Payments Webinar from BlueSnap
 
Business Valuation Principles for Entrepreneurs
Business Valuation Principles for EntrepreneursBusiness Valuation Principles for Entrepreneurs
Business Valuation Principles for Entrepreneurs
 
ikea_woodgreen_petscharity_dog-alogue_digital.pdf
ikea_woodgreen_petscharity_dog-alogue_digital.pdfikea_woodgreen_petscharity_dog-alogue_digital.pdf
ikea_woodgreen_petscharity_dog-alogue_digital.pdf
 
Authentically Social Presented by Corey Perlman
Authentically Social Presented by Corey PerlmanAuthentically Social Presented by Corey Perlman
Authentically Social Presented by Corey Perlman
 
Bài tập - Tiếng anh 11 Global Success UNIT 1 - Bản HS.doc
Bài tập - Tiếng anh 11 Global Success UNIT 1 - Bản HS.docBài tập - Tiếng anh 11 Global Success UNIT 1 - Bản HS.doc
Bài tập - Tiếng anh 11 Global Success UNIT 1 - Bản HS.doc
 
FINAL PRESENTATION.pptx12143241324134134
FINAL PRESENTATION.pptx12143241324134134FINAL PRESENTATION.pptx12143241324134134
FINAL PRESENTATION.pptx12143241324134134
 
Evgen Osmak: Methods of key project parameters estimation: from the shaman-in...
Evgen Osmak: Methods of key project parameters estimation: from the shaman-in...Evgen Osmak: Methods of key project parameters estimation: from the shaman-in...
Evgen Osmak: Methods of key project parameters estimation: from the shaman-in...
 
LA HUG - Video Testimonials with Chynna Morgan - June 2024
LA HUG - Video Testimonials with Chynna Morgan - June 2024LA HUG - Video Testimonials with Chynna Morgan - June 2024
LA HUG - Video Testimonials with Chynna Morgan - June 2024
 
Agency Managed Advisory Board As a Solution To Career Path Defining Business ...
Agency Managed Advisory Board As a Solution To Career Path Defining Business ...Agency Managed Advisory Board As a Solution To Career Path Defining Business ...
Agency Managed Advisory Board As a Solution To Career Path Defining Business ...
 
Improving profitability for small business
Improving profitability for small businessImproving profitability for small business
Improving profitability for small business
 
Project File Report BBA 6th semester.pdf
Project File Report BBA 6th semester.pdfProject File Report BBA 6th semester.pdf
Project File Report BBA 6th semester.pdf
 

Startup Financial Modeling

  • 1. Financial Modeling 2013-07-10 Bryan Guido Hassin Entrepreneur In Residence
  • 2. Two Areas of the Business Model Canvas require more detail • The Business Model Canvas is a great high-level tool • But revenues and costs require more detailed work to ensure your business is sustainable • These two areas comprise the Financial Model (simplified) 2
  • 4. R – C = P REVENUES – COSTS = PROFIT UNITS X PRICE MATERIALS LABOR FACILITIES A basic Financial Model focuses on your venture’s income Your Goal: Source: John Pimentel 4
  • 5. The best Financial Models are built from the bottom up Top Down • “If we capture x% of the market, we can make y profit” Bottom Up • “If we employ x sales people, paying them y and expecting z1 sales per person in month 1, z2 sales in month 2, … etc” • This is a wish • But is useful for reality checking Source: John Pimentel 5
  • 6. Example Financial Model1 2 3 4 5 6 7 8 9 10 11 12 REVENUE Units 1 2 3 4 5 6 7 8 9 10 11 12 Price $100 $90 $81 $73 $66 $59 $53 $48 $43 $39 $35 $31 Total Revenue $100 $180 $243 $292 $328 $354 $372 $383 $387 $387 $384 $377 COSTS Cost of Goods Sold Raw Materials $10 $20 $30 $40 $50 $60 $70 $80 $90 $80 $88 $96 Direct Labor $50 $50 $50 $50 $50 $100 $100 $100 $100 $100 $150 $150 Facilities & Equipment $20 $20 $20 $20 $20 $25 $25 $25 $25 $25 $30 $30 Total COGS $80 $90 $100 $110 $120 $185 $195 $205 $215 $205 $268 $276 Gross Profit $20 $90 $143 $182 $208 $169 $177 $178 $172 $182 $116 $101 Gross Margin 20% 50% 59% 62% 63% 48% 48% 46% 45% 47% 30% 27% Fixed Overheads Research & Development $0 $0 $0 $0 $0 $0 $50 $50 $50 $50 $50 $50 Marketing $0 $0 $0 $0 $0 $0 $0 $0 $0 $0 $0 $0 General & Administrative $100 $100 $100 $100 $100 $100 $100 $100 $100 $200 $200 $200 Total Fixed Overheads $100 $100 $100 $100 $100 $100 $150 $150 $150 $250 $250 $250 Total Costs $180 $190 $200 $210 $220 $285 $345 $355 $365 $455 $518 $526 Net Profit ($80) ($10) $43 $82 $108 $69 $27 $28 $22 ($68) ($134) ($149) Net Margin -80% -6% 18% 28% 33% 20% 7% 7% 6% -17% -35% -40% Cash Balance ($80) ($90) ($47) $35 $143 $212 $239 $267 $289 $221 $87 ($62) 6
  • 7. 1 2 3 4 5 6 7 8 9 10 11 12 REVENUE Units 1 2 3 4 5 6 7 8 9 10 11 12 Price $100 $90 $81 $73 $66 $59 $53 $48 $43 $39 $35 $31 Total Revenue $100 $180 $243 $292 $328 $354 $372 $383 $387 $387 $384 $377 COSTS Cost of Goods Sold Raw Materials $10 $20 $30 $40 $50 $60 $70 $80 $90 $80 $88 $96 Direct Labor $50 $50 $50 $50 $50 $100 $100 $100 $100 $100 $150 $150 Facilities & Equipment $20 $20 $20 $20 $20 $25 $25 $25 $25 $25 $30 $30 Total COGS $80 $90 $100 $110 $120 $185 $195 $205 $215 $205 $268 $276 Gross Profit $20 $90 $143 $182 $208 $169 $177 $178 $172 $182 $116 $101 Gross Margin 20% 50% 59% 62% 63% 48% 48% 46% 45% 47% 30% 27% Fixed Overheads Research & Development $0 $0 $0 $0 $0 $0 $50 $50 $50 $50 $50 $50 Marketing $0 $0 $0 $0 $0 $0 $0 $0 $0 $0 $0 $0 General & Administrative $100 $100 $100 $100 $100 $100 $100 $100 $100 $200 $200 $200 Total Fixed Overheads $100 $100 $100 $100 $100 $100 $150 $150 $150 $250 $250 $250 Total Costs $180 $190 $200 $210 $220 $285 $345 $355 $365 $455 $518 $526 Net Profit ($80) ($10) $43 $82 $108 $69 $27 $28 $22 ($68) ($134) ($149) Net Margin -80% -6% 18% 28% 33% 20% 7% 7% 6% -17% -35% -40% Cash Balance ($80) ($90) ($47) $35 $143 $212 $239 $267 $289 $221 $87 ($62) How much investment capital is needed? 7
  • 8. 1 2 3 4 5 6 7 8 9 10 11 12 REVENUE Units 1 2 3 4 5 6 7 8 9 10 11 12 Price $100 $90 $81 $73 $66 $59 $53 $48 $43 $39 $35 $31 Total Revenue $100 $180 $243 $292 $328 $354 $372 $383 $387 $387 $384 $377 COSTS Cost of Goods Sold Raw Materials $10 $20 $30 $40 $50 $60 $70 $80 $90 $80 $88 $96 Direct Labor $50 $50 $50 $50 $50 $100 $100 $100 $100 $100 $150 $150 Facilities & Equipment $20 $20 $20 $20 $20 $25 $25 $25 $25 $25 $30 $30 Total COGS $80 $90 $100 $110 $120 $185 $195 $205 $215 $205 $268 $276 Gross Profit $20 $90 $143 $182 $208 $169 $177 $178 $172 $182 $116 $101 Gross Margin 20% 50% 59% 62% 63% 48% 48% 46% 45% 47% 30% 27% Fixed Overheads Research & Development $0 $0 $0 $0 $0 $0 $50 $50 $50 $50 $50 $50 Marketing $0 $0 $0 $0 $0 $0 $0 $0 $0 $0 $0 $0 General & Administrative $100 $100 $100 $100 $100 $100 $100 $100 $100 $200 $200 $200 Total Fixed Overheads $100 $100 $100 $100 $100 $100 $150 $150 $150 $250 $250 $250 Total Costs $180 $190 $200 $210 $220 $285 $345 $355 $365 $455 $518 $526 Net Profit ($80) ($10) $43 $82 $108 $69 $27 $28 $22 ($68) ($134) ($149) Net Margin -80% -6% 18% 28% 33% 20% 7% 7% 6% -17% -35% -40% Cash Balance ($80) ($90) ($47) $35 $143 $212 $239 $267 $289 $221 $87 ($62) What’s wrong with this model? Profit peaks in month 5 => not scalable! 8
  • 9. Use sensitivity analysis to identify key financial model drivers • Prices ↑ or ↓ (10%? 20%?) • Unit volume ↑ or ↓ (10%? 20%?) – Consider Marketing options • COGS ↑ or ↓ – Consider alternative suppliers • Fixed Overheads ↑ or ↓ – Delay hiring, buy used equipment 9
  • 10. 1 2 3 4 5 6 7 8 9 10 11 12 REVENUE Units 1 2 3 4 5 6 7 8 9 10 11 12 Price $100 $90 $81 $73 $66 $59 $53 $48 $43 $39 $35 $31 Total Revenue $100 $180 $243 $292 $328 $354 $372 $383 $387 $387 $384 $377 COSTS Cost of Goods Sold Raw Materials $10 $20 $30 $40 $50 $60 $70 $80 $90 $80 $88 $96 Direct Labor $50 $50 $50 $50 $50 $100 $100 $100 $100 $100 $150 $150 Facilities & Equipment $20 $20 $20 $20 $20 $25 $25 $25 $25 $25 $30 $30 Total COGS $80 $90 $100 $110 $120 $185 $195 $205 $215 $205 $268 $276 Gross Profit $20 $90 $143 $182 $208 $169 $177 $178 $172 $182 $116 $101 Gross Margin 20% 50% 59% 62% 63% 48% 48% 46% 45% 47% 30% 27% Fixed Overheads Research & Development $0 $0 $0 $0 $0 $0 $50 $50 $50 $50 $50 $50 Marketing $0 $0 $0 $0 $0 $0 $0 $0 $0 $0 $0 $0 General & Administrative $100 $100 $100 $100 $100 $100 $100 $100 $100 $200 $200 $200 Total Fixed Overheads $100 $100 $100 $100 $100 $100 $150 $150 $150 $250 $250 $250 Total Costs $180 $190 $200 $210 $220 $285 $345 $355 $365 $455 $518 $526 Net Profit ($80) ($10) $43 $82 $108 $69 $27 $28 $22 ($68) ($134) ($149) Net Margin -80% -6% 18% 28% 33% 20% 7% 7% 6% -17% -35% -40% Cash Balance ($80) ($90) ($47) $35 $143 $212 $239 $267 $289 $221 $87 ($62) Why does profit fall off? Two cost lines are out of control and pricing doesn’t scale 10
  • 11. 1 2 3 4 5 6 7 8 9 10 11 12 REVENUE Units 1 2 3 4 5 6 7 8 9 10 11 12 Price $100 $90 $81 $73 $66 $59 $53 $48 $43 $39 $35 $31 Total Revenue $100 $180 $243 $292 $328 $354 $372 $383 $387 $387 $384 $377 COSTS Cost of Goods Sold Raw Materials $10 $20 $30 $40 $50 $60 $70 $80 $90 $80 $88 $96 Direct Labor $50 $50 $50 $50 $50 $100 $100 $100 $100 $100 $150 $150 Facilities & Equipment $20 $20 $20 $20 $20 $25 $25 $25 $25 $25 $30 $30 Total COGS $80 $90 $100 $110 $120 $185 $195 $205 $215 $205 $268 $276 Gross Profit $20 $90 $143 $182 $208 $169 $177 $178 $172 $182 $116 $101 Gross Margin 20% 50% 59% 62% 63% 48% 48% 46% 45% 47% 30% 27% Fixed Overheads Research & Development $0 $0 $0 $0 $0 $0 $50 $50 $50 $50 $50 $50 Marketing $0 $0 $0 $0 $0 $0 $0 $0 $0 $0 $0 $0 General & Administrative $100 $100 $100 $100 $100 $100 $100 $100 $100 $200 $200 $200 Total Fixed Overheads $100 $100 $100 $100 $100 $100 $150 $150 $150 $250 $250 $250 Total Costs $180 $190 $200 $210 $220 $285 $345 $355 $365 $455 $518 $526 Net Profit ($80) ($10) $43 $82 $108 $69 $27 $28 $22 ($68) ($134) ($149) Net Margin -80% -6% 18% 28% 33% 20% 7% 7% 6% -17% -35% -40% Cash Balance ($80) ($90) ($47) $35 $143 $212 $239 $267 $289 $221 $87 ($62) How should we address the profit fall-off? A marketing investment should buoy price, increase sales 11
  • 12. Now this is an investable model!1 2 3 4 5 6 7 8 9 10 11 12 REVENUE Units 1 3 5 7 9 11 13 15 17 19 21 23 Price $100 $95 $90 $86 $81 $77 $74 $70 $66 $63 $60 $57 Total Revenue $100 $285 $451 $600 $733 $851 $956 $1,048 $1,128 $1,197 $1,257 $1,308 COSTS Cost of Goods Sold Raw Materials $10 $30 $50 $70 $90 $110 $130 $150 $170 $152 $168 $184 Direct Labor $50 $50 $50 $50 $50 $100 $100 $100 $100 $100 $150 $150 Facilities & Equipment $20 $20 $20 $20 $20 $25 $25 $25 $25 $25 $30 $30 Total COGS $80 $100 $120 $140 $160 $235 $255 $275 $295 $277 $348 $364 Gross Profit $20 $185 $331 $460 $573 $616 $701 $773 $833 $920 $909 $944 Gross Margin 20% 65% 73% 77% 78% 72% 73% 74% 74% 77% 72% 72% Fixed Overheads Research & Development $0 $0 $0 $0 $0 $0 $50 $50 $50 $50 $50 $50 Marketing $10 $11 $12 $13 $15 $16 $18 $19 $21 $24 $26 $29 General & Administrative $100 $100 $100 $100 $100 $100 $100 $100 $100 $200 $200 $200 Total Fixed Overheads $110 $111 $112 $113 $115 $116 $168 $169 $171 $274 $276 $279 Total Costs $190 $211 $232 $253 $275 $351 $423 $444 $466 $551 $624 $643 Net Profit ($90) $74 $219 $347 $458 $500 $533 $603 $661 $647 $633 $666 Net Margin -90% 26% 49% 58% 63% 59% 56% 58% 59% 54% 50% 51% Cash Balance ($90) ($16) $203 $550 $1,008 $1,508 $2,041 $2,644 $3,306 $3,953 $4,586 $5,252 12
  • 13. 1 2 3 4 5 6 7 8 9 10 11 12 REVENUE Units 1 3 5 7 9 11 13 15 17 19 21 23 Price $100 $95 $90 $86 $81 $77 $74 $70 $66 $63 $60 $57 Total Revenue $100 $285 $451 $600 $733 $851 $956 $1,048 $1,128 $1,197 $1,257 $1,308 COSTS Cost of Goods Sold Raw Materials $10 $30 $50 $70 $90 $110 $130 $150 $170 $152 $168 $184 Direct Labor $50 $50 $50 $50 $50 $100 $100 $100 $100 $100 $150 $150 Facilities & Equipment $20 $20 $20 $20 $20 $25 $25 $25 $25 $25 $30 $30 Total COGS $80 $100 $120 $140 $160 $235 $255 $275 $295 $277 $348 $364 Gross Profit $20 $185 $331 $460 $573 $616 $701 $773 $833 $920 $909 $944 Gross Margin 20% 65% 73% 77% 78% 72% 73% 74% 74% 77% 72% 72% Fixed Overheads Research & Development $0 $0 $0 $0 $0 $0 $50 $50 $50 $50 $50 $50 Marketing $10 $11 $12 $13 $15 $16 $18 $19 $21 $24 $26 $29 General & Administrative $100 $100 $100 $100 $100 $100 $100 $100 $100 $200 $200 $200 Total Fixed Overheads $110 $111 $112 $113 $115 $116 $168 $169 $171 $274 $276 $279 Total Costs $190 $211 $232 $253 $275 $351 $423 $444 $466 $551 $624 $643 Net Profit ($90) $74 $219 $347 $458 $500 $533 $603 $661 $647 $633 $666 Net Margin -90% 26% 49% 58% 63% 59% 56% 58% 59% 54% 50% 51% Cash Balance ($90) ($16) $203 $550 $1,008 $1,508 $2,041 $2,644 $3,306 $3,953 $4,586 $5,252 How much investment capital is needed? 13
  • 14. Investors look for key metrics in a financial model • Cash Burn or Burn Rate • Revenues less costs • Know on monthly or quarterly basis • Runway • # of months operating at a loss before all cash is gone • Cash Flow Break Even • Point at which cash from revenues = or > Cash Burn • Cap Ex • Cash required to build the product, facility, PP&E Source: John Pimentel 14
  • 15. Modeling the costs of hiring is more art than science • A good estimate is $100,000 (fully burdened, including healthcare, payroll tax, etc.) per employee 15
  • 16. Discussion • Generate a rough financial model for your venture • Use sensitivity analysis to identify your key financial drivers 16
  • 17. Financial Modeling 2013-07-10 Bryan Guido Hassin Entrepreneur In Residence