Download to read offline


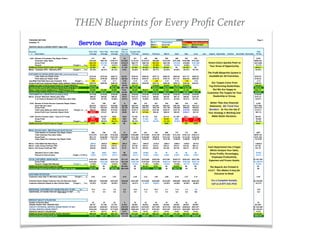


The document describes a profit blueprint system that helps businesses improve their net profit performance over time. It does this by taking a similar approach to how sports teams study game film and analyze their own and opponents' performances to identify areas for improvement. The system provides financial analysis reports with key metrics and targets to help businesses see if their strategies are working and make better decisions. It also offers phone coaching to provide proven ideas and best practices from top-performing companies.


