SlideShare a Scribd company logo
Net Income indicator
Cash Flow indicator
Q1 Q2 Q3 Q4 Q1 Q2
Unit Volume 3900 3900 3900 7800 7800 7800
Unit Price $20 $20 $20 $20 $20 $20
Cost per Unit Sold $0.03 $0.03 $0.03 $0.03 $0.03 $0.03
Gross Sales $78,000 $78,000 $78,000 $156,000 $156,000 $156,000
(Cost of Goods Sold) $117.00 $117.00 $117.00 $234.00 $234.00 $234.00
(Commission Percentage) 15% 15% 15% 15% 15% 15%
Net Sales $66,201 $66,201 $66,201 $132,401 $132,401 $132,401
Unit Volume 2730 2730 2730 5460 5460 5460
Unit Price $3 $3 $3 $4 $4 $4
Cost per Unit Sold $1 $1 $1 $1 $1 $1
Gross Sales $8,190 $8,190 $8,190 $19,110 $21,840 $21,840
Year Two
Sales Projections
Year One
Ticket Sales
Beverages
(Cost of Goods Sold) $2,730 $2,730 $2,730 $5,460 $5,460 $5,460
(Commission Percentage) 0% 0% 0% 0% 0% 0%
Net Sales $5,460 $5,460 $5,460 $13,650 $16,380 $16,380
Unit Volume 1170 1170 1170 2340 2340 2340
Unit Price $15 $15 $15 $15 $15 $18
Cost per Unit Sold $3.25 $3.25 $3.25 $3.25 $3.25 $3.25
Gross Sales $17,550 $17,550 $17,550 $35,100 $35,100 $42,120
(Cost of Goods Sold) $3,803 $3,803 $3,803 $7,605 $7,605 $7,605
(Commission Percentage) 50% 50% 50% 50% 50% 50%
Net Sales $6,874 $6,874 $6,874 $13,748 $13,748 $17,258
Total Unit Volume 7,800 7,800 7,800 15,600 15,600 15,600
Total Gross Sales $103,740 $103,740 $103,740 $210,210 $212,940 $219,960
(Total Cost of Goods Sold) $6,650 $6,650 $6,650 $13,299 $13,299 $13,299
(Total Commissions Paid) $18,556 $18,556 $18,556 $37,112 $37,112 $40,622
Total Net Sales $78,534 $78,534 $78,534 $159,799 $162,529 $166,039
Assumptions:
Merchanside (locked) 30% of ticket buyers buy merchandise
Beverages (changeable) 70% of ticket buyers buy an average of 1 beverages
Beverage Industry Average for U.S. Bar & Nightclub (estimate)
65% order drinks most to all the time with males ordering more frequently than females. Surprisingly, Millenni
http://www.nciaa.com/content.aspx?page_id=22&club_id=160641&module_id=29898
Total: All Products/Services
Merchandise
The average consumer order 2.3 drinks per occasion with males ordering more than females and Millennials ordering m
(803,390)
Year One Year Two 2-Year Total
Q3 Q4 Total Total 1 2
11700 11700 19,500 39,000 58,500 $668 $3,900
$20 $20 - - Q2 vs. Q1
$0.03 $0.03 - - 0%
$234,000 $234,000 $390,000 $780,000 $1,170,000
$351.00 $351.00 Sales growing over time?
15% 15% - - 200%
$198,602 $198,602 $331,003 $662,006 $993,008 points for this dynamic (allocatio
your growth points
8190 8190 13,650 27,300 40,950 Perfectly Exponential
$4 $5 - Perfectly Linear
$1 $1 - This Forecast
$32,760 $40,950 $43,680 $117,390 $161,070 As a proportion out of 100%
Year OneYear Two
FORECAST SUMMARY
$8,190 $8,190 points for this dynamic (allocatio
0% 0% - - - your growth points
$24,570 $32,760 $30,030 $90,090 $120,120
YOUR TOTAL POINTS %
Total Points Possible
3510 3510 5,850 11,700 17,550 Your Total Points
$20 $20 - - -
$3.25 $3.25 - - -
$70,200 $70,200 $87,750 $217,620 $305,370
$11,408 $11,408
50% 50% - - -
$29,396 $29,396 $34,369 $89,798 $124,166
23,400 23,400 39,000 78,000 117,000
$336,960 $345,150 $521,430 $1,115,010 $1,636,440
$19,949 $19,949 $33,248 $66,495 $99,743
$64,444 $64,444 $92,781 $206,622 $299,403
$252,568 $260,758 $395,402 $841,893 $1,237,295
rprisingly, Millennials order less frequently than older consumers
llennials ordering more than the older consumers.
3 4 5 6 7 8
slope
$3,900 $7,800 $7,800 $7,800 $11,700 $11,700 11032 7 1,576.00
Q3 vs. Q2 Q4 vs. Q3 Q1 vs. Q4 Q2 vs. Q1 Q3 vs. Q2 Q4 vs. Q3
0% 100% 0% 0% 50% 0%
LINEST SLOPE L/S
Sales growing over time? 1 1522.905 1,576 1
overall rate
oints for this dynamic (allocation) 25%
our growth points 25%
Perfectly Exponential L/S = 2
Perfectly Linear L/S = 1
his Forecast L/S = 0.97
As a proportion out of 100% 48%
Year One Year Two
oints for this dynamic (allocation) 75%
our growth points 36%
YOUR TOTAL POINTS % 61%
otal Points Possible 20
Your Total Points 12
Q1 Q2 Q3
Brochures, flyers, Mobile signs, bus/metro signs, billboards ba $400 $500 $500 $500
Samples, premiums, logo merchandise, "swag" pb
Print: newspaper, magazines ba $150 $150 $150 $150
Television, radio ba $250 $300 $300 $300
Television, radio pb $250 $300 $300 $300
Banner Ads, Paid Search Engine Marketing pb/ba $300 $300 $300 $350
Paid Facebook promotions, Twitter ads, Linkedin ads
Social media contests, Deal-of-the-day: Groupon, Google Offers, LivingSocial sp $150 $150 $150 $200
Tweetups, Meetups l&r $100 $100 $200 $200
Sticker bombing, flyposting, Flashmobs, streetart pb $300 $250 $250 $300
Street teams, campus promotions, Crowd-sourced ads l&r $15 $20 $20 $25
Marketing Budget
Purpose
(optonal)
Tangible Marketing
Media Advertising
Social Media Marketing
Guerilla & Viral Marketing
Networking & Client Development Activities
Purpose/Strategy Key: (Optional)
PB: Personal Branding
BA: Brand Awareness/Brand Building
SP: Product/Service Sampling, Trial
L&R: Brand Loyalty/Customer Rewards
Pre-Launch
Year One
Launch party, Memberships, meetings, Entertaining Clients l&r
Wrapped vehicles, food trucks, booths, exhibits, signs sp
Design, development, programming
Maintenance, hosting, domains
Marketing, Public Relations
Branding, Advertising
$1,915 $2,070 $2,170 $2,325
Trade Shows, Events, Street Promotions
Website
Professional Assistance & Consultants
TOTAL
Q4 Q1 Q2 Q3 Q4
$500 $750 $750 $750 $750 $5,400
$150 $150 $175 $175 $175 $1,425
$300 $400 $400 $400 $400 $3,050
$300 $400 $400 $400 $400 $3,050
$350 $350 $375 $375 $375 $3,075
$200 $200 $225 $225 $225 $1,725
$200 $250 $250 $250 $250 $1,800
$300 $325 $325 $350 $350 $2,750
$25 $30 $30 $40 $40 $245
Year Two
Total
One
$2,325 $2,855 $2,930 $2,965 $2,965 $22,520
Pre-Launch Year 1 Year 2
$14,984 $1,500 $1,500
$65,000 $2,000 $5,500
$220,000 $15,000 $24,500
$12,500 $975 $1,075
$24,500 $1,225 $1,225
$16,500 $8,800 $8,800
$353,484 $29,500 $42,600
Company Vehicles
Research and Development Costs
TOTAL
Capital Expenses
Capital Expenses
Office Equipment, Furniture, and Supplies
Remodeling Needs
Industry Specific Supplies and Technical
Equipment
Licensing Needs (liquor license etc)
2Live Venue
Pre-Launch Q1 Q2 Q3 Q4
$0 $78,534 $78,534 $78,534 $159,799
Capital expenses $353,484 $29,500 $0 $0 $0
Salaries and wages $84,067 $126,100 $126,100 $126,100 $126,100
Employee benefits $0 $0 $0 $0
Payroll taxes $12,610 $18,915 $18,915 $18,915 $18,915
Accounting Services $1,025 $1,025 $1,025 $1,025
Rent $8,000 $8,000 $8,000 $8,000
Maintenance $1,000 $1,000 $1,000 $1,000
Legal $9,000 $375 $375 $375 $375
Insurance $1,217 $1,825 $1,825 $1,825 $1,825
Utilities $1,000 $1,500 $1,700 $1,800 $1,500
Internet & public wifi $1,995 $175 $175 $175 $175
Telephone service $75 $75 $75 $75 $75
Filing fees $450
Postage and shipping $250
Marketing $1,915 $2,070 $2,170 $2,325 $2,325
Travel $2,500 $2,500 $2,500 $2,500 $2,500
Entertainment $3,500 $1,500 $1,500 $1,500 $1,500
Bank Fees $0
$472,062 $194,560 $165,360 $165,615 $165,315
Operating Profit (472,062) (116,026) (86,826) (87,081) (5,516)
Provision for taxes 0 0 0 0 0
INCOME (NET SALES)
EXPENSES
TOTAL EXPENSES
Income Statement
Year 1
(472,062) (116,026) (86,826) (87,081) (5,516)NET PROFIT
Year One Year Two
Quarter 1 Quarter 2 Quarter 3 Quarter 4 Y1 Total Y2 Total 2-Year Total
$162,529 $166,039 $252,568 $260,758 $395,402 $841,893 $1,237,295
$42,600 $0 $0 $0 $0 $42,600 $42,600
$157,625 $157,625 $157,625 $157,625 $504,400 $630,500 $1,134,900
$0 $0 $0 $0 $0 $0 $0
$23,644 $23,644 $23,644 $23,644 $75,660 $94,575 $170,235
$1,025 $1,025 $1,025 $1,025 $4,100 $4,100 $8,200
$8,000 $8,000 $8,000 $8,000 $32,000 $32,000 $64,000
$1,000 $1,000 $1,000 $1,000 $4,000 $4,000 $8,000
$375 $375 $375 $375 $1,500 $1,500 $3,000
$1,825 $1,825 $1,825 $1,825 $7,300 $7,300 $14,600
$1,500 $1,700 $1,800 $1,500 $6,500 $6,500 $13,000
$175 $175 $175 $175 $700 $700 $1,400
$75 $75 $75 $75 $300 $300 $600
$0 $0 $0
$0 $0 $0
$2,855 $2,930 $2,965 $2,965 $8,890 $11,715 $20,605
$10,000 $10,000 $10,000 $300 $10,000 $30,300 $40,300
$1,500 $1,500 $1,500 $1,500 $6,000 $6,000 $12,000
$0 $0 $0
$0 $0 $0
$0 $0 $0
$252,199 $209,874 $210,009 $200,009 $661,350 $829,490 $1,490,840
(89,670) (43,835) 42,559 60,749 (295,449) (30,197) $(325,646)
0 0 2,341 3,341 0 0 $0
Year Two
FORECAST SUMMARY
(89,670) (43,835) 40,218 57,408 (767,511) (35,879) (803,390)
Is this number positive?
Pre-Launch Q1 Q2 Q3 Q4
Starting Balance $0 $(603,562) $(720,594) $(810,673) $(902,656)
Cash Ins
Net sales $78,534 $78,534 $78,534 $159,799
Investments $1,000
Loans
Interest income $(1,006) $(1,201) $(1,351) $(1,504)
Owner contributions $7,500
TOTAL CASH INS $8,500 $77,528 $77,333 $77,183 $158,294
Cash Outs
Operating expenses $472,062 $194,560 $165,360 $165,615 $165,315
Loan payments
Tax payments $0 $0 $2,052 $3,551 $3,315
Contingency fund $140,000
Owner's draw (Entrepreneur)
Investor's draw
Other:
Other:
Other:
Other:
Other:
Other:
TOTAL CASH OUTS $612,062 $194,560 $167,412 $169,166 $168,630
Year 1
Cash Flow
CASH AT END OF MONTH (603,562) (720,594) (810,673) (902,656) (912,991)
Q1 Q2 Q3 Q4
$(912,991) $(1,006,294) $(1,107,217) $(1,072,797)
$162,529 $166,039 $252,568 $260,758
$(1,522) $(1,677) $(1,845) $(1,788)
$161,007 $164,361 $250,723 $258,970
$252,199 $209,874 $210,009 $200,009
$2,110 $5,411 $6,293 $7,457
$50,000 $50,000
$254,309 $265,285 $216,302 $257,466
Year 2
(1,006,294) (1,107,217) (1,072,797) (1,071,293)
Investment Amount ($) Equity Offered (%)
Private Investor $1,000 25%
Contribution Amount ($) Equity Retained (%)
Owner $7,500 75%
Total Capital Raised EQUITY OWNERSHIP
%
$1,000 25%
$7,500 75%
$8,500 100%
Outside Investors
Owners
TOTAL
Capital Investment
aka "Shark Tank" Page
Investor Name
Owner Name
TOTAL INVESTMENTS
The Total Investment Amount (Capital) should be
theamount of thelargest negative number on
your Cash Flow Statement (theamount of cash
you need to eliminateany and all negative cash
balances throughout thetwo years whileyour
business is breaking even.

More Related Content

What's hot

Swifton - The Capital Network - Financial Projections
Swifton - The Capital Network - Financial ProjectionsSwifton - The Capital Network - Financial Projections
Swifton - The Capital Network - Financial Projections
David Fogel
 
Swifton CFOs - McCarter English - Fin Proj 100511
Swifton CFOs - McCarter English - Fin Proj 100511Swifton CFOs - McCarter English - Fin Proj 100511
Swifton CFOs - McCarter English - Fin Proj 100511David Fogel
 
Government Spending and Revenue, 1792-2009
Government Spending and Revenue, 1792-2009Government Spending and Revenue, 1792-2009
Government Spending and Revenue, 1792-2009
Dan Ewert
 
RFM: A Cool Tool for Simple Analytics
RFM: A Cool Tool for Simple AnalyticsRFM: A Cool Tool for Simple Analytics
RFM: A Cool Tool for Simple Analytics
C.TRAC Inc.
 
Loan Interest Calculation
Loan Interest CalculationLoan Interest Calculation
Loan Interest Calculation
shangbaby
 
South Dakota Trade through Ports-to-Plains Region – 2004-2010
South Dakota Trade through Ports-to-Plains Region – 2004-2010South Dakota Trade through Ports-to-Plains Region – 2004-2010
South Dakota Trade through Ports-to-Plains Region – 2004-2010Ports-To-Plains Blog
 
Harvard Business Case - Super Project
Harvard Business Case - Super ProjectHarvard Business Case - Super Project
Harvard Business Case - Super Project
Kivanc Ozuolmez
 
Bond immunization
Bond immunizationBond immunization
Bond immunizationlala_k
 
Fvreb may 2020 stats
Fvreb may 2020 stats Fvreb may 2020 stats
Fvreb may 2020 stats
Vicky Aulakh
 
Netscape IPO - Harvard Business Case
Netscape IPO - Harvard Business CaseNetscape IPO - Harvard Business Case
Netscape IPO - Harvard Business Case
Kivanc Ozuolmez
 
FPS Video game event budget template
FPS Video game event budget templateFPS Video game event budget template
FPS Video game event budget template
AliDavid1998
 
Memo Case 2
Memo Case 2Memo Case 2
Memo Case 2
Nataliaivanov
 
Dec 2020 Fraser Valley Real Estate Board Package
Dec 2020 Fraser Valley Real Estate Board PackageDec 2020 Fraser Valley Real Estate Board Package
Dec 2020 Fraser Valley Real Estate Board Package
Vicky Aulakh
 
Looptworks case analysis
Looptworks case analysisLooptworks case analysis
Looptworks case analysisFred Wu
 
Mini Case2
Mini Case2Mini Case2
Mini Case2
Nataliaivanov
 
EBT and Matching Dollars
EBT and Matching DollarsEBT and Matching Dollars
EBT and Matching Dollars
Farmers' Market Management Network
 
Nebraska Trade through Ports-to-Plains Region – 2004-2010
Nebraska Trade through Ports-to-Plains Region – 2004-2010Nebraska Trade through Ports-to-Plains Region – 2004-2010
Nebraska Trade through Ports-to-Plains Region – 2004-2010Ports-To-Plains Blog
 
Revenue Forecasting PowerPoint Presentation Slides
Revenue Forecasting PowerPoint Presentation SlidesRevenue Forecasting PowerPoint Presentation Slides
Revenue Forecasting PowerPoint Presentation Slides
SlideTeam
 
North Vancouver Real Estate Statistics Nov 2015
North Vancouver Real Estate Statistics Nov 2015North Vancouver Real Estate Statistics Nov 2015
North Vancouver Real Estate Statistics Nov 2015
Phil LeGree
 

What's hot (20)

Swifton - The Capital Network - Financial Projections
Swifton - The Capital Network - Financial ProjectionsSwifton - The Capital Network - Financial Projections
Swifton - The Capital Network - Financial Projections
 
Swifton CFOs - McCarter English - Fin Proj 100511
Swifton CFOs - McCarter English - Fin Proj 100511Swifton CFOs - McCarter English - Fin Proj 100511
Swifton CFOs - McCarter English - Fin Proj 100511
 
Government Spending and Revenue, 1792-2009
Government Spending and Revenue, 1792-2009Government Spending and Revenue, 1792-2009
Government Spending and Revenue, 1792-2009
 
RFM: A Cool Tool for Simple Analytics
RFM: A Cool Tool for Simple AnalyticsRFM: A Cool Tool for Simple Analytics
RFM: A Cool Tool for Simple Analytics
 
Loan Interest Calculation
Loan Interest CalculationLoan Interest Calculation
Loan Interest Calculation
 
South Dakota Trade through Ports-to-Plains Region – 2004-2010
South Dakota Trade through Ports-to-Plains Region – 2004-2010South Dakota Trade through Ports-to-Plains Region – 2004-2010
South Dakota Trade through Ports-to-Plains Region – 2004-2010
 
Harvard Business Case - Super Project
Harvard Business Case - Super ProjectHarvard Business Case - Super Project
Harvard Business Case - Super Project
 
Bond immunization
Bond immunizationBond immunization
Bond immunization
 
Fvreb may 2020 stats
Fvreb may 2020 stats Fvreb may 2020 stats
Fvreb may 2020 stats
 
Netscape IPO - Harvard Business Case
Netscape IPO - Harvard Business CaseNetscape IPO - Harvard Business Case
Netscape IPO - Harvard Business Case
 
FPS Video game event budget template
FPS Video game event budget templateFPS Video game event budget template
FPS Video game event budget template
 
Memo Case 2
Memo Case 2Memo Case 2
Memo Case 2
 
Dec 2020 Fraser Valley Real Estate Board Package
Dec 2020 Fraser Valley Real Estate Board PackageDec 2020 Fraser Valley Real Estate Board Package
Dec 2020 Fraser Valley Real Estate Board Package
 
Metro Vancouver report
Metro Vancouver reportMetro Vancouver report
Metro Vancouver report
 
Looptworks case analysis
Looptworks case analysisLooptworks case analysis
Looptworks case analysis
 
Mini Case2
Mini Case2Mini Case2
Mini Case2
 
EBT and Matching Dollars
EBT and Matching DollarsEBT and Matching Dollars
EBT and Matching Dollars
 
Nebraska Trade through Ports-to-Plains Region – 2004-2010
Nebraska Trade through Ports-to-Plains Region – 2004-2010Nebraska Trade through Ports-to-Plains Region – 2004-2010
Nebraska Trade through Ports-to-Plains Region – 2004-2010
 
Revenue Forecasting PowerPoint Presentation Slides
Revenue Forecasting PowerPoint Presentation SlidesRevenue Forecasting PowerPoint Presentation Slides
Revenue Forecasting PowerPoint Presentation Slides
 
North Vancouver Real Estate Statistics Nov 2015
North Vancouver Real Estate Statistics Nov 2015North Vancouver Real Estate Statistics Nov 2015
North Vancouver Real Estate Statistics Nov 2015
 

Similar to Principals of Business Finance

Financial Forecasting
Financial ForecastingFinancial Forecasting
Financial Forecasting
AlayshaOrtiz1
 
Financial statements
Financial statementsFinancial statements
Financial statements
Britteny2
 
Financial Forecasting: Pro Forma Marketing Budget & Income Statement for a Li...
Financial Forecasting: Pro Forma Marketing Budget & Income Statement for a Li...Financial Forecasting: Pro Forma Marketing Budget & Income Statement for a Li...
Financial Forecasting: Pro Forma Marketing Budget & Income Statement for a Li...
Alexzandra Halbritter
 
Financial forecast diazcales-2
Financial forecast diazcales-2Financial forecast diazcales-2
Financial forecast diazcales-2
GerardoDiaz90
 
Financial Forecasting
Financial ForecastingFinancial Forecasting
Financial Forecasting
TravonnLee
 
AIA2019 - Rick Rasmussen - Startup Financials
AIA2019 - Rick Rasmussen - Startup FinancialsAIA2019 - Rick Rasmussen - Startup Financials
AIA2019 - Rick Rasmussen - Startup Financials
European Innovation Academy
 
Afternoon Sessions
Afternoon SessionsAfternoon Sessions
Afternoon Sessionsgmm0611
 
EIA2019Portugal - Building Your Financials - Rick Rasmussen
EIA2019Portugal - Building Your Financials - Rick RasmussenEIA2019Portugal - Building Your Financials - Rick Rasmussen
EIA2019Portugal - Building Your Financials - Rick Rasmussen
European Innovation Academy
 
Bootstrapping Entrepeneurs & Their Business Ppt
Bootstrapping Entrepeneurs & Their Business PptBootstrapping Entrepeneurs & Their Business Ppt
Bootstrapping Entrepeneurs & Their Business Ppt
Caroline Cummings
 
Best CaseIncome Statement (Unaudited)(for years ending September 1.docx
Best CaseIncome Statement (Unaudited)(for years ending September 1.docxBest CaseIncome Statement (Unaudited)(for years ending September 1.docx
Best CaseIncome Statement (Unaudited)(for years ending September 1.docx
AASTHA76
 
FSAE-A Business Presentation - Redback Racing 2017
FSAE-A Business Presentation - Redback Racing 2017FSAE-A Business Presentation - Redback Racing 2017
FSAE-A Business Presentation - Redback Racing 2017
Albert Chau
 
Budget Variance Analysis PowerPoint Presentation Slides
Budget Variance Analysis PowerPoint Presentation SlidesBudget Variance Analysis PowerPoint Presentation Slides
Budget Variance Analysis PowerPoint Presentation Slides
SlideTeam
 
Budget Projection PowerPoint Presentation Slides
Budget Projection PowerPoint Presentation SlidesBudget Projection PowerPoint Presentation Slides
Budget Projection PowerPoint Presentation Slides
SlideTeam
 
C3 comp redesign 6-3-13 (2)
C3 comp redesign  6-3-13 (2)C3 comp redesign  6-3-13 (2)
C3 comp redesign 6-3-13 (2)Mark Wolkove
 
Finance Budgeting Powerpoint Presentation Slides
Finance Budgeting Powerpoint Presentation SlidesFinance Budgeting Powerpoint Presentation Slides
Finance Budgeting Powerpoint Presentation Slides
SlideTeam
 
Finance Budgeting PowerPoint Presentation Slides
Finance Budgeting PowerPoint Presentation SlidesFinance Budgeting PowerPoint Presentation Slides
Finance Budgeting PowerPoint Presentation Slides
SlideTeam
 
Revenue Projection PowerPoint Presentation Slides
Revenue Projection PowerPoint Presentation SlidesRevenue Projection PowerPoint Presentation Slides
Revenue Projection PowerPoint Presentation Slides
SlideTeam
 
Startup Financial Modeling
Startup Financial ModelingStartup Financial Modeling
Startup Financial Modeling
Bryan Hassin
 

Similar to Principals of Business Finance (20)

Financial Forecasting
Financial ForecastingFinancial Forecasting
Financial Forecasting
 
Financial statements
Financial statementsFinancial statements
Financial statements
 
Financial Forecasting: Pro Forma Marketing Budget & Income Statement for a Li...
Financial Forecasting: Pro Forma Marketing Budget & Income Statement for a Li...Financial Forecasting: Pro Forma Marketing Budget & Income Statement for a Li...
Financial Forecasting: Pro Forma Marketing Budget & Income Statement for a Li...
 
Financial forecast diazcales-2
Financial forecast diazcales-2Financial forecast diazcales-2
Financial forecast diazcales-2
 
Financial Forecasting
Financial ForecastingFinancial Forecasting
Financial Forecasting
 
AIA2019 - Rick Rasmussen - Startup Financials
AIA2019 - Rick Rasmussen - Startup FinancialsAIA2019 - Rick Rasmussen - Startup Financials
AIA2019 - Rick Rasmussen - Startup Financials
 
Afternoon Sessions
Afternoon SessionsAfternoon Sessions
Afternoon Sessions
 
EIA2019Portugal - Building Your Financials - Rick Rasmussen
EIA2019Portugal - Building Your Financials - Rick RasmussenEIA2019Portugal - Building Your Financials - Rick Rasmussen
EIA2019Portugal - Building Your Financials - Rick Rasmussen
 
Bootstrapping Entrepeneurs & Their Business Ppt
Bootstrapping Entrepeneurs & Their Business PptBootstrapping Entrepeneurs & Their Business Ppt
Bootstrapping Entrepeneurs & Their Business Ppt
 
Best CaseIncome Statement (Unaudited)(for years ending September 1.docx
Best CaseIncome Statement (Unaudited)(for years ending September 1.docxBest CaseIncome Statement (Unaudited)(for years ending September 1.docx
Best CaseIncome Statement (Unaudited)(for years ending September 1.docx
 
FSAE-A Business Presentation - Redback Racing 2017
FSAE-A Business Presentation - Redback Racing 2017FSAE-A Business Presentation - Redback Racing 2017
FSAE-A Business Presentation - Redback Racing 2017
 
Budget Variance Analysis PowerPoint Presentation Slides
Budget Variance Analysis PowerPoint Presentation SlidesBudget Variance Analysis PowerPoint Presentation Slides
Budget Variance Analysis PowerPoint Presentation Slides
 
Budget Projection PowerPoint Presentation Slides
Budget Projection PowerPoint Presentation SlidesBudget Projection PowerPoint Presentation Slides
Budget Projection PowerPoint Presentation Slides
 
C3 comp redesign 6-3-13 (2)
C3 comp redesign  6-3-13 (2)C3 comp redesign  6-3-13 (2)
C3 comp redesign 6-3-13 (2)
 
Finance Budgeting Powerpoint Presentation Slides
Finance Budgeting Powerpoint Presentation SlidesFinance Budgeting Powerpoint Presentation Slides
Finance Budgeting Powerpoint Presentation Slides
 
Finance Budgeting PowerPoint Presentation Slides
Finance Budgeting PowerPoint Presentation SlidesFinance Budgeting PowerPoint Presentation Slides
Finance Budgeting PowerPoint Presentation Slides
 
Revenue Projection PowerPoint Presentation Slides
Revenue Projection PowerPoint Presentation SlidesRevenue Projection PowerPoint Presentation Slides
Revenue Projection PowerPoint Presentation Slides
 
Exhibits - Copy
Exhibits - CopyExhibits - Copy
Exhibits - Copy
 
-2015 projection sheet
-2015 projection sheet-2015 projection sheet
-2015 projection sheet
 
Startup Financial Modeling
Startup Financial ModelingStartup Financial Modeling
Startup Financial Modeling
 

More from Kathleen Boushele

Digital Release Strategy
Digital Release StrategyDigital Release Strategy
Digital Release Strategy
Kathleen Boushele
 
Professional Writing Proposal
Professional Writing ProposalProfessional Writing Proposal
Professional Writing Proposal
Kathleen Boushele
 
Artist, Audience and Analysis Project
Artist, Audience and Analysis ProjectArtist, Audience and Analysis Project
Artist, Audience and Analysis Project
Kathleen Boushele
 
Tamtheviibe Portfolio
Tamtheviibe PortfolioTamtheviibe Portfolio
Tamtheviibe Portfolio
Kathleen Boushele
 
Market Analysis Report
Market Analysis ReportMarket Analysis Report
Market Analysis Report
Kathleen Boushele
 
Remake Proposal
Remake ProposalRemake Proposal
Remake Proposal
Kathleen Boushele
 
Data Analysis and Reporting
Data Analysis and ReportingData Analysis and Reporting
Data Analysis and Reporting
Kathleen Boushele
 

More from Kathleen Boushele (7)

Digital Release Strategy
Digital Release StrategyDigital Release Strategy
Digital Release Strategy
 
Professional Writing Proposal
Professional Writing ProposalProfessional Writing Proposal
Professional Writing Proposal
 
Artist, Audience and Analysis Project
Artist, Audience and Analysis ProjectArtist, Audience and Analysis Project
Artist, Audience and Analysis Project
 
Tamtheviibe Portfolio
Tamtheviibe PortfolioTamtheviibe Portfolio
Tamtheviibe Portfolio
 
Market Analysis Report
Market Analysis ReportMarket Analysis Report
Market Analysis Report
 
Remake Proposal
Remake ProposalRemake Proposal
Remake Proposal
 
Data Analysis and Reporting
Data Analysis and ReportingData Analysis and Reporting
Data Analysis and Reporting
 

Recently uploaded

Meet Crazyjamjam - A TikTok Sensation | Blog Eternal
Meet Crazyjamjam - A TikTok Sensation | Blog EternalMeet Crazyjamjam - A TikTok Sensation | Blog Eternal
Meet Crazyjamjam - A TikTok Sensation | Blog Eternal
Blog Eternal
 
Treasure Hunt Puzzles, Treasure Hunt Puzzles online
Treasure Hunt Puzzles, Treasure Hunt Puzzles onlineTreasure Hunt Puzzles, Treasure Hunt Puzzles online
Treasure Hunt Puzzles, Treasure Hunt Puzzles online
Hidden Treasure Hunts
 
240529_Teleprotection Global Market Report 2024.pdf
240529_Teleprotection Global Market Report 2024.pdf240529_Teleprotection Global Market Report 2024.pdf
240529_Teleprotection Global Market Report 2024.pdf
Madhura TBRC
 
Reimagining Classics - What Makes a Remake a Success
Reimagining Classics - What Makes a Remake a SuccessReimagining Classics - What Makes a Remake a Success
Reimagining Classics - What Makes a Remake a Success
Mark Murphy Director
 
The Evolution of Animation in Film - Mark Murphy Director
The Evolution of Animation in Film - Mark Murphy DirectorThe Evolution of Animation in Film - Mark Murphy Director
The Evolution of Animation in Film - Mark Murphy Director
Mark Murphy Director
 
Christina's Baby Shower Game June 2024.pptx
Christina's Baby Shower Game June 2024.pptxChristina's Baby Shower Game June 2024.pptx
Christina's Baby Shower Game June 2024.pptx
madeline604788
 
From Slave to Scourge: The Existential Choice of Django Unchained. The Philos...
From Slave to Scourge: The Existential Choice of Django Unchained. The Philos...From Slave to Scourge: The Existential Choice of Django Unchained. The Philos...
From Slave to Scourge: The Existential Choice of Django Unchained. The Philos...
Rodney Thomas Jr
 
A TO Z INDIA Monthly Magazine - JUNE 2024
A TO Z INDIA Monthly Magazine - JUNE 2024A TO Z INDIA Monthly Magazine - JUNE 2024
A TO Z INDIA Monthly Magazine - JUNE 2024
Indira Srivatsa
 
Tom Selleck Net Worth: A Comprehensive Analysis
Tom Selleck Net Worth: A Comprehensive AnalysisTom Selleck Net Worth: A Comprehensive Analysis
Tom Selleck Net Worth: A Comprehensive Analysis
greendigital
 
Scandal! Teasers June 2024 on etv Forum.co.za
Scandal! Teasers June 2024 on etv Forum.co.zaScandal! Teasers June 2024 on etv Forum.co.za
Scandal! Teasers June 2024 on etv Forum.co.za
Isaac More
 
Create a Seamless Viewing Experience with Your Own Custom OTT Player.pdf
Create a Seamless Viewing Experience with Your Own Custom OTT Player.pdfCreate a Seamless Viewing Experience with Your Own Custom OTT Player.pdf
Create a Seamless Viewing Experience with Your Own Custom OTT Player.pdf
Genny Knight
 
Meet Dinah Mattingly – Larry Bird’s Partner in Life and Love
Meet Dinah Mattingly – Larry Bird’s Partner in Life and LoveMeet Dinah Mattingly – Larry Bird’s Partner in Life and Love
Meet Dinah Mattingly – Larry Bird’s Partner in Life and Love
get joys
 
This Is The First All Category Quiz That I Made
This Is The First All Category Quiz That I MadeThis Is The First All Category Quiz That I Made
This Is The First All Category Quiz That I Made
Aarush Ghate
 
Skeem Saam in June 2024 available on Forum
Skeem Saam in June 2024 available on ForumSkeem Saam in June 2024 available on Forum
Skeem Saam in June 2024 available on Forum
Isaac More
 
Panchayat Season 3 - Official Trailer.pdf
Panchayat Season 3 - Official Trailer.pdfPanchayat Season 3 - Official Trailer.pdf
Panchayat Season 3 - Official Trailer.pdf
Suleman Rana
 
Maximizing Your Streaming Experience with XCIPTV- Tips for 2024.pdf
Maximizing Your Streaming Experience with XCIPTV- Tips for 2024.pdfMaximizing Your Streaming Experience with XCIPTV- Tips for 2024.pdf
Maximizing Your Streaming Experience with XCIPTV- Tips for 2024.pdf
Xtreame HDTV
 
I Know Dino Trivia: Part 3. Test your dino knowledge
I Know Dino Trivia: Part 3. Test your dino knowledgeI Know Dino Trivia: Part 3. Test your dino knowledge
I Know Dino Trivia: Part 3. Test your dino knowledge
Sabrina Ricci
 
Young Tom Selleck: A Journey Through His Early Years and Rise to Stardom
Young Tom Selleck: A Journey Through His Early Years and Rise to StardomYoung Tom Selleck: A Journey Through His Early Years and Rise to Stardom
Young Tom Selleck: A Journey Through His Early Years and Rise to Stardom
greendigital
 
Hollywood Actress - The 250 hottest gallery
Hollywood Actress - The 250 hottest galleryHollywood Actress - The 250 hottest gallery
Hollywood Actress - The 250 hottest gallery
Zsolt Nemeth
 

Recently uploaded (19)

Meet Crazyjamjam - A TikTok Sensation | Blog Eternal
Meet Crazyjamjam - A TikTok Sensation | Blog EternalMeet Crazyjamjam - A TikTok Sensation | Blog Eternal
Meet Crazyjamjam - A TikTok Sensation | Blog Eternal
 
Treasure Hunt Puzzles, Treasure Hunt Puzzles online
Treasure Hunt Puzzles, Treasure Hunt Puzzles onlineTreasure Hunt Puzzles, Treasure Hunt Puzzles online
Treasure Hunt Puzzles, Treasure Hunt Puzzles online
 
240529_Teleprotection Global Market Report 2024.pdf
240529_Teleprotection Global Market Report 2024.pdf240529_Teleprotection Global Market Report 2024.pdf
240529_Teleprotection Global Market Report 2024.pdf
 
Reimagining Classics - What Makes a Remake a Success
Reimagining Classics - What Makes a Remake a SuccessReimagining Classics - What Makes a Remake a Success
Reimagining Classics - What Makes a Remake a Success
 
The Evolution of Animation in Film - Mark Murphy Director
The Evolution of Animation in Film - Mark Murphy DirectorThe Evolution of Animation in Film - Mark Murphy Director
The Evolution of Animation in Film - Mark Murphy Director
 
Christina's Baby Shower Game June 2024.pptx
Christina's Baby Shower Game June 2024.pptxChristina's Baby Shower Game June 2024.pptx
Christina's Baby Shower Game June 2024.pptx
 
From Slave to Scourge: The Existential Choice of Django Unchained. The Philos...
From Slave to Scourge: The Existential Choice of Django Unchained. The Philos...From Slave to Scourge: The Existential Choice of Django Unchained. The Philos...
From Slave to Scourge: The Existential Choice of Django Unchained. The Philos...
 
A TO Z INDIA Monthly Magazine - JUNE 2024
A TO Z INDIA Monthly Magazine - JUNE 2024A TO Z INDIA Monthly Magazine - JUNE 2024
A TO Z INDIA Monthly Magazine - JUNE 2024
 
Tom Selleck Net Worth: A Comprehensive Analysis
Tom Selleck Net Worth: A Comprehensive AnalysisTom Selleck Net Worth: A Comprehensive Analysis
Tom Selleck Net Worth: A Comprehensive Analysis
 
Scandal! Teasers June 2024 on etv Forum.co.za
Scandal! Teasers June 2024 on etv Forum.co.zaScandal! Teasers June 2024 on etv Forum.co.za
Scandal! Teasers June 2024 on etv Forum.co.za
 
Create a Seamless Viewing Experience with Your Own Custom OTT Player.pdf
Create a Seamless Viewing Experience with Your Own Custom OTT Player.pdfCreate a Seamless Viewing Experience with Your Own Custom OTT Player.pdf
Create a Seamless Viewing Experience with Your Own Custom OTT Player.pdf
 
Meet Dinah Mattingly – Larry Bird’s Partner in Life and Love
Meet Dinah Mattingly – Larry Bird’s Partner in Life and LoveMeet Dinah Mattingly – Larry Bird’s Partner in Life and Love
Meet Dinah Mattingly – Larry Bird’s Partner in Life and Love
 
This Is The First All Category Quiz That I Made
This Is The First All Category Quiz That I MadeThis Is The First All Category Quiz That I Made
This Is The First All Category Quiz That I Made
 
Skeem Saam in June 2024 available on Forum
Skeem Saam in June 2024 available on ForumSkeem Saam in June 2024 available on Forum
Skeem Saam in June 2024 available on Forum
 
Panchayat Season 3 - Official Trailer.pdf
Panchayat Season 3 - Official Trailer.pdfPanchayat Season 3 - Official Trailer.pdf
Panchayat Season 3 - Official Trailer.pdf
 
Maximizing Your Streaming Experience with XCIPTV- Tips for 2024.pdf
Maximizing Your Streaming Experience with XCIPTV- Tips for 2024.pdfMaximizing Your Streaming Experience with XCIPTV- Tips for 2024.pdf
Maximizing Your Streaming Experience with XCIPTV- Tips for 2024.pdf
 
I Know Dino Trivia: Part 3. Test your dino knowledge
I Know Dino Trivia: Part 3. Test your dino knowledgeI Know Dino Trivia: Part 3. Test your dino knowledge
I Know Dino Trivia: Part 3. Test your dino knowledge
 
Young Tom Selleck: A Journey Through His Early Years and Rise to Stardom
Young Tom Selleck: A Journey Through His Early Years and Rise to StardomYoung Tom Selleck: A Journey Through His Early Years and Rise to Stardom
Young Tom Selleck: A Journey Through His Early Years and Rise to Stardom
 
Hollywood Actress - The 250 hottest gallery
Hollywood Actress - The 250 hottest galleryHollywood Actress - The 250 hottest gallery
Hollywood Actress - The 250 hottest gallery
 

Principals of Business Finance

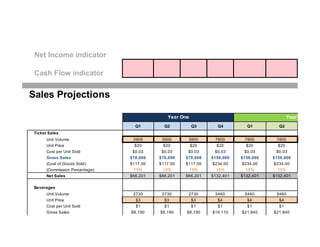
  • 1. Net Income indicator Cash Flow indicator Q1 Q2 Q3 Q4 Q1 Q2 Unit Volume 3900 3900 3900 7800 7800 7800 Unit Price $20 $20 $20 $20 $20 $20 Cost per Unit Sold $0.03 $0.03 $0.03 $0.03 $0.03 $0.03 Gross Sales $78,000 $78,000 $78,000 $156,000 $156,000 $156,000 (Cost of Goods Sold) $117.00 $117.00 $117.00 $234.00 $234.00 $234.00 (Commission Percentage) 15% 15% 15% 15% 15% 15% Net Sales $66,201 $66,201 $66,201 $132,401 $132,401 $132,401 Unit Volume 2730 2730 2730 5460 5460 5460 Unit Price $3 $3 $3 $4 $4 $4 Cost per Unit Sold $1 $1 $1 $1 $1 $1 Gross Sales $8,190 $8,190 $8,190 $19,110 $21,840 $21,840 Year Two Sales Projections Year One Ticket Sales Beverages
  • 2. (Cost of Goods Sold) $2,730 $2,730 $2,730 $5,460 $5,460 $5,460 (Commission Percentage) 0% 0% 0% 0% 0% 0% Net Sales $5,460 $5,460 $5,460 $13,650 $16,380 $16,380 Unit Volume 1170 1170 1170 2340 2340 2340 Unit Price $15 $15 $15 $15 $15 $18 Cost per Unit Sold $3.25 $3.25 $3.25 $3.25 $3.25 $3.25 Gross Sales $17,550 $17,550 $17,550 $35,100 $35,100 $42,120 (Cost of Goods Sold) $3,803 $3,803 $3,803 $7,605 $7,605 $7,605 (Commission Percentage) 50% 50% 50% 50% 50% 50% Net Sales $6,874 $6,874 $6,874 $13,748 $13,748 $17,258 Total Unit Volume 7,800 7,800 7,800 15,600 15,600 15,600 Total Gross Sales $103,740 $103,740 $103,740 $210,210 $212,940 $219,960 (Total Cost of Goods Sold) $6,650 $6,650 $6,650 $13,299 $13,299 $13,299 (Total Commissions Paid) $18,556 $18,556 $18,556 $37,112 $37,112 $40,622 Total Net Sales $78,534 $78,534 $78,534 $159,799 $162,529 $166,039 Assumptions: Merchanside (locked) 30% of ticket buyers buy merchandise Beverages (changeable) 70% of ticket buyers buy an average of 1 beverages Beverage Industry Average for U.S. Bar & Nightclub (estimate) 65% order drinks most to all the time with males ordering more frequently than females. Surprisingly, Millenni http://www.nciaa.com/content.aspx?page_id=22&club_id=160641&module_id=29898 Total: All Products/Services Merchandise
  • 3. The average consumer order 2.3 drinks per occasion with males ordering more than females and Millennials ordering m
  • 4. (803,390) Year One Year Two 2-Year Total Q3 Q4 Total Total 1 2 11700 11700 19,500 39,000 58,500 $668 $3,900 $20 $20 - - Q2 vs. Q1 $0.03 $0.03 - - 0% $234,000 $234,000 $390,000 $780,000 $1,170,000 $351.00 $351.00 Sales growing over time? 15% 15% - - 200% $198,602 $198,602 $331,003 $662,006 $993,008 points for this dynamic (allocatio your growth points 8190 8190 13,650 27,300 40,950 Perfectly Exponential $4 $5 - Perfectly Linear $1 $1 - This Forecast $32,760 $40,950 $43,680 $117,390 $161,070 As a proportion out of 100% Year OneYear Two FORECAST SUMMARY
  • 5. $8,190 $8,190 points for this dynamic (allocatio 0% 0% - - - your growth points $24,570 $32,760 $30,030 $90,090 $120,120 YOUR TOTAL POINTS % Total Points Possible 3510 3510 5,850 11,700 17,550 Your Total Points $20 $20 - - - $3.25 $3.25 - - - $70,200 $70,200 $87,750 $217,620 $305,370 $11,408 $11,408 50% 50% - - - $29,396 $29,396 $34,369 $89,798 $124,166 23,400 23,400 39,000 78,000 117,000 $336,960 $345,150 $521,430 $1,115,010 $1,636,440 $19,949 $19,949 $33,248 $66,495 $99,743 $64,444 $64,444 $92,781 $206,622 $299,403 $252,568 $260,758 $395,402 $841,893 $1,237,295 rprisingly, Millennials order less frequently than older consumers
  • 6. llennials ordering more than the older consumers.
  • 7. 3 4 5 6 7 8 slope $3,900 $7,800 $7,800 $7,800 $11,700 $11,700 11032 7 1,576.00 Q3 vs. Q2 Q4 vs. Q3 Q1 vs. Q4 Q2 vs. Q1 Q3 vs. Q2 Q4 vs. Q3 0% 100% 0% 0% 50% 0% LINEST SLOPE L/S Sales growing over time? 1 1522.905 1,576 1 overall rate oints for this dynamic (allocation) 25% our growth points 25% Perfectly Exponential L/S = 2 Perfectly Linear L/S = 1 his Forecast L/S = 0.97 As a proportion out of 100% 48% Year One Year Two
  • 8. oints for this dynamic (allocation) 75% our growth points 36% YOUR TOTAL POINTS % 61% otal Points Possible 20 Your Total Points 12
  • 9.
  • 10. Q1 Q2 Q3 Brochures, flyers, Mobile signs, bus/metro signs, billboards ba $400 $500 $500 $500 Samples, premiums, logo merchandise, "swag" pb Print: newspaper, magazines ba $150 $150 $150 $150 Television, radio ba $250 $300 $300 $300 Television, radio pb $250 $300 $300 $300 Banner Ads, Paid Search Engine Marketing pb/ba $300 $300 $300 $350 Paid Facebook promotions, Twitter ads, Linkedin ads Social media contests, Deal-of-the-day: Groupon, Google Offers, LivingSocial sp $150 $150 $150 $200 Tweetups, Meetups l&r $100 $100 $200 $200 Sticker bombing, flyposting, Flashmobs, streetart pb $300 $250 $250 $300 Street teams, campus promotions, Crowd-sourced ads l&r $15 $20 $20 $25 Marketing Budget Purpose (optonal) Tangible Marketing Media Advertising Social Media Marketing Guerilla & Viral Marketing Networking & Client Development Activities Purpose/Strategy Key: (Optional) PB: Personal Branding BA: Brand Awareness/Brand Building SP: Product/Service Sampling, Trial L&R: Brand Loyalty/Customer Rewards Pre-Launch Year One
  • 11. Launch party, Memberships, meetings, Entertaining Clients l&r Wrapped vehicles, food trucks, booths, exhibits, signs sp Design, development, programming Maintenance, hosting, domains Marketing, Public Relations Branding, Advertising $1,915 $2,070 $2,170 $2,325 Trade Shows, Events, Street Promotions Website Professional Assistance & Consultants TOTAL
  • 12. Q4 Q1 Q2 Q3 Q4 $500 $750 $750 $750 $750 $5,400 $150 $150 $175 $175 $175 $1,425 $300 $400 $400 $400 $400 $3,050 $300 $400 $400 $400 $400 $3,050 $350 $350 $375 $375 $375 $3,075 $200 $200 $225 $225 $225 $1,725 $200 $250 $250 $250 $250 $1,800 $300 $325 $325 $350 $350 $2,750 $25 $30 $30 $40 $40 $245 Year Two Total One
  • 13. $2,325 $2,855 $2,930 $2,965 $2,965 $22,520
  • 14. Pre-Launch Year 1 Year 2 $14,984 $1,500 $1,500 $65,000 $2,000 $5,500 $220,000 $15,000 $24,500 $12,500 $975 $1,075 $24,500 $1,225 $1,225 $16,500 $8,800 $8,800 $353,484 $29,500 $42,600 Company Vehicles Research and Development Costs TOTAL Capital Expenses Capital Expenses Office Equipment, Furniture, and Supplies Remodeling Needs Industry Specific Supplies and Technical Equipment Licensing Needs (liquor license etc)
  • 15. 2Live Venue Pre-Launch Q1 Q2 Q3 Q4 $0 $78,534 $78,534 $78,534 $159,799 Capital expenses $353,484 $29,500 $0 $0 $0 Salaries and wages $84,067 $126,100 $126,100 $126,100 $126,100 Employee benefits $0 $0 $0 $0 Payroll taxes $12,610 $18,915 $18,915 $18,915 $18,915 Accounting Services $1,025 $1,025 $1,025 $1,025 Rent $8,000 $8,000 $8,000 $8,000 Maintenance $1,000 $1,000 $1,000 $1,000 Legal $9,000 $375 $375 $375 $375 Insurance $1,217 $1,825 $1,825 $1,825 $1,825 Utilities $1,000 $1,500 $1,700 $1,800 $1,500 Internet & public wifi $1,995 $175 $175 $175 $175 Telephone service $75 $75 $75 $75 $75 Filing fees $450 Postage and shipping $250 Marketing $1,915 $2,070 $2,170 $2,325 $2,325 Travel $2,500 $2,500 $2,500 $2,500 $2,500 Entertainment $3,500 $1,500 $1,500 $1,500 $1,500 Bank Fees $0 $472,062 $194,560 $165,360 $165,615 $165,315 Operating Profit (472,062) (116,026) (86,826) (87,081) (5,516) Provision for taxes 0 0 0 0 0 INCOME (NET SALES) EXPENSES TOTAL EXPENSES Income Statement Year 1
  • 16. (472,062) (116,026) (86,826) (87,081) (5,516)NET PROFIT
  • 17. Year One Year Two Quarter 1 Quarter 2 Quarter 3 Quarter 4 Y1 Total Y2 Total 2-Year Total $162,529 $166,039 $252,568 $260,758 $395,402 $841,893 $1,237,295 $42,600 $0 $0 $0 $0 $42,600 $42,600 $157,625 $157,625 $157,625 $157,625 $504,400 $630,500 $1,134,900 $0 $0 $0 $0 $0 $0 $0 $23,644 $23,644 $23,644 $23,644 $75,660 $94,575 $170,235 $1,025 $1,025 $1,025 $1,025 $4,100 $4,100 $8,200 $8,000 $8,000 $8,000 $8,000 $32,000 $32,000 $64,000 $1,000 $1,000 $1,000 $1,000 $4,000 $4,000 $8,000 $375 $375 $375 $375 $1,500 $1,500 $3,000 $1,825 $1,825 $1,825 $1,825 $7,300 $7,300 $14,600 $1,500 $1,700 $1,800 $1,500 $6,500 $6,500 $13,000 $175 $175 $175 $175 $700 $700 $1,400 $75 $75 $75 $75 $300 $300 $600 $0 $0 $0 $0 $0 $0 $2,855 $2,930 $2,965 $2,965 $8,890 $11,715 $20,605 $10,000 $10,000 $10,000 $300 $10,000 $30,300 $40,300 $1,500 $1,500 $1,500 $1,500 $6,000 $6,000 $12,000 $0 $0 $0 $0 $0 $0 $0 $0 $0 $252,199 $209,874 $210,009 $200,009 $661,350 $829,490 $1,490,840 (89,670) (43,835) 42,559 60,749 (295,449) (30,197) $(325,646) 0 0 2,341 3,341 0 0 $0 Year Two FORECAST SUMMARY
  • 18. (89,670) (43,835) 40,218 57,408 (767,511) (35,879) (803,390) Is this number positive?
  • 19. Pre-Launch Q1 Q2 Q3 Q4 Starting Balance $0 $(603,562) $(720,594) $(810,673) $(902,656) Cash Ins Net sales $78,534 $78,534 $78,534 $159,799 Investments $1,000 Loans Interest income $(1,006) $(1,201) $(1,351) $(1,504) Owner contributions $7,500 TOTAL CASH INS $8,500 $77,528 $77,333 $77,183 $158,294 Cash Outs Operating expenses $472,062 $194,560 $165,360 $165,615 $165,315 Loan payments Tax payments $0 $0 $2,052 $3,551 $3,315 Contingency fund $140,000 Owner's draw (Entrepreneur) Investor's draw Other: Other: Other: Other: Other: Other: TOTAL CASH OUTS $612,062 $194,560 $167,412 $169,166 $168,630 Year 1 Cash Flow
  • 20. CASH AT END OF MONTH (603,562) (720,594) (810,673) (902,656) (912,991)
  • 21. Q1 Q2 Q3 Q4 $(912,991) $(1,006,294) $(1,107,217) $(1,072,797) $162,529 $166,039 $252,568 $260,758 $(1,522) $(1,677) $(1,845) $(1,788) $161,007 $164,361 $250,723 $258,970 $252,199 $209,874 $210,009 $200,009 $2,110 $5,411 $6,293 $7,457 $50,000 $50,000 $254,309 $265,285 $216,302 $257,466 Year 2
  • 23. Investment Amount ($) Equity Offered (%) Private Investor $1,000 25% Contribution Amount ($) Equity Retained (%) Owner $7,500 75% Total Capital Raised EQUITY OWNERSHIP % $1,000 25% $7,500 75% $8,500 100% Outside Investors Owners TOTAL Capital Investment aka "Shark Tank" Page Investor Name Owner Name TOTAL INVESTMENTS The Total Investment Amount (Capital) should be theamount of thelargest negative number on your Cash Flow Statement (theamount of cash you need to eliminateany and all negative cash balances throughout thetwo years whileyour business is breaking even.