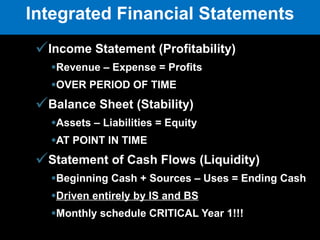
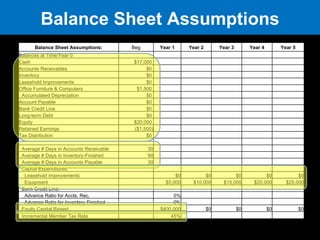
Networking Lunch Return 1:00 pm
James Randall,  Director of Enterprise Services Putting Dollars & Sense into your Plan Integrated Financial Statements INNOVATION TO ENTERPRISE
Do you know how profitable your products  and services really are? Do you have enough cash to make payroll? Do you know your monthly burn rate? Do you know when you expect to reach cash  flow breakeven?  (Wrong…add 6 months!) Do you know how much capital is really  needed and when? Questions?
Business & Capital Lifecycle Valley of Death Investigation Feasibility Development Introduction Growth Maturity Proof of concept SEED Start up Early  First, Second, etc. Friends,  Founders, Family Angels,  Grants, Bootstrap Venture Capital Equity Markets, Banks
Without Integrated Financials… Virtually impossible to cross the  Valley of Death Virtually impossible to raise capital from Investors START-UP FACTS OF LIFE
Income Statement (Profitability) Revenue – Expense = Profits OVER PERIOD OF TIME Balance Sheet (Stability) Assets – Liabilities = Equity AT POINT IN TIME Statement of Cash Flows (Liquidity) Beginning Cash + Sources – Uses = Ending Cash Driven entirely by IS and BS Monthly schedule CRITICAL Year 1!!! Integrated Financial Statements
10. Not understanding revenue drivers 9. Using top down revenue forecasting 8. Underestimating sales cycle 7. Underestimating operating costs 6. Static assumptions as business scales 5. Underestimating Working Capital needs 4. Underestimating time to secure financing 3. Financials do not reflect business plan 2. For LLCs, no allowance for tax distributions 1. Balance Sheet does not balance! Common Mistakes
Minimum 3 years, 5 years ideally Monthly for 1 st  year (Valley of Death!) Valid assumptions critical Executive Summary and Investor Presentation Summarized Income Statement only Business Plan (2 pages maximum) Detailed Income Statement Detailed Balance Sheet Detailed Statement of Cash Flows Recommended Format
Income Statement Assumptions
Staffing Plan Assumptions Staffing Plan Annual Comp Year 1 Year 2 Year 3 Year 4 Year 5 President $90,000  0.5  1  1  1  1  VP Sales & Marketing $70,000  1  1  1  1  1  Shipping/Inventory Control (1:25,000 Units)  $24,000  1  4  12  18  24  Sales Professionals $50,000  -  2  4  6  10  CFO/Controller $75,000  -  1  1  1  1  Accountant $40,000  -  1  1  1  1  VP Engineering & Operations $70,000  -  1  1  1  1  IT Manager $60,000  -  -  1  1  1  HR Manager $60,000  -  -  1  1  1  Total # Employees 3  11  20  28  38      Employee Taxes & Benefits 28%   Annual Cost of Living Adjustments 3%          
Operating Expense Assumptions Sales & Marketing Expenses Year 1 Year 2 Year 3 Year 4 Year 5 # Trade Shows/Year -  3  4  4  4  Cost/Trade Show $5,000    Marketing Materials $12,000  $50,000  $150,000  $200,000  $500,000  Advertising Exp. (% Sales) 3.0%   Travel Expense/Trade Show $2,500   Monthly Travel Expense/Sales Professional $1,500   Sales Commission 5%       Development Expenses   Product Development & Testing $180,000 $100,000 $50,000 $60,000 $50,000 Regulatory Requirements $80,000  $12,000  $12,000  $24,000  $24,000  Web Development & Hosting $6,000  $18,000  $36,000  $36,000  $48,000      General & Administrative Expenses   Travel Expense/Executive/Year $2,000   Telephone-Base 800 Service $1,800    Telephone-Variable 1.0%   Warehouse Rent/Year $12,000 $12,000 $72,000 $72,000 $72,000 Office Rent/Employee $1,440   Insurance-General (% Rev.) 1.0%   Insurance-Product Liability (% Rev.) 5.0%   Outside Accounting $6,000 $12,000 $24,000 $24,000 $24,000 Outside Legal $12,000 $25,000 $50,000 $50,000 $50,000
EZ Vein Income Statement Proforma Income Statement   Year 1 Year 2 Year 3 Year 4 Year 5 Revenues:   EZ Vein Revenue $250,000 $2,700,000 $8,700,000 $13,500,000 $18,000,000 Freight/Shipping Revenue $20,000 $200,000 $600,000 $900,000 $1,200,000 Total Revenues $270,000 $2,900,000 $9,300,000 $14,400,000 $19,200,000     Cost of Good Sold $60,000 $550,000 $1,500,000 $2,137,500 $2,700,000 Freight/Shipping Expenses $10,000 $100,000 $300,000 $450,000 $600,000     Gross Profit $200,000 $2,250,000 $7,500,000 $11,812,500 $15,900,000 Gross Profit Margin 74% 78% 81% 82% 83%     Operating Expenses:   Salaries $139,000 $557,230 $1,011,038 $1,307,994 $1,734,409 Employee Taxes & Benefits $38,920 $156,024 $283,091 $366,238 $485,635 Sales Commissions $12,500 $135,000 $435,000 $675,000 $900,000 Marketing Expenses $12,000 $65,000 $170,000 $220,000 $520,000 Advertising Expenses $7,500 $81,000 $261,000 $405,000 $540,000 Product Development & Testing $180,000 $100,000 $50,000 $60,000 $50,000 Regulatory Expenses $80,000 $12,000 $12,000 $24,000 $24,000 Internet/Website Expenses $6,000 $18,000 $36,000 $36,000 $48,000 Travel Expenses $3,000 $47,500 $86,000 $122,000 $194,000 Telephone Expenses $4,300 $28,800 $88,800 $136,800 $181,800 Rent Expense $15,600 $27,840 $100,800 $112,320 $126,720 Insurance Expenses $15,000 $162,000 $522,000 $810,000 $1,080,000 Accounting  $6,000 $12,000 $24,000 $24,000 $24,000 Legal $12,000 $25,000 $50,000 $50,000 $50,000 Total Operating Expenses $531,820 $1,427,394 $3,129,728 $4,349,353 $5,958,564     EBITDA ($331,820) $822,606  $4,370,272  $7,463,147  $9,941,436  Operating Profit Margin -123% 28% 47% 52% 52%
Balance Sheet Assumptions Balance Sheet Assumptions: Beg Year 1 Year 2 Year 3 Year 4 Year 5 Balances at Time/Year 0   Cash $17,000    Accounts Receivables $0    Inventory $0    Leasehold Improvements $0    Office Furniture & Computers $1,500    Accumulated Depreciation $0    Account Payable $0    Bank Credit Line $0    Long-term Debt $0    Equity $20,000    Retained Earnings ($1,500)   Tax Distribution $0        Average # Days in Accounts Receivable 30   Average # Days in Inventory-Finished 90   Average # Days in Accounts Payable 30   Capital Expenditures:   Leasehold Improvements $0 $0 $0 $0 $0 Equipment $5,000 $10,000 $15,000 $20,000 $25,000 Bank Credit Line:   Advance Ratio for Accts. Rec. 0%   Advance Ratio for Inventory-Finished 0%   Equity Capital Raised $400,000 $0 $0 $0 $0 Incremental Member Tax Rate   45%        
EZ Vein Balance Sheet Proforma Balance Sheet   Beg. Year 1 Year 2 Year 3 Year 4 Year 5 Cash $17,000 $47,680  $189,280  $1,886,263  $5,439,744  $10,388,784  Accounts Receivables $0 $22,500  $241,667  $775,000  $1,200,000  $1,600,000  Inventory $0 $15,000  $137,500  $375,000  $534,375  $675,000  Total Current Assets $17,000 $85,180  $568,446  $3,036,263  $7,174,119  $12,663,784      Leasehold Improvements $0 $0  $0  $0  $0  $0  Office Furniture & Computers $1,500 $6,500  $16,500  $31,500  $51,500  $76,500  Accumulated Depreciation $0 $0  $0  $0  $0  $0  Net PP&E $1,500 $6,500  $16,500  $31,500  $51,500  $76,500      Total Assets $18,500 $91,680  $584,946  $3,067,763  $7,225,619  $12,740,284      Account Payable $0 $5,000  $45,833  $125,000  $178,125  $225,000  Bank Credit Line $0 $0  $0  $0  $0  $0  Total Current Liabilities $0 $5,000  $45,833  $125,000  $178,125  $225,000      Long-term Debt $0 $0  $0  $0  $0  $0  Total Liabilities $0 $5,000  $45,833  $125,000  $178,125  $225,000      Equity $20,000 $420,000  $420,000  $420,000  $420,000  $420,000  Retained Earnings -$1,500 ($333,320) $489,286  $4,859,557  $12,322,705  $22,264,141  Tax Distribution $0 $0  ($370,173) ($2,336,795) ($5,695,211) ($10,168,858) Total Equity $18,500 $86,680 $539,113 $2,942,763 $7,047,494 $12,515,284     Total Liabilities & Equity $18,500 $91,680 $584,946 $3,067,763 $7,225,619 $12,740,284 Balance $0  $0  $0  $0  $0  $0
EZ Vein Statement of Cash Flows Proforma Cash Flow Statement Cash Flow From Operations Year 1 Year 2 Year 3 Year 4 Year 5 Net Income ($331,820) $822,606  $4,370,272  $7,463,147  $9,941,436  Plus: Depreciation $0  $0  $0  $0  $0  Operating Cash Flow ($331,820) $822,606  $4,370,272  $7,463,147  $9,941,436      Working Capital Requirements:   Change in Accounts Receivables ($22,500) ($219,167) ($533,333) ($425,000) ($400,000) Change in Inventory ($15,000) ($122,500) ($237,500) ($159,375) ($140,625) Change in Accounts Payable $5,000  $40,833  $79,167  $53,125  $46,875  Change in Bank Credit Line $0  $0  $0  $0  $0  Subtotal Working Capital Requirements ($32,500) ($300,833) ($691,667) ($531,250) ($493,750)     Cash Flow From Investing   Investment Capital Requirements:   Change in Leasehold Improvements $0  $0  $0  $0  $0  Change in Furniture & Equipment ($5,000) ($10,000) ($15,000) ($20,000) ($25,000) Subtotal Investment Capital Requirements ($5,000) ($10,000) ($15,000) ($20,000) ($25,000)     Cash Flow From Financing   Funding Sources:   Change in Long-term Debt (Mortgage) $0  $0  $0  $0  $0  Change in Equity $400,000  $0  $0  $0  $0  Tax Distribution-Members $0  ($370,173) ($1,966,622) ($3,358,416) ($4,473,646) Subtotal Funding Sources $400,000  ($370,173) ($1,966,622) ($3,358,416) ($4,473,646)     Total Cash Flow $30,680  $141,600  $1,696,983  $3,553,481  $4,949,040      Beginning Cash $17,000  $47,680  $189,280  $1,886,263  $5,439,744  Ending Cash $47,680  $189,280  $1,886,263  $5,439,744  $10,388,784
Tying Financials To Valuation Yrs.-Exit Typical Stage ROI Mult Fail   6 Seed (Feasibility)   66% 21.0 80% 5   Start-up (Development) 60% 10.5 60%   4 First Stage (Introduction) 53%  5.5 40%   3 Second Stage (Growth) 47%  3.2 20%   2 Mezzanine 41%  2.0 10%   1 Prep for M&A 35%  1.4 <5% Source: “Business Angels”, Robert Keeley
EZ Vein Sample Valuation Year 1 Year 2 Year 3 Year 4 Year 5 Revenues $270,000  $2,900,000  $9,300,000  $14,400,000  $19,200,000  COGS $70,000  $650,000  $1,800,000  $2,587,500  $3,300,000  Gross Profit $200,000  $2,250,000  $7,500,000  $11,812,500  $15,900,000  Gross Profit % 74% 78% 81% 82% 83% Development $266,000  $130,000  $98,000  $120,000  $122,000  Sales & Marketing $32,000  $281,000  $866,000  $1,300,000  $1,960,000  General & Administrative $233,820  $1,016,394  $2,165,728  $2,929,353  $3,876,564  EBITDA ($331,820) $822,606  $4,370,272  $7,463,147  $9,941,436  A Operating Profit % -123% 28% 47% 52% 52% Investor Adjustment to EBITDA 50% B Adjusted EBITDA $4,970,718  C = A X B Exit EBITDA Multiple 7 D Expected Exit Value $34,795,027  E = C X D Investment $400,000 F Required Return Multiple 21 G Expected Value at Exit $8,400,000 H = F X G Ownership % 24% I = H / E Business Plan Valuation Post Money Valuation $1,656,906 J = F / I $1,600,000  Pre Money Valuation $1,256,906 K = J - F $1,200,000
Questions?
Jim Rogers,  Director of Enterprise Services The Rubber  Meets the Road INNOVATION TO ENTERPRISE
OKLAHOMA INNOVATORS AND ENTREPRENEURS Brian McMurray, Co-Founder Dave Matthews, Managing Director Scott Rollins, CEO Sean Bauman, President   Bob Craine, Managing Director
Donald W. Reynolds Governor’s Cup Business Plan Competition INNOVATION TO ENTERPRISE
Donald W. Reynolds Governor’s Cup Designed to encourage college students  to act upon  their entrepreneurial ideas and develop skills   to lead  tomorrow's innovative new businesses.
How it works… Open to all colleges and universities Faculty sponsored Full or part time students Undergraduate and Graduate divisions The Business Plan The Process www.okgovernorscup.org INNOVATION TO ENTERPRISE
Governor’s Cup Results INNOVATION TO ENTERPRISE 26   Campuses Statewide 150   Innovative ideas 650   Students $700,000  in cash awarded $150,000  in kind services 12   ideas commercialized Job opportunities/Retainment
Matching   Oklahoma  college students  with  advance technology start-ups  for business project based  paid fellowships
The Paulsen Awards Providing   Oklahoma entrepreneurial  college students  the opportunity  for  $15,000  in scholarships
The  “ Al Tuttle ”  Business Incubation Award Providing one  graduate level  business plan the opportunity for  incubation space  and  services  for one year.
February 5 i2E Fellows Application Due February 26 Intent to Compete Due March 8 Business Plans Due March 24 Oral Competition Teams Announced April 5 Revised BPs and Presentations Due April 9 & 10 Oral Competition and Reception April 15 Awards Dinner May 18-21 Tri-State Competition Important Dates INNOVATION TO ENTERPRISE
Hands On Resources Available www.okgovernorscup.org INNOVATION TO ENTERPRISE
Questions?
COLLEGIATE BUSINESS PLAN COMPETITIONS Entrepreneurship Competition sponsored by Donald W. Reynolds Foundation with partners including EPSCoR & i2E Encouraged students to develop and implement businesses Promoted commercialization of innovations, ideas & products developed at Oklahoma colleges & universities 8 businesses launched by winners One winner received $80K SBIR grant (USDA)
i2E COMMERCIALIZATION VOUCHERS Entrepreneurship EPSCoR provided $1K vouchers to researchers for commercialization assessment of inventions by i2E Nationally recognized proprietary model for assisting entrepreneurs Accessed through university tech transfer offices ~ 90 technologies assessed ~ 7 resulted in new start-up companies ~25 resulted in commercial development ~10 potential licensing opportunities ~18 show potential commercial and/or licensing opportunities  with additional research & development
Cellulosic Bioenergy Potential for Oklahoma Governor’s Biofuels Coalition 25% of energy needs through biofuels by 2025 {25x’25 Alliance} In Oklahoma by 2025* 2.4 billion gallons of biofuels per year 43.3 billion KWh of electricity 134,000 new jobs $13 billion in economic activity *  Dr. Ernie Shea, 25x25’ Project Coordinator

Afternoon Sessions

  • 1.
  • 2.
    James Randall, Director of Enterprise Services Putting Dollars & Sense into your Plan Integrated Financial Statements INNOVATION TO ENTERPRISE
  • 3.
    Do you knowhow profitable your products and services really are? Do you have enough cash to make payroll? Do you know your monthly burn rate? Do you know when you expect to reach cash flow breakeven? (Wrong…add 6 months!) Do you know how much capital is really needed and when? Questions?
  • 4.
    Business & CapitalLifecycle Valley of Death Investigation Feasibility Development Introduction Growth Maturity Proof of concept SEED Start up Early First, Second, etc. Friends, Founders, Family Angels, Grants, Bootstrap Venture Capital Equity Markets, Banks
  • 5.
    Without Integrated Financials…Virtually impossible to cross the Valley of Death Virtually impossible to raise capital from Investors START-UP FACTS OF LIFE
  • 6.
    Income Statement (Profitability)Revenue – Expense = Profits OVER PERIOD OF TIME Balance Sheet (Stability) Assets – Liabilities = Equity AT POINT IN TIME Statement of Cash Flows (Liquidity) Beginning Cash + Sources – Uses = Ending Cash Driven entirely by IS and BS Monthly schedule CRITICAL Year 1!!! Integrated Financial Statements
  • 7.
    10. Not understandingrevenue drivers 9. Using top down revenue forecasting 8. Underestimating sales cycle 7. Underestimating operating costs 6. Static assumptions as business scales 5. Underestimating Working Capital needs 4. Underestimating time to secure financing 3. Financials do not reflect business plan 2. For LLCs, no allowance for tax distributions 1. Balance Sheet does not balance! Common Mistakes
  • 8.
    Minimum 3 years,5 years ideally Monthly for 1 st year (Valley of Death!) Valid assumptions critical Executive Summary and Investor Presentation Summarized Income Statement only Business Plan (2 pages maximum) Detailed Income Statement Detailed Balance Sheet Detailed Statement of Cash Flows Recommended Format
  • 9.
  • 10.
    Staffing Plan AssumptionsStaffing Plan Annual Comp Year 1 Year 2 Year 3 Year 4 Year 5 President $90,000 0.5 1 1 1 1 VP Sales & Marketing $70,000 1 1 1 1 1 Shipping/Inventory Control (1:25,000 Units) $24,000 1 4 12 18 24 Sales Professionals $50,000 - 2 4 6 10 CFO/Controller $75,000 - 1 1 1 1 Accountant $40,000 - 1 1 1 1 VP Engineering & Operations $70,000 - 1 1 1 1 IT Manager $60,000 - - 1 1 1 HR Manager $60,000 - - 1 1 1 Total # Employees 3 11 20 28 38     Employee Taxes & Benefits 28%   Annual Cost of Living Adjustments 3%          
  • 11.
    Operating Expense AssumptionsSales & Marketing Expenses Year 1 Year 2 Year 3 Year 4 Year 5 # Trade Shows/Year - 3 4 4 4 Cost/Trade Show $5,000   Marketing Materials $12,000 $50,000 $150,000 $200,000 $500,000 Advertising Exp. (% Sales) 3.0%   Travel Expense/Trade Show $2,500   Monthly Travel Expense/Sales Professional $1,500   Sales Commission 5%       Development Expenses   Product Development & Testing $180,000 $100,000 $50,000 $60,000 $50,000 Regulatory Requirements $80,000 $12,000 $12,000 $24,000 $24,000 Web Development & Hosting $6,000 $18,000 $36,000 $36,000 $48,000     General & Administrative Expenses   Travel Expense/Executive/Year $2,000   Telephone-Base 800 Service $1,800   Telephone-Variable 1.0%   Warehouse Rent/Year $12,000 $12,000 $72,000 $72,000 $72,000 Office Rent/Employee $1,440   Insurance-General (% Rev.) 1.0%   Insurance-Product Liability (% Rev.) 5.0%   Outside Accounting $6,000 $12,000 $24,000 $24,000 $24,000 Outside Legal $12,000 $25,000 $50,000 $50,000 $50,000
  • 12.
    EZ Vein IncomeStatement Proforma Income Statement   Year 1 Year 2 Year 3 Year 4 Year 5 Revenues:   EZ Vein Revenue $250,000 $2,700,000 $8,700,000 $13,500,000 $18,000,000 Freight/Shipping Revenue $20,000 $200,000 $600,000 $900,000 $1,200,000 Total Revenues $270,000 $2,900,000 $9,300,000 $14,400,000 $19,200,000     Cost of Good Sold $60,000 $550,000 $1,500,000 $2,137,500 $2,700,000 Freight/Shipping Expenses $10,000 $100,000 $300,000 $450,000 $600,000     Gross Profit $200,000 $2,250,000 $7,500,000 $11,812,500 $15,900,000 Gross Profit Margin 74% 78% 81% 82% 83%     Operating Expenses:   Salaries $139,000 $557,230 $1,011,038 $1,307,994 $1,734,409 Employee Taxes & Benefits $38,920 $156,024 $283,091 $366,238 $485,635 Sales Commissions $12,500 $135,000 $435,000 $675,000 $900,000 Marketing Expenses $12,000 $65,000 $170,000 $220,000 $520,000 Advertising Expenses $7,500 $81,000 $261,000 $405,000 $540,000 Product Development & Testing $180,000 $100,000 $50,000 $60,000 $50,000 Regulatory Expenses $80,000 $12,000 $12,000 $24,000 $24,000 Internet/Website Expenses $6,000 $18,000 $36,000 $36,000 $48,000 Travel Expenses $3,000 $47,500 $86,000 $122,000 $194,000 Telephone Expenses $4,300 $28,800 $88,800 $136,800 $181,800 Rent Expense $15,600 $27,840 $100,800 $112,320 $126,720 Insurance Expenses $15,000 $162,000 $522,000 $810,000 $1,080,000 Accounting $6,000 $12,000 $24,000 $24,000 $24,000 Legal $12,000 $25,000 $50,000 $50,000 $50,000 Total Operating Expenses $531,820 $1,427,394 $3,129,728 $4,349,353 $5,958,564     EBITDA ($331,820) $822,606 $4,370,272 $7,463,147 $9,941,436 Operating Profit Margin -123% 28% 47% 52% 52%
  • 13.
    Balance Sheet AssumptionsBalance Sheet Assumptions: Beg Year 1 Year 2 Year 3 Year 4 Year 5 Balances at Time/Year 0   Cash $17,000   Accounts Receivables $0   Inventory $0   Leasehold Improvements $0   Office Furniture & Computers $1,500   Accumulated Depreciation $0   Account Payable $0   Bank Credit Line $0   Long-term Debt $0   Equity $20,000   Retained Earnings ($1,500)   Tax Distribution $0       Average # Days in Accounts Receivable 30   Average # Days in Inventory-Finished 90   Average # Days in Accounts Payable 30   Capital Expenditures:   Leasehold Improvements $0 $0 $0 $0 $0 Equipment $5,000 $10,000 $15,000 $20,000 $25,000 Bank Credit Line:   Advance Ratio for Accts. Rec. 0%   Advance Ratio for Inventory-Finished 0%   Equity Capital Raised $400,000 $0 $0 $0 $0 Incremental Member Tax Rate   45%        
  • 14.
    EZ Vein BalanceSheet Proforma Balance Sheet   Beg. Year 1 Year 2 Year 3 Year 4 Year 5 Cash $17,000 $47,680 $189,280 $1,886,263 $5,439,744 $10,388,784 Accounts Receivables $0 $22,500 $241,667 $775,000 $1,200,000 $1,600,000 Inventory $0 $15,000 $137,500 $375,000 $534,375 $675,000 Total Current Assets $17,000 $85,180 $568,446 $3,036,263 $7,174,119 $12,663,784     Leasehold Improvements $0 $0 $0 $0 $0 $0 Office Furniture & Computers $1,500 $6,500 $16,500 $31,500 $51,500 $76,500 Accumulated Depreciation $0 $0 $0 $0 $0 $0 Net PP&E $1,500 $6,500 $16,500 $31,500 $51,500 $76,500     Total Assets $18,500 $91,680 $584,946 $3,067,763 $7,225,619 $12,740,284     Account Payable $0 $5,000 $45,833 $125,000 $178,125 $225,000 Bank Credit Line $0 $0 $0 $0 $0 $0 Total Current Liabilities $0 $5,000 $45,833 $125,000 $178,125 $225,000     Long-term Debt $0 $0 $0 $0 $0 $0 Total Liabilities $0 $5,000 $45,833 $125,000 $178,125 $225,000     Equity $20,000 $420,000 $420,000 $420,000 $420,000 $420,000 Retained Earnings -$1,500 ($333,320) $489,286 $4,859,557 $12,322,705 $22,264,141 Tax Distribution $0 $0 ($370,173) ($2,336,795) ($5,695,211) ($10,168,858) Total Equity $18,500 $86,680 $539,113 $2,942,763 $7,047,494 $12,515,284     Total Liabilities & Equity $18,500 $91,680 $584,946 $3,067,763 $7,225,619 $12,740,284 Balance $0 $0 $0 $0 $0 $0
  • 15.
    EZ Vein Statementof Cash Flows Proforma Cash Flow Statement Cash Flow From Operations Year 1 Year 2 Year 3 Year 4 Year 5 Net Income ($331,820) $822,606 $4,370,272 $7,463,147 $9,941,436 Plus: Depreciation $0 $0 $0 $0 $0 Operating Cash Flow ($331,820) $822,606 $4,370,272 $7,463,147 $9,941,436     Working Capital Requirements:   Change in Accounts Receivables ($22,500) ($219,167) ($533,333) ($425,000) ($400,000) Change in Inventory ($15,000) ($122,500) ($237,500) ($159,375) ($140,625) Change in Accounts Payable $5,000 $40,833 $79,167 $53,125 $46,875 Change in Bank Credit Line $0 $0 $0 $0 $0 Subtotal Working Capital Requirements ($32,500) ($300,833) ($691,667) ($531,250) ($493,750)     Cash Flow From Investing   Investment Capital Requirements:   Change in Leasehold Improvements $0 $0 $0 $0 $0 Change in Furniture & Equipment ($5,000) ($10,000) ($15,000) ($20,000) ($25,000) Subtotal Investment Capital Requirements ($5,000) ($10,000) ($15,000) ($20,000) ($25,000)     Cash Flow From Financing   Funding Sources:   Change in Long-term Debt (Mortgage) $0 $0 $0 $0 $0 Change in Equity $400,000 $0 $0 $0 $0 Tax Distribution-Members $0 ($370,173) ($1,966,622) ($3,358,416) ($4,473,646) Subtotal Funding Sources $400,000 ($370,173) ($1,966,622) ($3,358,416) ($4,473,646)     Total Cash Flow $30,680 $141,600 $1,696,983 $3,553,481 $4,949,040     Beginning Cash $17,000 $47,680 $189,280 $1,886,263 $5,439,744 Ending Cash $47,680 $189,280 $1,886,263 $5,439,744 $10,388,784
  • 16.
    Tying Financials ToValuation Yrs.-Exit Typical Stage ROI Mult Fail 6 Seed (Feasibility) 66% 21.0 80% 5 Start-up (Development) 60% 10.5 60% 4 First Stage (Introduction) 53% 5.5 40% 3 Second Stage (Growth) 47% 3.2 20% 2 Mezzanine 41% 2.0 10% 1 Prep for M&A 35% 1.4 <5% Source: “Business Angels”, Robert Keeley
  • 17.
    EZ Vein SampleValuation Year 1 Year 2 Year 3 Year 4 Year 5 Revenues $270,000 $2,900,000 $9,300,000 $14,400,000 $19,200,000 COGS $70,000 $650,000 $1,800,000 $2,587,500 $3,300,000 Gross Profit $200,000 $2,250,000 $7,500,000 $11,812,500 $15,900,000 Gross Profit % 74% 78% 81% 82% 83% Development $266,000 $130,000 $98,000 $120,000 $122,000 Sales & Marketing $32,000 $281,000 $866,000 $1,300,000 $1,960,000 General & Administrative $233,820 $1,016,394 $2,165,728 $2,929,353 $3,876,564 EBITDA ($331,820) $822,606 $4,370,272 $7,463,147 $9,941,436 A Operating Profit % -123% 28% 47% 52% 52% Investor Adjustment to EBITDA 50% B Adjusted EBITDA $4,970,718 C = A X B Exit EBITDA Multiple 7 D Expected Exit Value $34,795,027 E = C X D Investment $400,000 F Required Return Multiple 21 G Expected Value at Exit $8,400,000 H = F X G Ownership % 24% I = H / E Business Plan Valuation Post Money Valuation $1,656,906 J = F / I $1,600,000 Pre Money Valuation $1,256,906 K = J - F $1,200,000
  • 18.
  • 19.
    Jim Rogers, Director of Enterprise Services The Rubber Meets the Road INNOVATION TO ENTERPRISE
  • 20.
    OKLAHOMA INNOVATORS ANDENTREPRENEURS Brian McMurray, Co-Founder Dave Matthews, Managing Director Scott Rollins, CEO Sean Bauman, President   Bob Craine, Managing Director
  • 21.
    Donald W. ReynoldsGovernor’s Cup Business Plan Competition INNOVATION TO ENTERPRISE
  • 22.
    Donald W. ReynoldsGovernor’s Cup Designed to encourage college students to act upon their entrepreneurial ideas and develop skills to lead tomorrow's innovative new businesses.
  • 23.
    How it works…Open to all colleges and universities Faculty sponsored Full or part time students Undergraduate and Graduate divisions The Business Plan The Process www.okgovernorscup.org INNOVATION TO ENTERPRISE
  • 24.
    Governor’s Cup ResultsINNOVATION TO ENTERPRISE 26 Campuses Statewide 150 Innovative ideas 650 Students $700,000 in cash awarded $150,000 in kind services 12 ideas commercialized Job opportunities/Retainment
  • 25.
    Matching Oklahoma college students with advance technology start-ups for business project based paid fellowships
  • 26.
    The Paulsen AwardsProviding Oklahoma entrepreneurial college students the opportunity for $15,000 in scholarships
  • 27.
    The “Al Tuttle ” Business Incubation Award Providing one graduate level business plan the opportunity for incubation space and services for one year.
  • 28.
    February 5 i2EFellows Application Due February 26 Intent to Compete Due March 8 Business Plans Due March 24 Oral Competition Teams Announced April 5 Revised BPs and Presentations Due April 9 & 10 Oral Competition and Reception April 15 Awards Dinner May 18-21 Tri-State Competition Important Dates INNOVATION TO ENTERPRISE
  • 29.
    Hands On ResourcesAvailable www.okgovernorscup.org INNOVATION TO ENTERPRISE
  • 30.
  • 31.
    COLLEGIATE BUSINESS PLANCOMPETITIONS Entrepreneurship Competition sponsored by Donald W. Reynolds Foundation with partners including EPSCoR & i2E Encouraged students to develop and implement businesses Promoted commercialization of innovations, ideas & products developed at Oklahoma colleges & universities 8 businesses launched by winners One winner received $80K SBIR grant (USDA)
  • 32.
    i2E COMMERCIALIZATION VOUCHERSEntrepreneurship EPSCoR provided $1K vouchers to researchers for commercialization assessment of inventions by i2E Nationally recognized proprietary model for assisting entrepreneurs Accessed through university tech transfer offices ~ 90 technologies assessed ~ 7 resulted in new start-up companies ~25 resulted in commercial development ~10 potential licensing opportunities ~18 show potential commercial and/or licensing opportunities with additional research & development
  • 33.
    Cellulosic Bioenergy Potentialfor Oklahoma Governor’s Biofuels Coalition 25% of energy needs through biofuels by 2025 {25x’25 Alliance} In Oklahoma by 2025* 2.4 billion gallons of biofuels per year 43.3 billion KWh of electricity 134,000 new jobs $13 billion in economic activity * Dr. Ernie Shea, 25x25’ Project Coordinator

Editor's Notes

  • #24 … the Governor’s Cup work. Just as i2E, the program has a statewide focus. ALL state universities and colleges are encouraged to identify faculty leaders and student participation. We strongly recommend multi disciplined teams, which reflects the true nature of a advanced technology startup. Our competition is extremely unique in that we required strong faculty involvement throughout the process. The faculty provide a strong mentoring role and key administrative point of contact for us. We feel this is a critical element which has contributed to making the program so successful, and is why the faculty receives a cash award. (Cash Awards $500 if their team becomes a UG semi-finalist or Grad finalist. $1000 for second and third place- $2500 for first) Full or part time students . 6 members on team, and at least one team member must have a key role in the company&apos;s management. We encourage teams to be multi-discipline: marketing, accounting, technology, engineering. There are two divisions- UG and Graduate . Teams comprised of at least one student enrolled in the graduate school must compete in the graduate competition even if undergraduates are members of the team. The business plan must be for a technology-based* seed, start-up or early stage venture and must address the entire business concept including implementation. Proposals for the buy-out or expansion of an existing company, tax-shelter opportunities, franchise, real estate syndications, and other consulting projects and analyses are not eligible. The Process- The business plans are scored based on written criteria. 12 UG move forward and compete in an oral competition. 6 Graduates move forward and compete in an oral competition. Students are given an opportunity to review scorecards and revise business plan. Judges are community leaders, investors, entrepreneurs and service providers. Scorecards are available online along with resources. Available on i2E.org site, as well as www.okgovernorscup.org .
  • #25 Thanks to the support from the State regents office we started the competition with 14 campuses and now we are up to 26. We have met with TCC, SNU, OSU-OKC and will be meeting with SWOSU next week. If you would like us to come to your campus, please contact Sarah Seagraves.
  • #29 Important dates Explain Tech Night out networking opportunities- this one is designed for students and faculty advisors- sponsored by the Oklahoma Business Roundtable and Oklahoma Quality Awards Foundation Stress Who wants to be workshop Explain intent to compete- this is an online form that helps us determine how many teams intend to compete- helps us ensure we have enough judges…… Stress business plans due in March- plenty of time to form a team and compete. In handout is a full list of networking opportunities and all the dates for the competition. Also visit the website for more information.