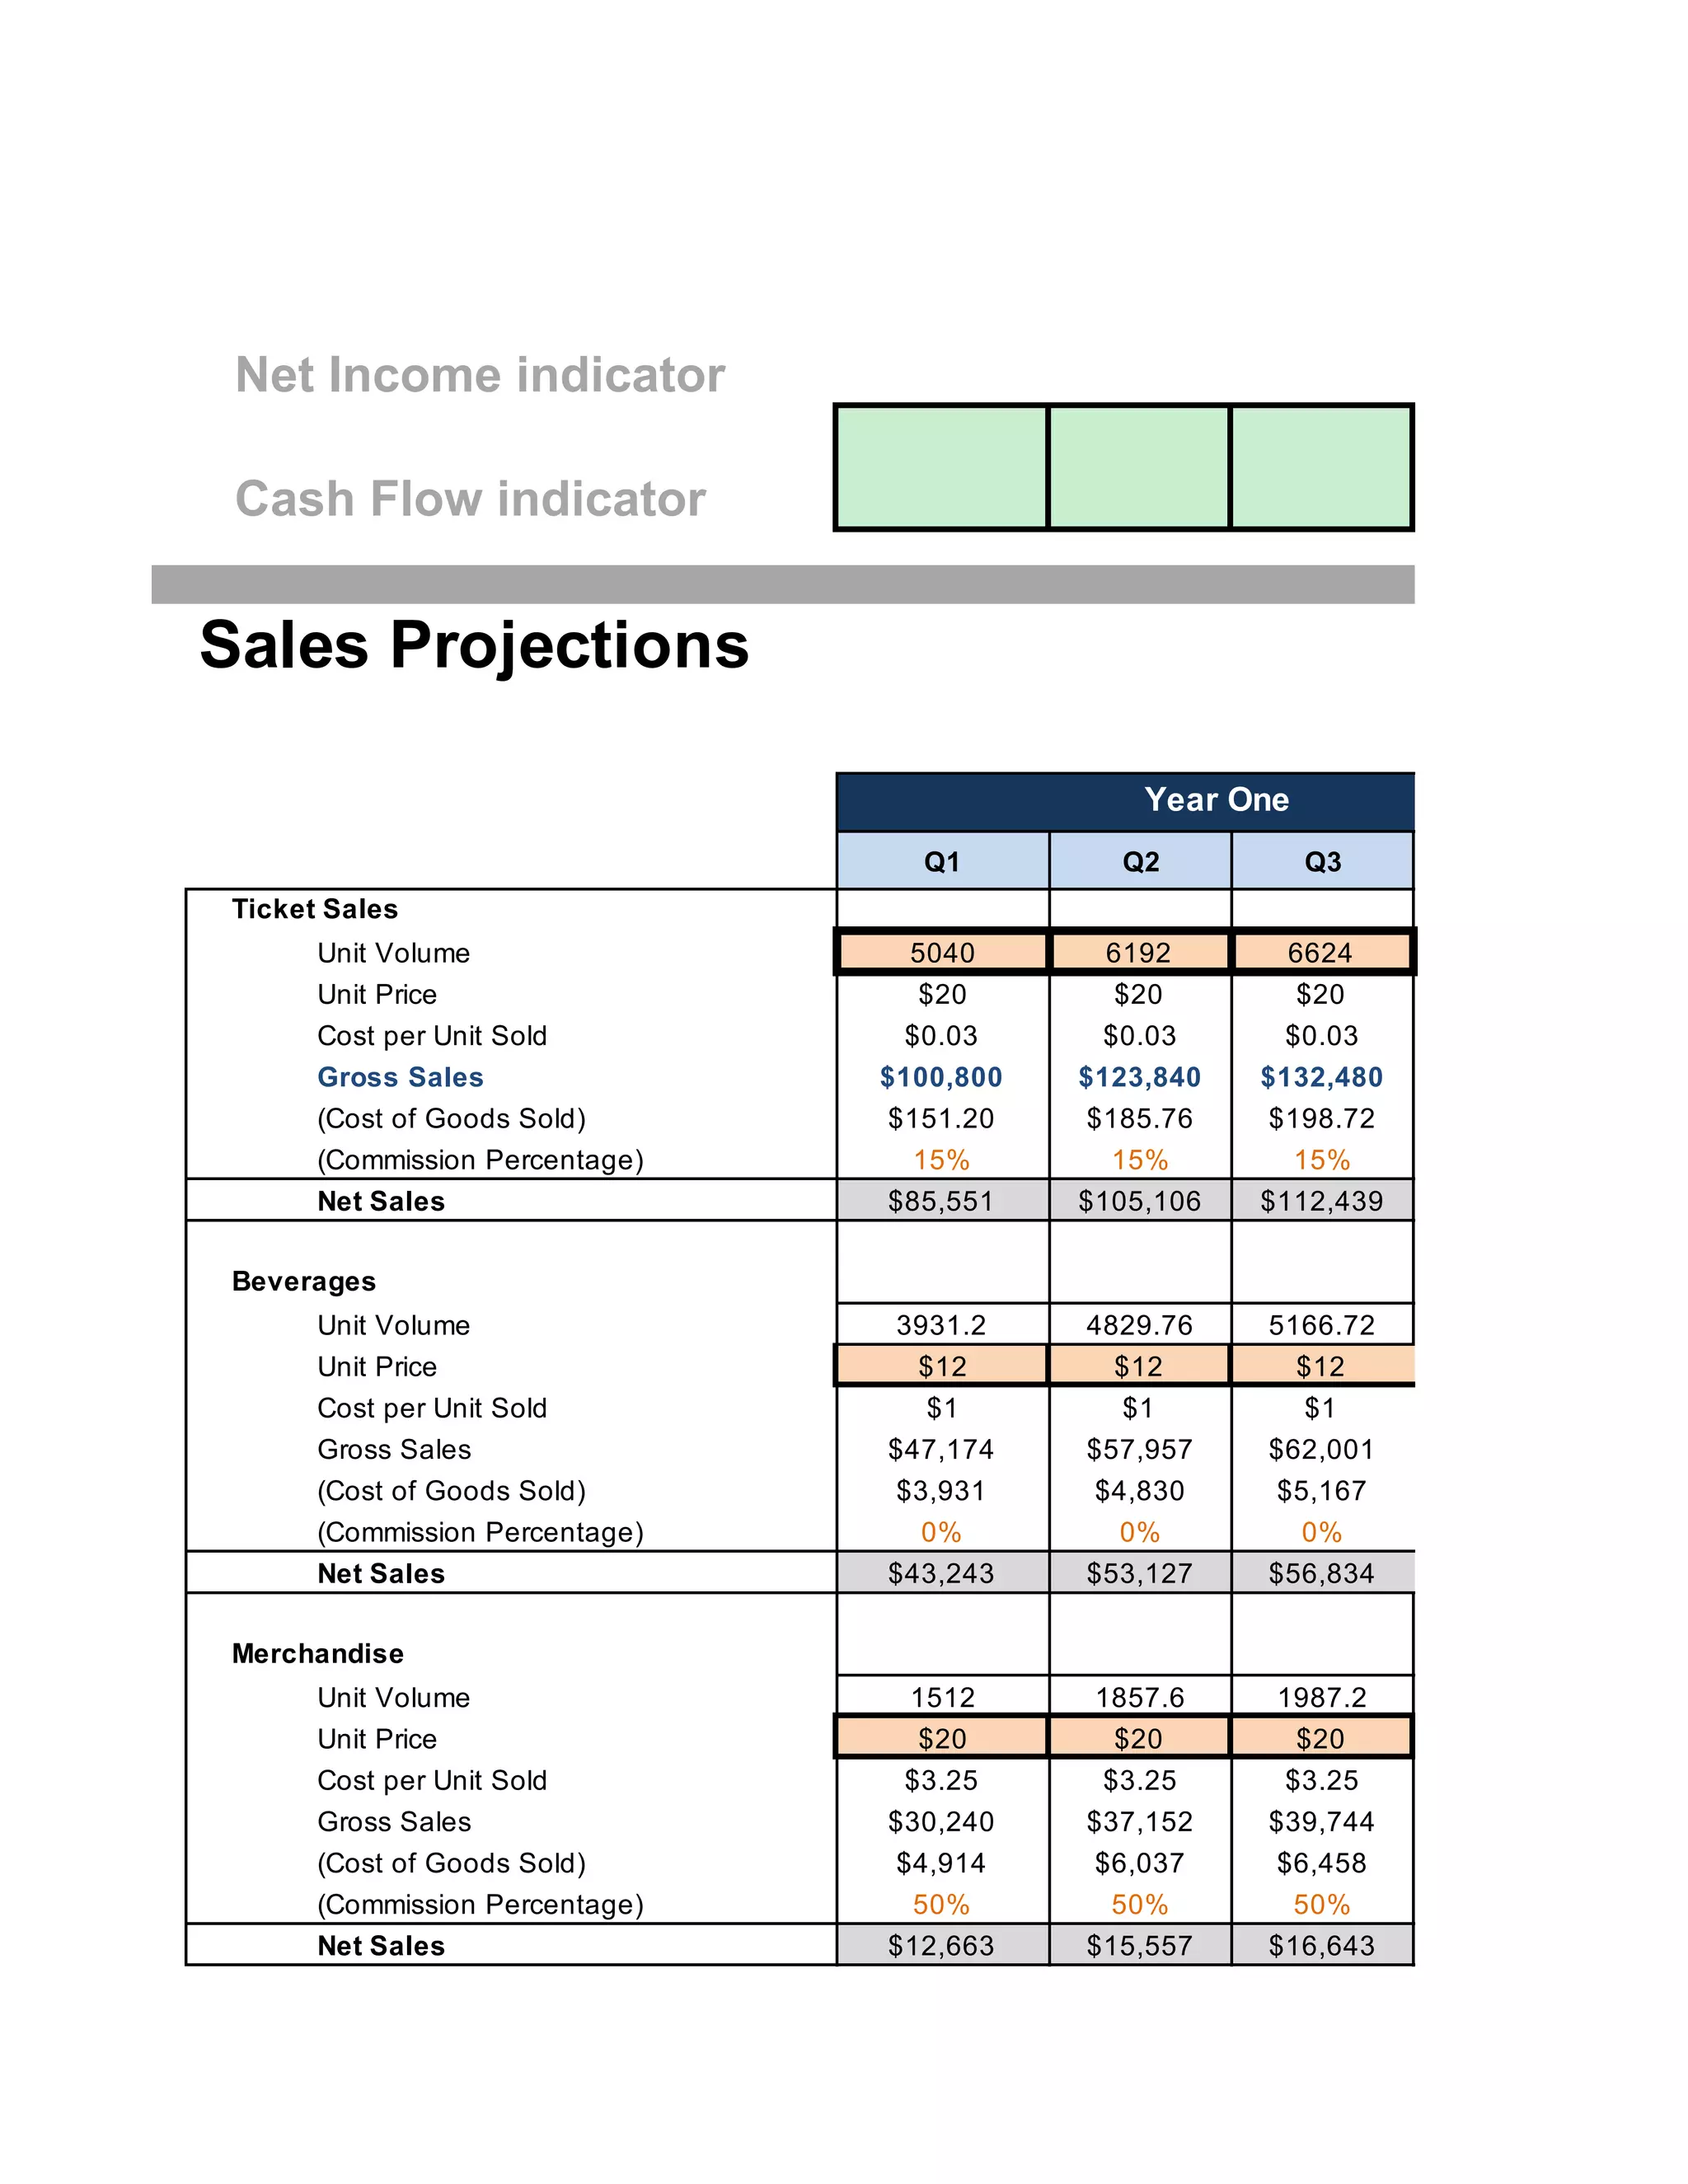
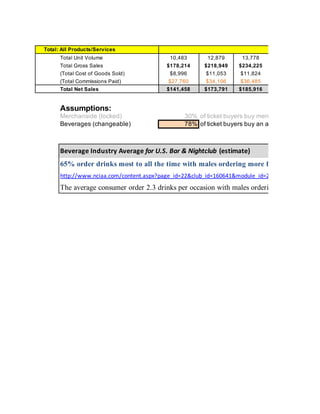
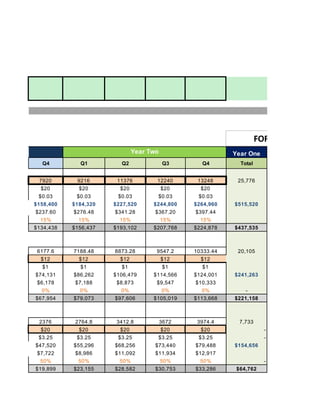
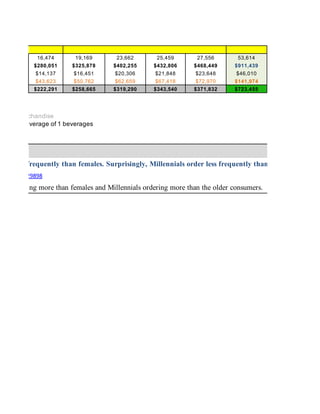
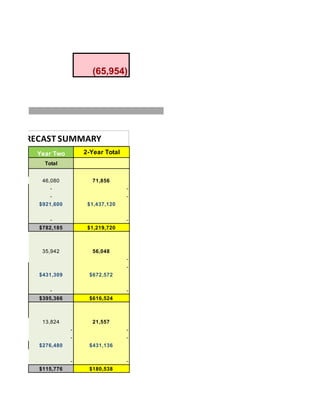
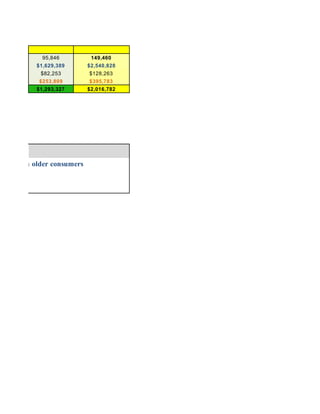
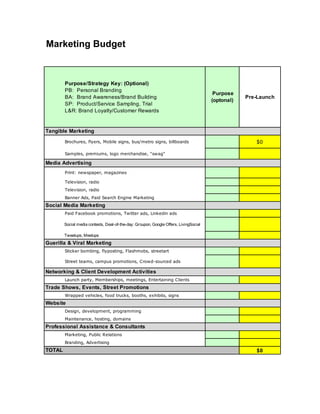
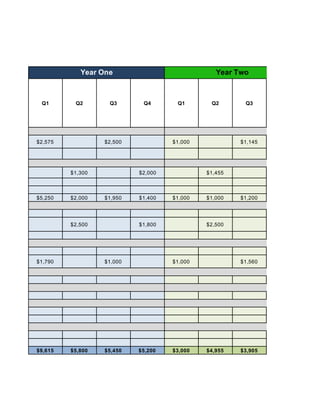
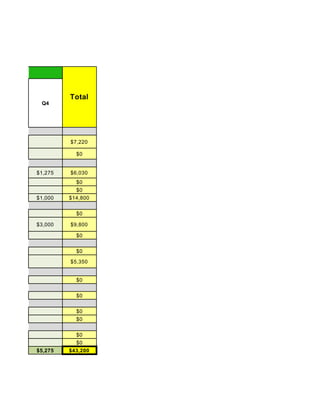
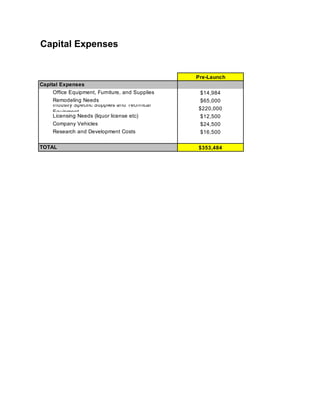
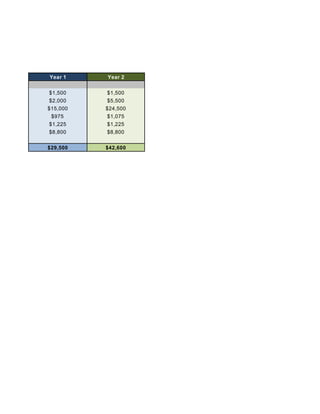
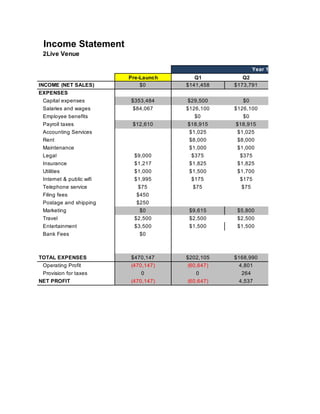
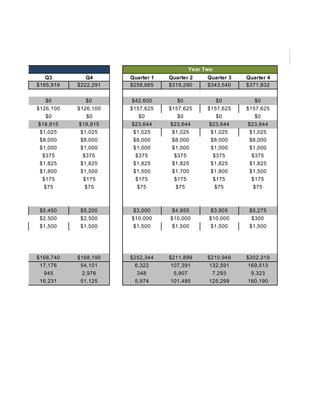
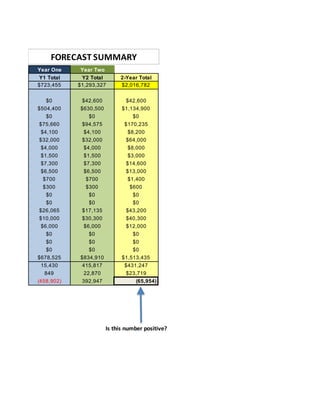
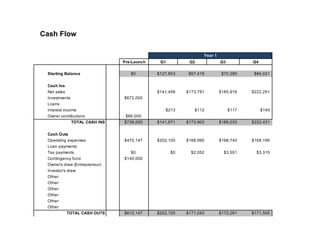
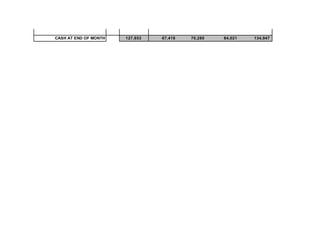
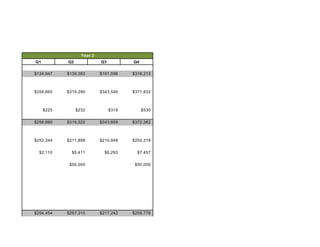
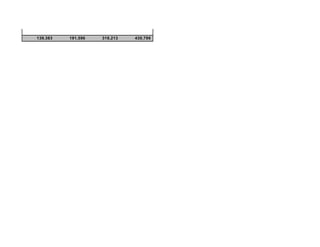
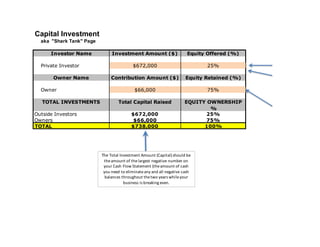
SlideShare a Scribd company logo
Net Income indicator
Cash Flow indicator
Q1 Q2 Q3
Unit Volume 5040 6192 6624
Unit Price $20 $20 $20
Cost per Unit Sold $0.03 $0.03 $0.03
Gross Sales $100,800 $123,840 $132,480
(Cost of Goods Sold) $151.20 $185.76 $198.72
(Commission Percentage) 15% 15% 15%
Net Sales $85,551 $105,106 $112,439
Unit Volume 3931.2 4829.76 5166.72
Unit Price $12 $12 $12
Cost per Unit Sold $1 $1 $1
Gross Sales $47,174 $57,957 $62,001
(Cost of Goods Sold) $3,931 $4,830 $5,167
(Commission Percentage) 0% 0% 0%
Net Sales $43,243 $53,127 $56,834
Unit Volume 1512 1857.6 1987.2
Unit Price $20 $20 $20
Cost per Unit Sold $3.25 $3.25 $3.25
Gross Sales $30,240 $37,152 $39,744
(Cost of Goods Sold) $4,914 $6,037 $6,458
(Commission Percentage) 50% 50% 50%
Net Sales $12,663 $15,557 $16,643
Sales Projections
Year One
Ticket Sales
Beverages
Merchandise
Total Unit Volume 10,483 12,879 13,778
Total Gross Sales $178,214 $218,949 $234,225
(Total Cost of Goods Sold) $8,996 $11,053 $11,824
(Total Commissions Paid) $27,760 $34,106 $36,485
Total Net Sales $141,458 $173,791 $185,916
Assumptions:
Merchanside (locked) 30% of ticket buyers buy merchandise
Beverages (changeable) 78% of ticket buyers buy an average of 1 bevera
Beverage Industry Average for U.S. Bar & Nightclub (estimate)
65% order drinks most to all the time with males ordering more frequently than f
http://www.nciaa.com/content.aspx?page_id=22&club_id=160641&module_id=29898
The average consumer order 2.3 drinks per occasion with males ordering more than fem
Total: All Products/Services
Year One
Q4 Q1 Q2 Q3 Q4 Total
7920 9216 11376 12240 13248 25,776
$20 $20 $20 $20 $20
$0.03 $0.03 $0.03 $0.03 $0.03
$158,400 $184,320 $227,520 $244,800 $264,960 $515,520
$237.60 $276.48 $341.28 $367.20 $397.44
15% 15% 15% 15% 15%
$134,438 $156,437 $193,102 $207,768 $224,878 $437,535
6177.6 7188.48 8873.28 9547.2 10333.44 20,105
$12 $12 $12 $12 $12
$1 $1 $1 $1 $1
$74,131 $86,262 $106,479 $114,566 $124,001 $241,263
$6,178 $7,188 $8,873 $9,547 $10,333
0% 0% 0% 0% 0% -
$67,954 $79,073 $97,606 $105,019 $113,668 $221,158
2376 2764.8 3412.8 3672 3974.4 7,733
$20 $20 $20 $20 $20 -
$3.25 $3.25 $3.25 $3.25 $3.25 -
$47,520 $55,296 $68,256 $73,440 $79,488 $154,656
$7,722 $8,986 $11,092 $11,934 $12,917
50% 50% 50% 50% 50% -
$19,899 $23,155 $28,582 $30,753 $33,286 $64,762
Year Two
ne
FORECAST SUMM
16,474 19,169 23,662 25,459 27,556 53,614
$280,051 $325,878 $402,255 $432,806 $468,449 $911,439
$14,137 $16,451 $20,306 $21,848 $23,648 $46,010
$43,623 $50,762 $62,659 $67,418 $72,970 $141,974
$222,291 $258,665 $319,290 $343,540 $371,832 $723,455
s buy merchandise
s buy an average of 1 beverages
ng more frequently than females. Surprisingly, Millennials order less frequently than older consumers
module_id=29898
ales ordering more than females and Millennials ordering more than the older consumers.
(65,954)
Year Two 2-Year Total
Total 1 2 3
46,080 71,856 $668 $6,192 $6,624
- - Q2 vs. Q1 Q3 vs. Q2
- - 23% 7%
$921,600 $1,437,120
Sales growing over time?
- - 163% overall rate
$782,185 $1,219,720 points for this dynamic (allocation)
your growth points
35,942 56,048 Perfectly Exponential
- Perfectly Linear
- This Forecast
$431,309 $672,572 As a proportion out of 100%
points for this dynamic (allocation)
- - your growth points
$395,366 $616,524
YOUR TOTAL POINTS %
Total Points Possible
13,824 21,557 Your Total Points
- -
- -
$276,480 $431,136
- -
$115,776 $180,538
Year One
FORECAST SUMMARY
95,846 149,460
$1,629,389 $2,540,828
$82,253 $128,263
$253,809 $395,783
$1,293,327 $2,016,782
ently than older consumers
4 5 6 7 8
$7,920 $9,216 $11,376 $12,240 $13,248 12580
Q4 vs. Q3 Q1 vs. Q4 Q2 vs. Q1 Q3 vs. Q2 Q4 vs. Q3
20% 16% 23% 8% 8%
LINEST
g over time? 1 1593.476
s dynamic (allocation) 25%
25%
L/S = 2
L/S = 1
L/S = 0.89
on out of 100% 44%
s dynamic (allocation) 75%
33%
L POINTS % 58%
10
al Points 6
One Year Two
slope
7 1,797.14
SLOPE L/S
1,797 1
Brochures, flyers, Mobile signs, bus/metro signs, billboards $0
Samples, premiums, logo merchandise, "swag"
Print: newspaper, magazines
Television, radio
Television, radio
Banner Ads, Paid Search Engine Marketing
Paid Facebook promotions, Twitter ads, Linkedin ads
Social media contests, Deal-of-the-day: Groupon, Google Offers, LivingSocial
Tweetups, Meetups
Sticker bombing, flyposting, Flashmobs, streetart
Street teams, campus promotions, Crowd-sourced ads
Launch party, Memberships, meetings, Entertaining Clients
Wrapped vehicles, food trucks, booths, exhibits, signs
Design, development, programming
Maintenance, hosting, domains
Marketing, Public Relations
Branding, Advertising
$0
Trade Shows, Events, Street Promotions
Website
Professional Assistance & Consultants
TOTAL
Marketing Budget
Purpose
(optonal)
Tangible Marketing
Media Advertising
Social Media Marketing
Guerilla & Viral Marketing
Networking & Client Development Activities
Purpose/Strategy Key: (Optional)
PB: Personal Branding
BA: Brand Awareness/Brand Building
SP: Product/Service Sampling, Trial
L&R: Brand Loyalty/Customer Rewards
Pre-Launch
Q1 Q2 Q3 Q4 Q1 Q2 Q3
$2,575 $2,500 $1,000 $1,145
$1,300 $2,000 $1,455
$5,250 $2,000 $1,950 $1,400 $1,000 $1,000 $1,200
$2,500 $1,800 $2,500
$1,790 $1,000 $1,000 $1,560
$9,615 $5,800 $5,450 $5,200 $3,000 $4,955 $3,905
Year Two
Year One
Q4
$7,220
$0
$1,275 $6,030
$0
$0
$1,000 $14,800
$0
$3,000 $9,800
$0
$0
$5,350
$0
$0
$0
$0
$0
$0
$5,275 $43,200
Two
Total
Pre-Launch
$14,984
$65,000
$220,000
$12,500
$24,500
$16,500
$353,484
Company Vehicles
Research and Development Costs
TOTAL
Capital Expenses
Capital Expenses
Office Equipment, Furniture, and Supplies
Remodeling Needs
Industry Specific Supplies and Technical
Equipment
Licensing Needs (liquor license etc)
Year 1 Year 2
$1,500 $1,500
$2,000 $5,500
$15,000 $24,500
$975 $1,075
$1,225 $1,225
$8,800 $8,800
$29,500 $42,600
2Live Venue
Pre-Launch Q1 Q2
$0 $141,458 $173,791
Capital expenses $353,484 $29,500 $0
Salaries and wages $84,067 $126,100 $126,100
Employee benefits $0 $0
Payroll taxes $12,610 $18,915 $18,915
Accounting Services $1,025 $1,025
Rent $8,000 $8,000
Maintenance $1,000 $1,000
Legal $9,000 $375 $375
Insurance $1,217 $1,825 $1,825
Utilities $1,000 $1,500 $1,700
Internet & public wifi $1,995 $175 $175
Telephone service $75 $75 $75
Filing fees $450
Postage and shipping $250
Marketing $0 $9,615 $5,800
Travel $2,500 $2,500 $2,500
Entertainment $3,500 $1,500 $1,500
Bank Fees $0
$470,147 $202,105 $168,990
Operating Profit (470,147) (60,647) 4,801
Provision for taxes 0 0 264
(470,147) (60,647) 4,537
EXPENSES
TOTAL EXPENSES
NET PROFIT
Income Statement
Year 1
INCOME (NET SALES)
Q3 Q4 Quarter 1 Quarter 2 Quarter 3 Quarter 4
$185,916 $222,291 $258,665 $319,290 $343,540 $371,832
$0 $0 $42,600 $0 $0 $0
$126,100 $126,100 $157,625 $157,625 $157,625 $157,625
$0 $0 $0 $0 $0 $0
$18,915 $18,915 $23,644 $23,644 $23,644 $23,644
$1,025 $1,025 $1,025 $1,025 $1,025 $1,025
$8,000 $8,000 $8,000 $8,000 $8,000 $8,000
$1,000 $1,000 $1,000 $1,000 $1,000 $1,000
$375 $375 $375 $375 $375 $375
$1,825 $1,825 $1,825 $1,825 $1,825 $1,825
$1,800 $1,500 $1,500 $1,700 $1,800 $1,500
$175 $175 $175 $175 $175 $175
$75 $75 $75 $75 $75 $75
$5,450 $5,200 $3,000 $4,955 $3,905 $5,275
$2,500 $2,500 $10,000 $10,000 $10,000 $300
$1,500 $1,500 $1,500 $1,500 $1,500 $1,500
$168,740 $168,190 $252,344 $211,899 $210,949 $202,319
17,176 54,101 6,322 107,391 132,591 169,513
945 2,976 348 5,907 7,293 9,323
16,231 51,125 5,974 101,485 125,299 160,190
Year 1 Year Two
Year One Year Two
Y1 Total Y2 Total 2-Year Total
$723,455 $1,293,327 $2,016,782
$0 $42,600 $42,600
$504,400 $630,500 $1,134,900
$0 $0 $0
$75,660 $94,575 $170,235
$4,100 $4,100 $8,200
$32,000 $32,000 $64,000
$4,000 $4,000 $8,000
$1,500 $1,500 $3,000
$7,300 $7,300 $14,600
$6,500 $6,500 $13,000
$700 $700 $1,400
$300 $300 $600
$0 $0 $0
$0 $0 $0
$26,065 $17,135 $43,200
$10,000 $30,300 $40,300
$6,000 $6,000 $12,000
$0 $0 $0
$0 $0 $0
$0 $0 $0
$678,525 $834,910 $1,513,435
15,430 415,817 $431,247
849 22,870 $23,719
(458,902) 392,947 (65,954)
Is this number positive?
FORECAST SUMMARY
Pre-Launch Q1 Q2 Q3 Q4
Starting Balance $0 $127,853 $67,418 $70,280 $84,021
Cash Ins
Net sales $141,458 $173,791 $185,916 $222,291
Investments $672,000
Loans
Interest income $213 $112 $117 $140
Owner contributions $66,000
TOTAL CASH INS $738,000 $141,671 $173,903 $186,033 $222,431
Cash Outs
Operating expenses $470,147 $202,105 $168,990 $168,740 $168,190
Loan payments
Tax payments $0 $0 $2,052 $3,551 $3,315
Contingency fund $140,000
Owner's draw (Entrepreneur)
Investor's draw
Other:
Other:
Other:
Other:
Other:
Other:
TOTAL CASH OUTS $610,147 $202,105 $171,042 $172,291 $171,505
Year 1
Cash Flow
CASH AT END OF MONTH 127,853 67,418 70,280 84,021 134,947
Q1 Q2 Q3 Q4
$134,947 $139,383 $191,596 $318,213
$258,665 $319,290 $343,540 $371,832
$225 $232 $319 $530
$258,890 $319,522 $343,859 $372,362
$252,344 $211,899 $210,949 $202,319
$2,110 $5,411 $6,293 $7,457
$50,000 $50,000
$254,454 $267,310 $217,242 $259,776
Year 2
139,383 191,596 318,213 430,799
Investment Amount ($) Equity Offered (%)
Private Investor $672,000 25%
Contribution Amount ($) Equity Retained (%)
Owner $66,000 75%
Total Capital Raised EQUITY OWNERSHIP
%
$672,000 25%
$66,000 75%
$738,000 100%
Outside Investors
Owners
TOTAL
Capital Investment
aka "Shark Tank" Page
Investor Name
Owner Name
TOTAL INVESTMENTS
The Total Investment Amount (Capital) should be
theamount of thelargest negative number on
your Cash Flow Statement (theamount of cash
you need to eliminateany and all negative cash
balances throughout thetwo years whileyour
business is breaking even.

More Related Content

What's hot

Case 2 aymaan hossain (1531434030)
Case 2  aymaan hossain (1531434030)Case 2  aymaan hossain (1531434030)
Case 2 aymaan hossain (1531434030)
AymaanHossain1
 
Netscape IPO - Harvard Business Case
Netscape IPO - Harvard Business CaseNetscape IPO - Harvard Business Case
Netscape IPO - Harvard Business Case
Kivanc Ozuolmez
 
Harvard Business Case - Super Project
Harvard Business Case - Super ProjectHarvard Business Case - Super Project
Harvard Business Case - Super Project
Kivanc Ozuolmez
 
Alex Rodriguez Final Presentation
Alex Rodriguez Final PresentationAlex Rodriguez Final Presentation
Alex Rodriguez Final PresentationIlan Bielas
 
Small Business Dec.2
Small Business Dec.2Small Business Dec.2
Small Business Dec.2
JMcaninch
 
Looptworks case analysis
Looptworks case analysisLooptworks case analysis
Looptworks case analysisFred Wu
 
RFM: A Cool Tool for Simple Analytics
RFM: A Cool Tool for Simple AnalyticsRFM: A Cool Tool for Simple Analytics
RFM: A Cool Tool for Simple Analytics
C.TRAC Inc.
 
Eden Grove Hotel Projections
Eden Grove Hotel ProjectionsEden Grove Hotel Projections
Eden Grove Hotel Projections
chronosproductions
 
Bond immunization
Bond immunizationBond immunization
Bond immunizationlala_k
 
The CRED DQ Report - Market Delinquency by Property Type
The CRED DQ Report - Market Delinquency by Property TypeThe CRED DQ Report - Market Delinquency by Property Type
The CRED DQ Report - Market Delinquency by Property Type
Michael Haas
 
alltel 4q05supplement
alltel  4q05supplementalltel  4q05supplement
alltel 4q05supplementfinance27
 
Financials1 P
Financials1 PFinancials1 P
Financials1 Pemronly
 
Financial Forecasting: Pro Forma Marketing Budget & Income Statement for a Li...
Financial Forecasting: Pro Forma Marketing Budget & Income Statement for a Li...Financial Forecasting: Pro Forma Marketing Budget & Income Statement for a Li...
Financial Forecasting: Pro Forma Marketing Budget & Income Statement for a Li...
Alexzandra Halbritter
 
Ira client_sample2014-09-18_t12_03_32
 Ira client_sample2014-09-18_t12_03_32 Ira client_sample2014-09-18_t12_03_32
Ira client_sample2014-09-18_t12_03_32
Ranga Chary, MBA, CFP
 
Caribe entertainment powerpoint week 6
Caribe entertainment powerpoint week 6Caribe entertainment powerpoint week 6
Caribe entertainment powerpoint week 6Caribe Entertainment
 
Big Buns Ballston (est. 2007)
Big Buns Ballston (est. 2007)Big Buns Ballston (est. 2007)
Big Buns Ballston (est. 2007)
CraigCarey9
 
Financial Annual Report Common Size
Financial Annual Report Common SizeFinancial Annual Report Common Size
Financial Annual Report Common SizeTaylor Wiley
 
Memo Case 2
Memo Case 2Memo Case 2
Memo Case 2
Nataliaivanov
 

What's hot (20)

Case 2 aymaan hossain (1531434030)
Case 2  aymaan hossain (1531434030)Case 2  aymaan hossain (1531434030)
Case 2 aymaan hossain (1531434030)
 
Netscape IPO - Harvard Business Case
Netscape IPO - Harvard Business CaseNetscape IPO - Harvard Business Case
Netscape IPO - Harvard Business Case
 
Harvard Business Case - Super Project
Harvard Business Case - Super ProjectHarvard Business Case - Super Project
Harvard Business Case - Super Project
 
Alex Rodriguez Final Presentation
Alex Rodriguez Final PresentationAlex Rodriguez Final Presentation
Alex Rodriguez Final Presentation
 
Small Business Dec.2
Small Business Dec.2Small Business Dec.2
Small Business Dec.2
 
Looptworks case analysis
Looptworks case analysisLooptworks case analysis
Looptworks case analysis
 
RFM: A Cool Tool for Simple Analytics
RFM: A Cool Tool for Simple AnalyticsRFM: A Cool Tool for Simple Analytics
RFM: A Cool Tool for Simple Analytics
 
Eden Grove Hotel Projections
Eden Grove Hotel ProjectionsEden Grove Hotel Projections
Eden Grove Hotel Projections
 
Bond immunization
Bond immunizationBond immunization
Bond immunization
 
The CRED DQ Report - Market Delinquency by Property Type
The CRED DQ Report - Market Delinquency by Property TypeThe CRED DQ Report - Market Delinquency by Property Type
The CRED DQ Report - Market Delinquency by Property Type
 
alltel 4q05supplement
alltel  4q05supplementalltel  4q05supplement
alltel 4q05supplement
 
Financials1 P
Financials1 PFinancials1 P
Financials1 P
 
Financial Forecasting: Pro Forma Marketing Budget & Income Statement for a Li...
Financial Forecasting: Pro Forma Marketing Budget & Income Statement for a Li...Financial Forecasting: Pro Forma Marketing Budget & Income Statement for a Li...
Financial Forecasting: Pro Forma Marketing Budget & Income Statement for a Li...
 
Ip Final 2
Ip Final 2Ip Final 2
Ip Final 2
 
Ira client_sample2014-09-18_t12_03_32
 Ira client_sample2014-09-18_t12_03_32 Ira client_sample2014-09-18_t12_03_32
Ira client_sample2014-09-18_t12_03_32
 
Caribe entertainment powerpoint week 6
Caribe entertainment powerpoint week 6Caribe entertainment powerpoint week 6
Caribe entertainment powerpoint week 6
 
Big Buns Ballston (est. 2007)
Big Buns Ballston (est. 2007)Big Buns Ballston (est. 2007)
Big Buns Ballston (est. 2007)
 
Financial Annual Report Common Size
Financial Annual Report Common SizeFinancial Annual Report Common Size
Financial Annual Report Common Size
 
Memo Case 2
Memo Case 2Memo Case 2
Memo Case 2
 
WRI Phone SKU Analysis
WRI Phone SKU AnalysisWRI Phone SKU Analysis
WRI Phone SKU Analysis
 

Similar to Financial Forecasting

Financial statements
Financial statementsFinancial statements
Financial statements
Britteny2
 
Financial Forecasting
Financial ForecastingFinancial Forecasting
Financial Forecasting
AlayshaOrtiz1
 
Financial Forecasting
Financial ForecastingFinancial Forecasting
Financial Forecasting
TravonnLee
 
Digital everywhere 2% growth with debt
Digital everywhere 2% growth with debtDigital everywhere 2% growth with debt
Digital everywhere 2% growth with debtBea Morales
 
Round 2Dec. 31, 2015 C57912AndrewsTracy CalhounVict.docx
Round 2Dec. 31, 2015 C57912AndrewsTracy CalhounVict.docxRound 2Dec. 31, 2015 C57912AndrewsTracy CalhounVict.docx
Round 2Dec. 31, 2015 C57912AndrewsTracy CalhounVict.docx
joellemurphey
 
Best CaseIncome Statement (Unaudited)(for years ending September 1.docx
Best CaseIncome Statement (Unaudited)(for years ending September 1.docxBest CaseIncome Statement (Unaudited)(for years ending September 1.docx
Best CaseIncome Statement (Unaudited)(for years ending September 1.docx
AASTHA76
 
Afternoon Sessions
Afternoon SessionsAfternoon Sessions
Afternoon Sessionsgmm0611
 
TREB Market Watch for May 2016
TREB Market Watch for May 2016TREB Market Watch for May 2016
TREB Market Watch for May 2016
Michelle Makos
 
Market Watch May 2016
Market Watch May 2016Market Watch May 2016
Market Watch May 2016
Chaba Tamasi
 
Round 3 - 2021Sim ID Z78284_3High Level OverviewTe.docx
Round 3 - 2021Sim ID Z78284_3High Level OverviewTe.docxRound 3 - 2021Sim ID Z78284_3High Level OverviewTe.docx
Round 3 - 2021Sim ID Z78284_3High Level OverviewTe.docx
daniely50
 
ProcureConYasuoSonodaOutline.pdf
ProcureConYasuoSonodaOutline.pdfProcureConYasuoSonodaOutline.pdf
ProcureConYasuoSonodaOutline.pdf
Yasuo Sonoda, CCTE, GLP
 
Market Watch TORONTO 2015 OCTOBER
Market Watch TORONTO 2015 OCTOBERMarket Watch TORONTO 2015 OCTOBER
Market Watch TORONTO 2015 OCTOBER
Chaba Tamasi
 
Excerpts taken from Lucas, S.E. (12th ed.) (2015). The Art .docx
Excerpts taken from  Lucas, S.E. (12th ed.) (2015).  The Art .docxExcerpts taken from  Lucas, S.E. (12th ed.) (2015).  The Art .docx
Excerpts taken from Lucas, S.E. (12th ed.) (2015). The Art .docx
cravennichole326
 
Market Watch APRIL 2015
Market Watch APRIL 2015Market Watch APRIL 2015
Market Watch APRIL 2015Chaba Tamasi
 
Rising to the Level of Excellence
Rising to the Level of ExcellenceRising to the Level of Excellence
Rising to the Level of Excellence
Jodi Rudick
 
Market Report for August 2017 - Residential Resale
Market Report for August 2017 - Residential ResaleMarket Report for August 2017 - Residential Resale
Market Report for August 2017 - Residential Resale
Michelle Makos
 
Understanding Profitability in the Affiliate Space
Understanding Profitability in the Affiliate SpaceUnderstanding Profitability in the Affiliate Space
Understanding Profitability in the Affiliate Space
Affiliate Summit
 
Round 2 - 2020Sim ID Z79546_8High Level OverviewTe.docx
Round 2 - 2020Sim ID Z79546_8High Level OverviewTe.docxRound 2 - 2020Sim ID Z79546_8High Level OverviewTe.docx
Round 2 - 2020Sim ID Z79546_8High Level OverviewTe.docx
daniely50
 

Similar to Financial Forecasting (20)

Financial statements
Financial statementsFinancial statements
Financial statements
 
Financial Forecasting
Financial ForecastingFinancial Forecasting
Financial Forecasting
 
Financial Forecasting
Financial ForecastingFinancial Forecasting
Financial Forecasting
 
Teacher Concessions
Teacher ConcessionsTeacher Concessions
Teacher Concessions
 
Digital everywhere 2% growth with debt
Digital everywhere 2% growth with debtDigital everywhere 2% growth with debt
Digital everywhere 2% growth with debt
 
Round 2Dec. 31, 2015 C57912AndrewsTracy CalhounVict.docx
Round 2Dec. 31, 2015 C57912AndrewsTracy CalhounVict.docxRound 2Dec. 31, 2015 C57912AndrewsTracy CalhounVict.docx
Round 2Dec. 31, 2015 C57912AndrewsTracy CalhounVict.docx
 
Best CaseIncome Statement (Unaudited)(for years ending September 1.docx
Best CaseIncome Statement (Unaudited)(for years ending September 1.docxBest CaseIncome Statement (Unaudited)(for years ending September 1.docx
Best CaseIncome Statement (Unaudited)(for years ending September 1.docx
 
Exhibits - Copy
Exhibits - CopyExhibits - Copy
Exhibits - Copy
 
Afternoon Sessions
Afternoon SessionsAfternoon Sessions
Afternoon Sessions
 
TREB Market Watch for May 2016
TREB Market Watch for May 2016TREB Market Watch for May 2016
TREB Market Watch for May 2016
 
Market Watch May 2016
Market Watch May 2016Market Watch May 2016
Market Watch May 2016
 
Round 3 - 2021Sim ID Z78284_3High Level OverviewTe.docx
Round 3 - 2021Sim ID Z78284_3High Level OverviewTe.docxRound 3 - 2021Sim ID Z78284_3High Level OverviewTe.docx
Round 3 - 2021Sim ID Z78284_3High Level OverviewTe.docx
 
ProcureConYasuoSonodaOutline.pdf
ProcureConYasuoSonodaOutline.pdfProcureConYasuoSonodaOutline.pdf
ProcureConYasuoSonodaOutline.pdf
 
Market Watch TORONTO 2015 OCTOBER
Market Watch TORONTO 2015 OCTOBERMarket Watch TORONTO 2015 OCTOBER
Market Watch TORONTO 2015 OCTOBER
 
Excerpts taken from Lucas, S.E. (12th ed.) (2015). The Art .docx
Excerpts taken from  Lucas, S.E. (12th ed.) (2015).  The Art .docxExcerpts taken from  Lucas, S.E. (12th ed.) (2015).  The Art .docx
Excerpts taken from Lucas, S.E. (12th ed.) (2015). The Art .docx
 
Market Watch APRIL 2015
Market Watch APRIL 2015Market Watch APRIL 2015
Market Watch APRIL 2015
 
Rising to the Level of Excellence
Rising to the Level of ExcellenceRising to the Level of Excellence
Rising to the Level of Excellence
 
Market Report for August 2017 - Residential Resale
Market Report for August 2017 - Residential ResaleMarket Report for August 2017 - Residential Resale
Market Report for August 2017 - Residential Resale
 
Understanding Profitability in the Affiliate Space
Understanding Profitability in the Affiliate SpaceUnderstanding Profitability in the Affiliate Space
Understanding Profitability in the Affiliate Space
 
Round 2 - 2020Sim ID Z79546_8High Level OverviewTe.docx
Round 2 - 2020Sim ID Z79546_8High Level OverviewTe.docxRound 2 - 2020Sim ID Z79546_8High Level OverviewTe.docx
Round 2 - 2020Sim ID Z79546_8High Level OverviewTe.docx
 

More from JamariHodges1

Vision Plan
Vision PlanVision Plan
Vision Plan
JamariHodges1
 
Brochure
Brochure Brochure
Brochure
JamariHodges1
 
Press Release & Media Outreach
Press Release & Media OutreachPress Release & Media Outreach
Press Release & Media Outreach
JamariHodges1
 
One Sheet
One SheetOne Sheet
One Sheet
JamariHodges1
 
Electronic Press Kit
Electronic Press KitElectronic Press Kit
Electronic Press Kit
JamariHodges1
 
Album Release
Album Release Album Release
Album Release
JamariHodges1
 
Tour Schedule
Tour ScheduleTour Schedule
Tour Schedule
JamariHodges1
 
Publishing Company Pitch
Publishing Company PitchPublishing Company Pitch
Publishing Company Pitch
JamariHodges1
 
Market Analysis Report
Market Analysis ReportMarket Analysis Report
Market Analysis Report
JamariHodges1
 

More from JamariHodges1 (9)

Vision Plan
Vision PlanVision Plan
Vision Plan
 
Brochure
Brochure Brochure
Brochure
 
Press Release & Media Outreach
Press Release & Media OutreachPress Release & Media Outreach
Press Release & Media Outreach
 
One Sheet
One SheetOne Sheet
One Sheet
 
Electronic Press Kit
Electronic Press KitElectronic Press Kit
Electronic Press Kit
 
Album Release
Album Release Album Release
Album Release
 
Tour Schedule
Tour ScheduleTour Schedule
Tour Schedule
 
Publishing Company Pitch
Publishing Company PitchPublishing Company Pitch
Publishing Company Pitch
 
Market Analysis Report
Market Analysis ReportMarket Analysis Report
Market Analysis Report
 

Recently uploaded

managementaccountingunitiv-230422140105-dd17d80b.ppt
managementaccountingunitiv-230422140105-dd17d80b.pptmanagementaccountingunitiv-230422140105-dd17d80b.ppt
managementaccountingunitiv-230422140105-dd17d80b.ppt
SuseelaPalanimuthu
 
Chương 6. Ancol - phenol - ether (1).pdf
Chương 6. Ancol - phenol - ether (1).pdfChương 6. Ancol - phenol - ether (1).pdf
Chương 6. Ancol - phenol - ether (1).pdf
va2132004
 
what is the best method to sell pi coins in 2024
what is the best method to sell pi coins in 2024what is the best method to sell pi coins in 2024
what is the best method to sell pi coins in 2024
DOT TECH
 
how to sell pi coins in all Africa Countries.
how to sell pi coins in all Africa Countries.how to sell pi coins in all Africa Countries.
how to sell pi coins in all Africa Countries.
DOT TECH
 
where can I find a legit pi merchant online
where can I find a legit pi merchant onlinewhere can I find a legit pi merchant online
where can I find a legit pi merchant online
DOT TECH
 
APP I Lecture Notes to students 0f 4the year
APP I  Lecture Notes  to students 0f 4the yearAPP I  Lecture Notes  to students 0f 4the year
APP I Lecture Notes to students 0f 4the year
telilaalilemlem
 
how to sell pi coins effectively (from 50 - 100k pi)
how to sell pi coins effectively (from 50 - 100k  pi)how to sell pi coins effectively (from 50 - 100k  pi)
how to sell pi coins effectively (from 50 - 100k pi)
DOT TECH
 
The secret way to sell pi coins effortlessly.
The secret way to sell pi coins effortlessly.The secret way to sell pi coins effortlessly.
The secret way to sell pi coins effortlessly.
DOT TECH
 
innovative-invoice-discounting-platforms-in-india-empowering-retail-investors...
innovative-invoice-discounting-platforms-in-india-empowering-retail-investors...innovative-invoice-discounting-platforms-in-india-empowering-retail-investors...
innovative-invoice-discounting-platforms-in-india-empowering-retail-investors...
Falcon Invoice Discounting
 
This assessment plan proposal is to outline a structured approach to evaluati...
This assessment plan proposal is to outline a structured approach to evaluati...This assessment plan proposal is to outline a structured approach to evaluati...
This assessment plan proposal is to outline a structured approach to evaluati...
lamluanvan.net Viết thuê luận văn
 
how to sell pi coins on Binance exchange
how to sell pi coins on Binance exchangehow to sell pi coins on Binance exchange
how to sell pi coins on Binance exchange
DOT TECH
 
Summary of financial results for 1Q2024
Summary of financial  results for 1Q2024Summary of financial  results for 1Q2024
Summary of financial results for 1Q2024
InterCars
 
Turin Startup Ecosystem 2024 - Ricerca sulle Startup e il Sistema dell'Innov...
Turin Startup Ecosystem 2024  - Ricerca sulle Startup e il Sistema dell'Innov...Turin Startup Ecosystem 2024  - Ricerca sulle Startup e il Sistema dell'Innov...
Turin Startup Ecosystem 2024 - Ricerca sulle Startup e il Sistema dell'Innov...
Quotidiano Piemontese
 
Financial Assets: Debit vs Equity Securities.pptx
Financial Assets: Debit vs Equity Securities.pptxFinancial Assets: Debit vs Equity Securities.pptx
Financial Assets: Debit vs Equity Securities.pptx
Writo-Finance
 
What price will pi network be listed on exchanges
What price will pi network be listed on exchangesWhat price will pi network be listed on exchanges
What price will pi network be listed on exchanges
DOT TECH
 
how can I sell pi coins after successfully completing KYC
how can I sell pi coins after successfully completing KYChow can I sell pi coins after successfully completing KYC
how can I sell pi coins after successfully completing KYC
DOT TECH
 
how to sell pi coins on Bitmart crypto exchange
how to sell pi coins on Bitmart crypto exchangehow to sell pi coins on Bitmart crypto exchange
how to sell pi coins on Bitmart crypto exchange
DOT TECH
 
PF-Wagner's Theory of Public Expenditure.pptx
PF-Wagner's Theory of Public Expenditure.pptxPF-Wagner's Theory of Public Expenditure.pptx
PF-Wagner's Theory of Public Expenditure.pptx
GunjanSharma28848
 
US Economic Outlook - Being Decided - M Capital Group August 2021.pdf
US Economic Outlook - Being Decided - M Capital Group August 2021.pdfUS Economic Outlook - Being Decided - M Capital Group August 2021.pdf
US Economic Outlook - Being Decided - M Capital Group August 2021.pdf
pchutichetpong
 
Intro_Economics_ GPresentation Week 4.pptx
Intro_Economics_ GPresentation Week 4.pptxIntro_Economics_ GPresentation Week 4.pptx
Intro_Economics_ GPresentation Week 4.pptx
shetivia
 

Recently uploaded (20)

managementaccountingunitiv-230422140105-dd17d80b.ppt
managementaccountingunitiv-230422140105-dd17d80b.pptmanagementaccountingunitiv-230422140105-dd17d80b.ppt
managementaccountingunitiv-230422140105-dd17d80b.ppt
 
Chương 6. Ancol - phenol - ether (1).pdf
Chương 6. Ancol - phenol - ether (1).pdfChương 6. Ancol - phenol - ether (1).pdf
Chương 6. Ancol - phenol - ether (1).pdf
 
what is the best method to sell pi coins in 2024
what is the best method to sell pi coins in 2024what is the best method to sell pi coins in 2024
what is the best method to sell pi coins in 2024
 
how to sell pi coins in all Africa Countries.
how to sell pi coins in all Africa Countries.how to sell pi coins in all Africa Countries.
how to sell pi coins in all Africa Countries.
 
where can I find a legit pi merchant online
where can I find a legit pi merchant onlinewhere can I find a legit pi merchant online
where can I find a legit pi merchant online
 
APP I Lecture Notes to students 0f 4the year
APP I  Lecture Notes  to students 0f 4the yearAPP I  Lecture Notes  to students 0f 4the year
APP I Lecture Notes to students 0f 4the year
 
how to sell pi coins effectively (from 50 - 100k pi)
how to sell pi coins effectively (from 50 - 100k  pi)how to sell pi coins effectively (from 50 - 100k  pi)
how to sell pi coins effectively (from 50 - 100k pi)
 
The secret way to sell pi coins effortlessly.
The secret way to sell pi coins effortlessly.The secret way to sell pi coins effortlessly.
The secret way to sell pi coins effortlessly.
 
innovative-invoice-discounting-platforms-in-india-empowering-retail-investors...
innovative-invoice-discounting-platforms-in-india-empowering-retail-investors...innovative-invoice-discounting-platforms-in-india-empowering-retail-investors...
innovative-invoice-discounting-platforms-in-india-empowering-retail-investors...
 
This assessment plan proposal is to outline a structured approach to evaluati...
This assessment plan proposal is to outline a structured approach to evaluati...This assessment plan proposal is to outline a structured approach to evaluati...
This assessment plan proposal is to outline a structured approach to evaluati...
 
how to sell pi coins on Binance exchange
how to sell pi coins on Binance exchangehow to sell pi coins on Binance exchange
how to sell pi coins on Binance exchange
 
Summary of financial results for 1Q2024
Summary of financial  results for 1Q2024Summary of financial  results for 1Q2024
Summary of financial results for 1Q2024
 
Turin Startup Ecosystem 2024 - Ricerca sulle Startup e il Sistema dell'Innov...
Turin Startup Ecosystem 2024  - Ricerca sulle Startup e il Sistema dell'Innov...Turin Startup Ecosystem 2024  - Ricerca sulle Startup e il Sistema dell'Innov...
Turin Startup Ecosystem 2024 - Ricerca sulle Startup e il Sistema dell'Innov...
 
Financial Assets: Debit vs Equity Securities.pptx
Financial Assets: Debit vs Equity Securities.pptxFinancial Assets: Debit vs Equity Securities.pptx
Financial Assets: Debit vs Equity Securities.pptx
 
What price will pi network be listed on exchanges
What price will pi network be listed on exchangesWhat price will pi network be listed on exchanges
What price will pi network be listed on exchanges
 
how can I sell pi coins after successfully completing KYC
how can I sell pi coins after successfully completing KYChow can I sell pi coins after successfully completing KYC
how can I sell pi coins after successfully completing KYC
 
how to sell pi coins on Bitmart crypto exchange
how to sell pi coins on Bitmart crypto exchangehow to sell pi coins on Bitmart crypto exchange
how to sell pi coins on Bitmart crypto exchange
 
PF-Wagner's Theory of Public Expenditure.pptx
PF-Wagner's Theory of Public Expenditure.pptxPF-Wagner's Theory of Public Expenditure.pptx
PF-Wagner's Theory of Public Expenditure.pptx
 
US Economic Outlook - Being Decided - M Capital Group August 2021.pdf
US Economic Outlook - Being Decided - M Capital Group August 2021.pdfUS Economic Outlook - Being Decided - M Capital Group August 2021.pdf
US Economic Outlook - Being Decided - M Capital Group August 2021.pdf
 
Intro_Economics_ GPresentation Week 4.pptx
Intro_Economics_ GPresentation Week 4.pptxIntro_Economics_ GPresentation Week 4.pptx
Intro_Economics_ GPresentation Week 4.pptx
 

Financial Forecasting

  • 1. Net Income indicator Cash Flow indicator Q1 Q2 Q3 Unit Volume 5040 6192 6624 Unit Price $20 $20 $20 Cost per Unit Sold $0.03 $0.03 $0.03 Gross Sales $100,800 $123,840 $132,480 (Cost of Goods Sold) $151.20 $185.76 $198.72 (Commission Percentage) 15% 15% 15% Net Sales $85,551 $105,106 $112,439 Unit Volume 3931.2 4829.76 5166.72 Unit Price $12 $12 $12 Cost per Unit Sold $1 $1 $1 Gross Sales $47,174 $57,957 $62,001 (Cost of Goods Sold) $3,931 $4,830 $5,167 (Commission Percentage) 0% 0% 0% Net Sales $43,243 $53,127 $56,834 Unit Volume 1512 1857.6 1987.2 Unit Price $20 $20 $20 Cost per Unit Sold $3.25 $3.25 $3.25 Gross Sales $30,240 $37,152 $39,744 (Cost of Goods Sold) $4,914 $6,037 $6,458 (Commission Percentage) 50% 50% 50% Net Sales $12,663 $15,557 $16,643 Sales Projections Year One Ticket Sales Beverages Merchandise
  • 2. Total Unit Volume 10,483 12,879 13,778 Total Gross Sales $178,214 $218,949 $234,225 (Total Cost of Goods Sold) $8,996 $11,053 $11,824 (Total Commissions Paid) $27,760 $34,106 $36,485 Total Net Sales $141,458 $173,791 $185,916 Assumptions: Merchanside (locked) 30% of ticket buyers buy merchandise Beverages (changeable) 78% of ticket buyers buy an average of 1 bevera Beverage Industry Average for U.S. Bar & Nightclub (estimate) 65% order drinks most to all the time with males ordering more frequently than f http://www.nciaa.com/content.aspx?page_id=22&club_id=160641&module_id=29898 The average consumer order 2.3 drinks per occasion with males ordering more than fem Total: All Products/Services
  • 3. Year One Q4 Q1 Q2 Q3 Q4 Total 7920 9216 11376 12240 13248 25,776 $20 $20 $20 $20 $20 $0.03 $0.03 $0.03 $0.03 $0.03 $158,400 $184,320 $227,520 $244,800 $264,960 $515,520 $237.60 $276.48 $341.28 $367.20 $397.44 15% 15% 15% 15% 15% $134,438 $156,437 $193,102 $207,768 $224,878 $437,535 6177.6 7188.48 8873.28 9547.2 10333.44 20,105 $12 $12 $12 $12 $12 $1 $1 $1 $1 $1 $74,131 $86,262 $106,479 $114,566 $124,001 $241,263 $6,178 $7,188 $8,873 $9,547 $10,333 0% 0% 0% 0% 0% - $67,954 $79,073 $97,606 $105,019 $113,668 $221,158 2376 2764.8 3412.8 3672 3974.4 7,733 $20 $20 $20 $20 $20 - $3.25 $3.25 $3.25 $3.25 $3.25 - $47,520 $55,296 $68,256 $73,440 $79,488 $154,656 $7,722 $8,986 $11,092 $11,934 $12,917 50% 50% 50% 50% 50% - $19,899 $23,155 $28,582 $30,753 $33,286 $64,762 Year Two ne FORECAST SUMM
  • 4. 16,474 19,169 23,662 25,459 27,556 53,614 $280,051 $325,878 $402,255 $432,806 $468,449 $911,439 $14,137 $16,451 $20,306 $21,848 $23,648 $46,010 $43,623 $50,762 $62,659 $67,418 $72,970 $141,974 $222,291 $258,665 $319,290 $343,540 $371,832 $723,455 s buy merchandise s buy an average of 1 beverages ng more frequently than females. Surprisingly, Millennials order less frequently than older consumers module_id=29898 ales ordering more than females and Millennials ordering more than the older consumers.
  • 5. (65,954) Year Two 2-Year Total Total 1 2 3 46,080 71,856 $668 $6,192 $6,624 - - Q2 vs. Q1 Q3 vs. Q2 - - 23% 7% $921,600 $1,437,120 Sales growing over time? - - 163% overall rate $782,185 $1,219,720 points for this dynamic (allocation) your growth points 35,942 56,048 Perfectly Exponential - Perfectly Linear - This Forecast $431,309 $672,572 As a proportion out of 100% points for this dynamic (allocation) - - your growth points $395,366 $616,524 YOUR TOTAL POINTS % Total Points Possible 13,824 21,557 Your Total Points - - - - $276,480 $431,136 - - $115,776 $180,538 Year One FORECAST SUMMARY
  • 6. 95,846 149,460 $1,629,389 $2,540,828 $82,253 $128,263 $253,809 $395,783 $1,293,327 $2,016,782 ently than older consumers
  • 7. 4 5 6 7 8 $7,920 $9,216 $11,376 $12,240 $13,248 12580 Q4 vs. Q3 Q1 vs. Q4 Q2 vs. Q1 Q3 vs. Q2 Q4 vs. Q3 20% 16% 23% 8% 8% LINEST g over time? 1 1593.476 s dynamic (allocation) 25% 25% L/S = 2 L/S = 1 L/S = 0.89 on out of 100% 44% s dynamic (allocation) 75% 33% L POINTS % 58% 10 al Points 6 One Year Two
  • 8.
  • 10.
  • 11. Brochures, flyers, Mobile signs, bus/metro signs, billboards $0 Samples, premiums, logo merchandise, "swag" Print: newspaper, magazines Television, radio Television, radio Banner Ads, Paid Search Engine Marketing Paid Facebook promotions, Twitter ads, Linkedin ads Social media contests, Deal-of-the-day: Groupon, Google Offers, LivingSocial Tweetups, Meetups Sticker bombing, flyposting, Flashmobs, streetart Street teams, campus promotions, Crowd-sourced ads Launch party, Memberships, meetings, Entertaining Clients Wrapped vehicles, food trucks, booths, exhibits, signs Design, development, programming Maintenance, hosting, domains Marketing, Public Relations Branding, Advertising $0 Trade Shows, Events, Street Promotions Website Professional Assistance & Consultants TOTAL Marketing Budget Purpose (optonal) Tangible Marketing Media Advertising Social Media Marketing Guerilla & Viral Marketing Networking & Client Development Activities Purpose/Strategy Key: (Optional) PB: Personal Branding BA: Brand Awareness/Brand Building SP: Product/Service Sampling, Trial L&R: Brand Loyalty/Customer Rewards Pre-Launch
  • 12. Q1 Q2 Q3 Q4 Q1 Q2 Q3 $2,575 $2,500 $1,000 $1,145 $1,300 $2,000 $1,455 $5,250 $2,000 $1,950 $1,400 $1,000 $1,000 $1,200 $2,500 $1,800 $2,500 $1,790 $1,000 $1,000 $1,560 $9,615 $5,800 $5,450 $5,200 $3,000 $4,955 $3,905 Year Two Year One
  • 13. Q4 $7,220 $0 $1,275 $6,030 $0 $0 $1,000 $14,800 $0 $3,000 $9,800 $0 $0 $5,350 $0 $0 $0 $0 $0 $0 $5,275 $43,200 Two Total
  • 14. Pre-Launch $14,984 $65,000 $220,000 $12,500 $24,500 $16,500 $353,484 Company Vehicles Research and Development Costs TOTAL Capital Expenses Capital Expenses Office Equipment, Furniture, and Supplies Remodeling Needs Industry Specific Supplies and Technical Equipment Licensing Needs (liquor license etc)
  • 15. Year 1 Year 2 $1,500 $1,500 $2,000 $5,500 $15,000 $24,500 $975 $1,075 $1,225 $1,225 $8,800 $8,800 $29,500 $42,600
  • 16. 2Live Venue Pre-Launch Q1 Q2 $0 $141,458 $173,791 Capital expenses $353,484 $29,500 $0 Salaries and wages $84,067 $126,100 $126,100 Employee benefits $0 $0 Payroll taxes $12,610 $18,915 $18,915 Accounting Services $1,025 $1,025 Rent $8,000 $8,000 Maintenance $1,000 $1,000 Legal $9,000 $375 $375 Insurance $1,217 $1,825 $1,825 Utilities $1,000 $1,500 $1,700 Internet & public wifi $1,995 $175 $175 Telephone service $75 $75 $75 Filing fees $450 Postage and shipping $250 Marketing $0 $9,615 $5,800 Travel $2,500 $2,500 $2,500 Entertainment $3,500 $1,500 $1,500 Bank Fees $0 $470,147 $202,105 $168,990 Operating Profit (470,147) (60,647) 4,801 Provision for taxes 0 0 264 (470,147) (60,647) 4,537 EXPENSES TOTAL EXPENSES NET PROFIT Income Statement Year 1 INCOME (NET SALES)
  • 17. Q3 Q4 Quarter 1 Quarter 2 Quarter 3 Quarter 4 $185,916 $222,291 $258,665 $319,290 $343,540 $371,832 $0 $0 $42,600 $0 $0 $0 $126,100 $126,100 $157,625 $157,625 $157,625 $157,625 $0 $0 $0 $0 $0 $0 $18,915 $18,915 $23,644 $23,644 $23,644 $23,644 $1,025 $1,025 $1,025 $1,025 $1,025 $1,025 $8,000 $8,000 $8,000 $8,000 $8,000 $8,000 $1,000 $1,000 $1,000 $1,000 $1,000 $1,000 $375 $375 $375 $375 $375 $375 $1,825 $1,825 $1,825 $1,825 $1,825 $1,825 $1,800 $1,500 $1,500 $1,700 $1,800 $1,500 $175 $175 $175 $175 $175 $175 $75 $75 $75 $75 $75 $75 $5,450 $5,200 $3,000 $4,955 $3,905 $5,275 $2,500 $2,500 $10,000 $10,000 $10,000 $300 $1,500 $1,500 $1,500 $1,500 $1,500 $1,500 $168,740 $168,190 $252,344 $211,899 $210,949 $202,319 17,176 54,101 6,322 107,391 132,591 169,513 945 2,976 348 5,907 7,293 9,323 16,231 51,125 5,974 101,485 125,299 160,190 Year 1 Year Two
  • 18. Year One Year Two Y1 Total Y2 Total 2-Year Total $723,455 $1,293,327 $2,016,782 $0 $42,600 $42,600 $504,400 $630,500 $1,134,900 $0 $0 $0 $75,660 $94,575 $170,235 $4,100 $4,100 $8,200 $32,000 $32,000 $64,000 $4,000 $4,000 $8,000 $1,500 $1,500 $3,000 $7,300 $7,300 $14,600 $6,500 $6,500 $13,000 $700 $700 $1,400 $300 $300 $600 $0 $0 $0 $0 $0 $0 $26,065 $17,135 $43,200 $10,000 $30,300 $40,300 $6,000 $6,000 $12,000 $0 $0 $0 $0 $0 $0 $0 $0 $0 $678,525 $834,910 $1,513,435 15,430 415,817 $431,247 849 22,870 $23,719 (458,902) 392,947 (65,954) Is this number positive? FORECAST SUMMARY
  • 19. Pre-Launch Q1 Q2 Q3 Q4 Starting Balance $0 $127,853 $67,418 $70,280 $84,021 Cash Ins Net sales $141,458 $173,791 $185,916 $222,291 Investments $672,000 Loans Interest income $213 $112 $117 $140 Owner contributions $66,000 TOTAL CASH INS $738,000 $141,671 $173,903 $186,033 $222,431 Cash Outs Operating expenses $470,147 $202,105 $168,990 $168,740 $168,190 Loan payments Tax payments $0 $0 $2,052 $3,551 $3,315 Contingency fund $140,000 Owner's draw (Entrepreneur) Investor's draw Other: Other: Other: Other: Other: Other: TOTAL CASH OUTS $610,147 $202,105 $171,042 $172,291 $171,505 Year 1 Cash Flow
  • 20. CASH AT END OF MONTH 127,853 67,418 70,280 84,021 134,947
  • 21. Q1 Q2 Q3 Q4 $134,947 $139,383 $191,596 $318,213 $258,665 $319,290 $343,540 $371,832 $225 $232 $319 $530 $258,890 $319,522 $343,859 $372,362 $252,344 $211,899 $210,949 $202,319 $2,110 $5,411 $6,293 $7,457 $50,000 $50,000 $254,454 $267,310 $217,242 $259,776 Year 2
  • 23. Investment Amount ($) Equity Offered (%) Private Investor $672,000 25% Contribution Amount ($) Equity Retained (%) Owner $66,000 75% Total Capital Raised EQUITY OWNERSHIP % $672,000 25% $66,000 75% $738,000 100% Outside Investors Owners TOTAL Capital Investment aka "Shark Tank" Page Investor Name Owner Name TOTAL INVESTMENTS The Total Investment Amount (Capital) should be theamount of thelargest negative number on your Cash Flow Statement (theamount of cash you need to eliminateany and all negative cash balances throughout thetwo years whileyour business is breaking even.