
Recommended
More Related Content
Similar to Financial statements
Similar to Financial statements (20)
Recently uploaded
Recently uploaded (20)
Financial statements
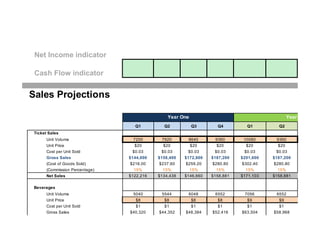
- 1. Net Income indicator Cash Flow indicator Q1 Q2 Q3 Q4 Q1 Q2 Unit Volume 7200 7920 8640 9360 10080 9360 Unit Price $20 $20 $20 $20 $20 $20 Cost per Unit Sold $0.03 $0.03 $0.03 $0.03 $0.03 $0.03 Gross Sales $144,000 $158,400 $172,800 $187,200 $201,600 $187,200 (Cost of Goods Sold) $216.00 $237.60 $259.20 $280.80 $302.40 $280.80 (Commission Percentage) 15% 15% 15% 15% 15% 15% Net Sales $122,216 $134,438 $146,660 $158,881 $171,103 $158,881 Unit Volume 5040 5544 6048 6552 7056 6552 Unit Price $8 $8 $8 $8 $9 $9 Cost per Unit Sold $1 $1 $1 $1 $1 $1 Gross Sales $40,320 $44,352 $48,384 $52,416 $63,504 $58,968 Year Two Sales Projections Year One Ticket Sales Beverages
- 2. (Cost of Goods Sold) $5,040 $5,544 $6,048 $6,552 $7,056 $6,552 (Commission Percentage) 0% 0% 0% 0% 0% 0% Net Sales $35,280 $38,808 $42,336 $45,864 $56,448 $52,416 Unit Volume 2160 2376 2592 2808 3024 2808 Unit Price $15 $15 $15 $15 $15 $15 Cost per Unit Sold $3.25 $3.25 $3.25 $3.25 $3.25 $3.25 Gross Sales $32,400 $35,640 $38,880 $42,120 $45,360 $42,120 (Cost of Goods Sold) $7,020 $7,722 $8,424 $9,126 $9,828 $9,126 (Commission Percentage) 50% 50% 50% 50% 50% 50% Net Sales $12,690 $13,959 $15,228 $16,497 $17,766 $16,497 Total Unit Volume 14,400 15,840 17,280 18,720 20,160 18,720 Total Gross Sales $216,720 $238,392 $260,064 $281,736 $310,464 $288,288 (Total Cost of Goods Sold) $12,276 $13,504 $14,731 $15,959 $17,186 $15,959 (Total Commissions Paid) $34,258 $37,683 $41,109 $44,535 $47,961 $44,535 Total Net Sales $170,186 $187,205 $204,224 $221,242 $245,317 $227,794 Assumptions: Merchanside (locked) 30% of ticket buyers buy merchandise Beverages (changeable) 70% of ticket buyers buy an average of 1 beverages Beverage Industry Average for U.S. Bar & Nightclub (estimate) 65% order drinks most to all the time with males ordering more frequently than females. Surprisingly, Millenni http://www.nciaa.com/content.aspx?page_id=22&club_id=160641&module_id=29898 Total: All Products/Services Merchandise
- 3. The average consumer order 2.3 drinks per occasion with males ordering more than females and Millennials ordering m
- 4. (187,914) Year One Year Two 2-Year Total Q3 Q4 Total Total 1 2 12240 13680 33,120 45,360 78,480 $668 $7,920 $20 $20 - - Q2 vs. Q1 $0.03 $0.03 - - 10% $244,800 $273,600 $662,400 $907,200 $1,569,600 $367.20 $410.40 Sales growing over time? 15% 15% - - 90% $207,768 $232,211 $562,195 $769,963 $1,332,159 points for this dynamic (allocatio your growth points 8568 9576 23,184 31,752 54,936 Perfectly Exponential $9 $9 - Perfectly Linear $1 $1 - This Forecast $77,112 $86,184 $185,472 $285,768 $471,240 As a proportion out of 100% Year One Year Two FORECAST SUMMARY
- 5. $8,568 $9,576 points for this dynamic (allocatio 0% 0% - - - your growth points $68,544 $76,608 $162,288 $254,016 $416,304 YOUR TOTAL POINTS % Total Points Possible 3672 4104 9,936 13,608 23,544 Your Total Points $15 $15 - - - $3.25 $3.25 - - - $55,080 $61,560 $149,040 $204,120 $353,160 $11,934 $13,338 50% 50% - - - $21,573 $24,111 $58,374 $79,947 $138,321 24,480 27,360 66,240 90,720 156,960 $376,992 $421,344 $996,912 $1,397,088 $2,394,000 $20,869 $23,324 $56,470 $77,339 $133,808 $58,238 $65,089 $157,585 $215,823 $373,408 $297,885 $332,930 $782,857 $1,103,926 $1,886,784 rprisingly, Millennials order less frequently than older consumers
- 6. llennials ordering more than the older consumers.
- 7. 3 4 5 6 7 8 slope $8,640 $9,360 $10,080 $9,360 $12,240 $13,680 13012 7 1,858.86 Q3 vs. Q2 Q4 vs. Q3 Q1 vs. Q4 Q2 vs. Q1 Q3 vs. Q2 Q4 vs. Q3 9% 8% 8% -7% 31% 12% LINEST SLOPE L/S Sales growing over time? 1 1375.762 1,859 1 overall rate oints for this dynamic (allocation) 25% our growth points 25% Perfectly Exponential L/S = 2 Perfectly Linear L/S = 1 his Forecast L/S = 0.74 As a proportion out of 100% 37% Year One Year Two
- 8. oints for this dynamic (allocation) 75% our growth points 28% YOUR TOTAL POINTS % 53% otal Points Possible 10 Your Total Points 5
- 10. Brochures, flyers, Mobile signs, bus/metro signs, billboards $0 Samples, premiums, logo merchandise, "swag" Print: newspaper, magazines Television, radio Television, radio Banner Ads, Paid Search Engine Marketing Paid Facebook promotions, Twitter ads, Linkedin ads Social media contests, Deal-of-the-day: Groupon, Google Offers, LivingSocial Tweetups, Meetups $5,000 Sticker bombing, flyposting, Flashmobs, streetart Street teams, campus promotions, Crowd-sourced ads $5,000 Launch party, Memberships, meetings, Entertaining Clients Wrapped vehicles, food trucks, booths, exhibits, signs Design, development, programming Maintenance, hosting, domains Marketing, Public Relations Branding, Advertising $10,000 TOTAL Marketing Budget Purpose (optonal) Tangible Marketing Media Advertising Social Media Marketing Guerilla & Viral Marketing Networking & Client Development Activities Purpose/Strategy Key: (Optional) PB: Personal Branding BA: Brand Awareness/Brand Building SP: Product/Service Sampling, Trial L&R: Brand Loyalty/Customer Rewards Pre-Launch Trade Shows, Events, Street Promotions Website Professional Assistance & Consultants
- 11. Q1 Q2 Q3 Q4 Q1 Q2 Q3 $2,400 $2,400 $2,400 $2,400 $2,400 $2,400 $2,250 $1,600 $1,600 $1,600 $1,600 $1,750 $1,750 $2,200 $4,000 $4,000 $4,000 $4,000 $4,150 $4,150 $4,450 Year One Year Two
- 12. Q4 $0 $0 $0 $0 $0 $0 $0 $0 $2,250 $23,900 $0 $2,200 $19,300 $0 $0 $0 $0 $0 $0 $4,450 $43,200 Two Total
- 13. Pre-Launch $14,984 $65,000 $220,000 $12,500 $24,500 $16,500 $353,484 Company Vehicles Research and Development Costs TOTAL Capital Expenses Capital Expenses Office Equipment, Furniture, and Supplies Remodeling Needs Industry Specific Supplies and Technical Equipment Licensing Needs (liquor license etc)
- 14. Year 1 Year 2 $1,500 $1,500 $2,000 $5,500 $15,000 $24,500 $975 $1,075 $1,225 $1,225 $8,800 $8,800 $29,500 $42,600
- 15. 2Live Venue Pre-Launch Q1 Q2 $0 $170,186 $187,205 Capital expenses $353,484 $29,500 $0 Salaries and wages $84,067 $126,100 $126,100 Employee benefits $0 $0 Payroll taxes $12,610 $18,915 $18,915 Accounting Services $1,025 $1,025 Rent $8,000 $8,000 Maintenance $1,000 $1,000 Legal $9,000 $375 $375 Insurance $1,217 $1,825 $1,825 Utilities $1,000 $1,500 $1,700 Internet & public wifi $1,995 $175 $175 Telephone service $75 $75 $75 Filing fees $450 Postage and shipping $250 Marketing $10,000 $4,000 $4,000 Travel $2,500 $2,500 $2,500 Entertainment $3,500 $1,500 $1,500 Bank Fees $0 $480,147 $196,490 $167,190 Operating Profit (480,147) (26,304) 20,015 Provision for taxes 0 0 1,101 (480,147) (26,304) 18,914 INCOME (NET SALES) EXPENSES TOTAL EXPENSES NET PROFIT Income Statement Year 1
- 16. Q3 Q4 Quarter 1 Quarter 2 Quarter 3 Quarter 4 $204,224 $221,242 $245,317 $227,794 $297,885 $332,930 $0 $0 $42,600 $0 $0 $0 $126,100 $126,100 $157,625 $157,625 $157,625 $157,625 $0 $0 $0 $0 $0 $0 $18,915 $18,915 $23,644 $23,644 $23,644 $23,644 $1,025 $1,025 $1,025 $1,025 $1,025 $1,025 $8,000 $8,000 $8,000 $8,000 $8,000 $8,000 $1,000 $1,000 $1,000 $1,000 $1,000 $1,000 $375 $375 $375 $375 $375 $375 $1,825 $1,825 $1,825 $1,825 $1,825 $1,825 $1,800 $1,500 $1,500 $1,700 $1,800 $1,500 $175 $175 $175 $175 $175 $175 $75 $75 $75 $75 $75 $75 $4,000 $4,000 $4,150 $4,150 $4,450 $4,450 $2,500 $2,500 $10,000 $10,000 $10,000 $300 $1,500 $1,500 $1,500 $1,500 $1,500 $1,500 $167,290 $166,990 $253,494 $211,094 $211,494 $201,494 36,934 54,252 (8,177) 16,701 86,391 131,436 2,031 2,984 0 919 4,752 7,229 34,902 51,268 (8,177) 15,782 81,640 124,207 Year Two Year 1
- 17. Year One Year Two Y1 Total Y2 Total 2-Year Total $782,857 $1,103,926 $1,886,784 $0 $42,600 $42,600 $504,400 $630,500 $1,134,900 $0 $0 $0 $75,660 $94,575 $170,235 $4,100 $4,100 $8,200 $32,000 $32,000 $64,000 $4,000 $4,000 $8,000 $1,500 $1,500 $3,000 $7,300 $7,300 $14,600 $6,500 $6,500 $13,000 $700 $700 $1,400 $300 $300 $600 $0 $0 $0 $0 $0 $0 $16,000 $17,200 $33,200 $10,000 $30,300 $40,300 $6,000 $6,000 $12,000 $0 $0 $0 $0 $0 $0 $0 $0 $0 $668,460 $834,975 $1,503,435 84,897 226,351 $311,249 4,669 12,449 $17,119 (401,366) 213,452 (187,914) Is this number positive? FORECAST SUMMARY
- 18. Pre-Launch Q1 Q2 Q3 Q4 Starting Balance $0 $79,853 $53,682 $71,735 $105,237 Cash Ins Net sales $170,186 $187,205 $204,224 $221,242 Investments $200,000 Loans Interest income $133 $89 $120 $175 Owner contributions $500,000 TOTAL CASH INS $700,000 $170,319 $187,295 $204,343 $221,418 Cash Outs Operating expenses $480,147 $196,490 $167,190 $167,290 $166,990 Loan payments Tax payments $0 $0 $2,052 $3,551 $3,315 Contingency fund $140,000 Owner's draw (Entrepreneur) Investor's draw Other: Other: Other: Other: Other: Other: TOTAL CASH OUTS $620,147 $196,490 $169,242 $170,841 $170,305 Year 1 Cash Flow
- 19. CASH AT END OF MONTH 79,853 53,682 71,735 105,237 156,349
- 20. Q1 Q2 Q3 Q4 $156,349 $146,323 $107,856 $188,134 $245,317 $227,794 $297,885 $332,930 $261 $244 $180 $314 $245,578 $228,038 $298,065 $333,244 $253,494 $211,094 $211,494 $201,494 $2,110 $5,411 $6,293 $7,457 $50,000 $50,000 $255,604 $266,505 $217,787 $258,951 Year 2
- 21. 146,323 107,856 188,134 262,426
- 22. Investment Amount ($) Private Investor $200,000 Contribution Amount ($) Owner $500,000 Total Capital Raised $200,000 $500,000 $700,000 Outside Investors Owners TOTAL Capital Investment aka "Shark Tank" Page Investor Name Owner Name TOTAL INVESTMENTS The Total Investment Amount (Capital) should be theamount of thelargest negative number on your Cash Flow Statement (theamount of cash you need to eliminateany and all negative cash balances throughout thetwo years whileyour business is breaking even.
- 23. Equity Offered (%) 25% Equity Retained (%) 75% EQUITY OWNERSHIP % 25% 75% 100% Capital) should be ative number on eamount of cash all negative cash years whileyour Are you raising capital from an investor? If so, enter theamount you'll need from them here. Then enter the percentage of your If you chooseto raise smaller amounts of capital with crowdfun donations, remember that the$ is donated and no equity % is g away. START HERE and decide how much ofthe total will come from own money. This sends a positivepsychological signal to invest that you believe in your idea. In addition, thesesharks assume t themore money you invested, the harder you will work to mak business a success. COME BACK LATER and enter theamount ofequity you own, af you've decided how much equity you'll begiving up to an invest