Downloaded 15 times


![ArgonPro
consulting
training
9
ArgonPro QuickAnalysis
• Argon Pro has built QuickAnalysis model by which first-stage (preliminary)
analysis can be obtained without more time-consuming business modeling.
• QuickAnalysis requires only 8 cash flow based variables. Using those variables
you will be able to receive first, but still preliminary, estimates about the cash flow
and value creation potetial of the business. In QuickAnalysis you can also utilize
various scenarios and sensitivity analysis. It will also give you first estimates
about the minimum operating profit level needed.
2.
Operating
profit
(eur)
Operating profit
of last fiscal year
1.
Revenue
(eur)
Revenue of
last fiscal year
3.
Revenue
growth
(%)
Forecasted growth
in revenue
4.
Operating
profit (%)
Forecasted
operating profit
margin
6.
Working
capital
(%)
Growth in revenue
increases need for
working capital
5.
Investments
(%)
Investments above
depreciations are
growth investments
7.
Taxes (%)
Calculatory
taxes on
operating profit
8.
Cost of
Capital (%)
Weighted average
cost of capital,
WACC
Variables used in QuickAnalysis 1]
1] Example of QuickAnalysis in next two pages](https://image.slidesharecdn.com/exampleanalysis-170131151503/85/APExampleAnalysis-9-320.jpg)
![ArgonPro
consulting
training
10
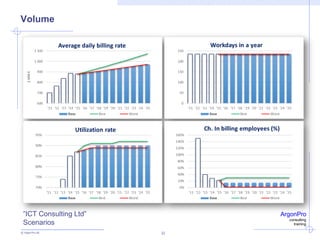
ArgonPro QuickAnalysis - Case ”ICT Consulting Ltd”
ArgonPro QuickAnalysis (5 years) WORST BASE BEST
Last historical revenue (1.000 eur) 1 979 1 979 1 979
Last historical operating profit (1.000 eur) 281 281 281 143
Revenue growth rate (%) 2 % -87 % 15 % 100 % 30 % 97 %
Operating profit margin (%) 13 % -13 % 15 % -7 % 14 % 13 %
Incremental fixed capital investments (%) 7 % 40 % 5 % 20 % 6 % 5 %
Incremental working capital investments (%) 5 % 0 % 5 % 200 % 15 % 14 %
Taxes on operating profit (%) 20 % 0 % 20 % 0 % 20 %
Cost of Capital, WACC (%) 9 % 13 % 8 % -13 % 7 %
Pre-strategy value (pre net debt) 2 495 2 807 3 208
Cumulative present value of cash flows 828 -35 % 1 283 -9 % 1 171
Present value of residual value 1 641 -60 % 4 064 106 % 8 383
Present value of cash flows + Residual value 2 469 -54 % 5 347 79 % 9 553
Market value of cash 223,9 0 % 223,9 0 % 223,9
Market value of debt 0,0 0,0 0,0
SHAREHOLDER VALUE 2 693 -52 % 5 570 76 % 9 777
SHAREHOLDER VALUE ADDED (SVA) -26 -101 % 2 539 150 % 6 345
Incremental threshold margin 1,2 % 34 % 0,9 % 85 % 1,7 %
Threshold margin 13,9 % 12 % 12,5 % -9 % 11,3 %
Scenarios
History
Avg.
30 % 20 % 10 % 0 % -10 %
13 % 225 196 207 257 347
15 % 255 230 243 297 390
17 % 285 263 280 336 433
-5 % 5 % 15 % 25 % 35 %
One Year cash flow sensitivity
Operatingprofit(%)
Incr. fixed and working capital per euro of revenue
Revenue growth
3 scenarios
8 variables needed
Value
creation
Value +
change
Thresholds
for operating
margin
Base Case
Cash flow
sensitivity
1 euro growth in
revenue ties 0,15 euros
in working capital
1 euro growth in
revenue costs 0,06
euros as investments
1]
1] Cost of capital (WACC) is important part of performance
management and valuation. Definition of cost of capital requires
always detailed analysis. Due to simplification cost of capital in
this example is 8%.](https://image.slidesharecdn.com/exampleanalysis-170131151503/85/APExampleAnalysis-10-320.jpg)


![ArgonPro
consulting
training
35
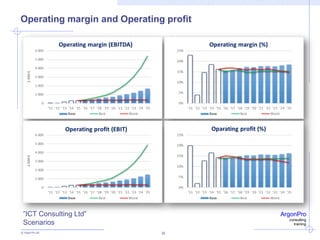
Value Creation and value gaps - ”ICT Consulting Ltd”
1] Pre-strategy value based on performance in history
2] 31.12.2015
Possibilities for value creation
(if/when scenario/strategy is
implemented)
Value gaps should be
closed and eliminated with
a detailed and realistic plan
(exit plan)*]
*]](https://image.slidesharecdn.com/exampleanalysis-170131151503/85/APExampleAnalysis-35-320.jpg)
![ArgonPro
consulting
training
36
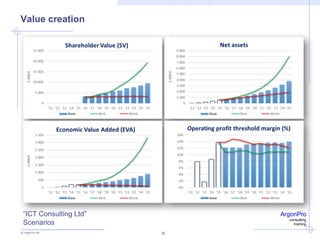
Sensitivity Analysis - ”ICT Consulting Ltd”
The effect of percent or percent
unit change in Base Case value
1]
1] Cost of capital (WACC) is important part of performance management and valuation. Definition of cost of
capital requires always detailed analysis. Due to simplification cost of capital in this example is 8%](https://image.slidesharecdn.com/exampleanalysis-170131151503/85/APExampleAnalysis-36-320.jpg)


This document outlines the advantages and methodologies of cash flow-based business modeling and analysis, specifically using the case of 'ICT Consulting Ltd.' It discusses key performance measures, financial scenarios, and the implications for growth and profitability that the company's founders, Peter and Martin, considered. Additionally, it emphasizes the importance of quick analysis tools and understanding value drivers in decision-making for start-ups and SMEs.


