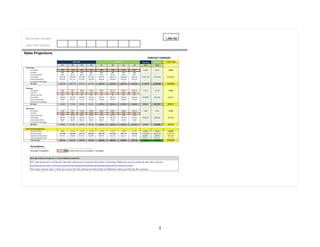
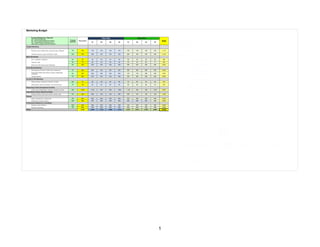
1) Net income for the period was $1,305,162 with projected sales growth over two years totaling $3,464,640.
2) Expenses were projected to be $1,505,335 over two years including capital expenses, salaries, marketing costs and other operational expenses.
3) The projections showed positive cash flow and net profits increasing each period, with a starting balance of $0 and ending balance after two years of $2,579,578.
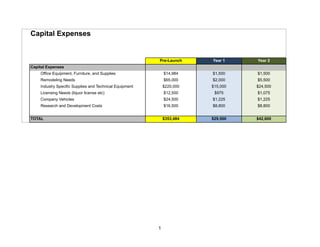
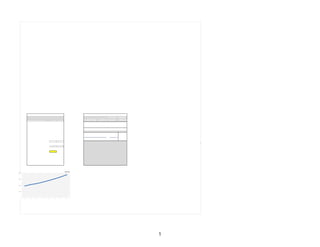
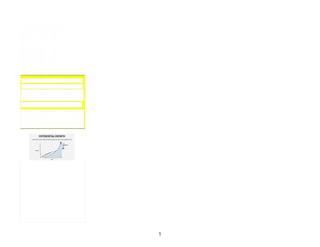
![Capital Investment
aka "Shark Tank" Page
Investor Name Investment Amount ($) Equity Offered (%)
Private Investor $550,000 20%
Owner Name Contribution Amount ($) Equity Retained (%)
Owner $400,000 80%
TOTAL INVESTMENTS Total Capital Raised EQUITY OWNERSHIP
%
Outside Investors $550,000 20%
Owners $400,000 80%
TOTAL $950,000 100%
The Total Investment Amount (Capital) should be
the amount of the largest negative number on your
Cash Flow Statement (the amount of cash you need
to eliminate any and all negative cash balances
throughout the two years while your business is
breaking even.
Are you raising capital from an investor? If so, enter the amount you'll
need from them here. Then enter the percentage of your company
you're willing to give up in exchange.
If you choose to raise smaller amounts of capital with crowdfunding
donations, remember that the $ is donated and no equity % is given
away.
START HERE and decide how much of the total will come from your
own money. This sends a positive psychological signal to investors
that you believe in your idea. In addition, these sharks assume that
the more money you invested, the harder you will work to make the
business a success.
COME BACK LATER and enter the amount of equity you own, after
you've decided how much equity you'll be giving up to an investor.
This Capital Investment page SHOULD NOT BE COMPLETED UNTIL AFTER you have successfully achieved Goal #1 -
having already completed Sales Projections and spent your total Marketing Budget.
Now you're ready to achieve Goal #2 and finish this assignment.
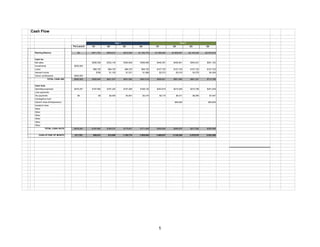
Goal #2 is as follows: Ensure your new business will not run out of cash while you are trying to make it profitable.
Where do you go to monitor the cash position of your entertainment business and ensure that it will have
sufficient cash over the entire two-year forecast period? To the Cash Flow Statement! It's like a bank savings
account balance and you should treat it as such.
By the time you're done with your forecast, there cannot be even a single negative end-of-period balance on your
Cash Flow Statement.
How do you modify the Cash Flow Statement? Well, technically you won't change that. You'll be modifying this
page [Capital Investment], by entering a Shark-Tank-style venture pitch OFFER.
IT'S A TRIAL-AND-ERROR PROCESS, and you'll want to click back and forth from this Capital Investment page to
your Cash Flow Statement, and continue to make changes until you successfully reach Goal #2.
Notice that this page has a space for your (the owner/entrepreneur) up-front contribution to the venture - as
well as how much money you need from an investor.
One of the first questions routinely asked by a "Shark Tank" Investor is "How much money have you put into your
own business?"
Enter the amount you'll need from them in the "Contribution Amount" cell. Then enter the percentage of your
company you're willing to give up in exchange, and the remainder percentage leftover needs to be entered, so that
the Total under the "Equity Ownership" is equal to 100%.
On this page you will need to show an offer that includes both an Investment Amount as well as the Owner
Contribution, just like you would in a "Shark Tank" pitch.
The most important reasons you should develop a financial forecast for your startup is both to prove it to yourself
that you have a profitable ("viable") business model, and also To Discover, with a great deal of confidence, HOW
MUCH MONEY this business model needs / requires up-front, from an outside sourece, so that The Total
Investment Amounts from an Investor plus The Total Contribution from You (the owner/entrepreneur) will ADD
TOGETHER and TOTAL THE EXACT AMOUNT OF THE SHORTFALL on your Cash-Flow Statement.
In other words, the TOTAL CAPITAL RAISED on this page must be sufficiently large enough to completely eliminate
the shortfall you most likely had, at the moment you completed Goal #1. Once Goal #2 is reached, the business will
1](https://image.slidesharecdn.com/ortizalayshafinancialforecasting2023pdf-230725005541-23212503/85/Financial-Forecasting-6-320.jpg)