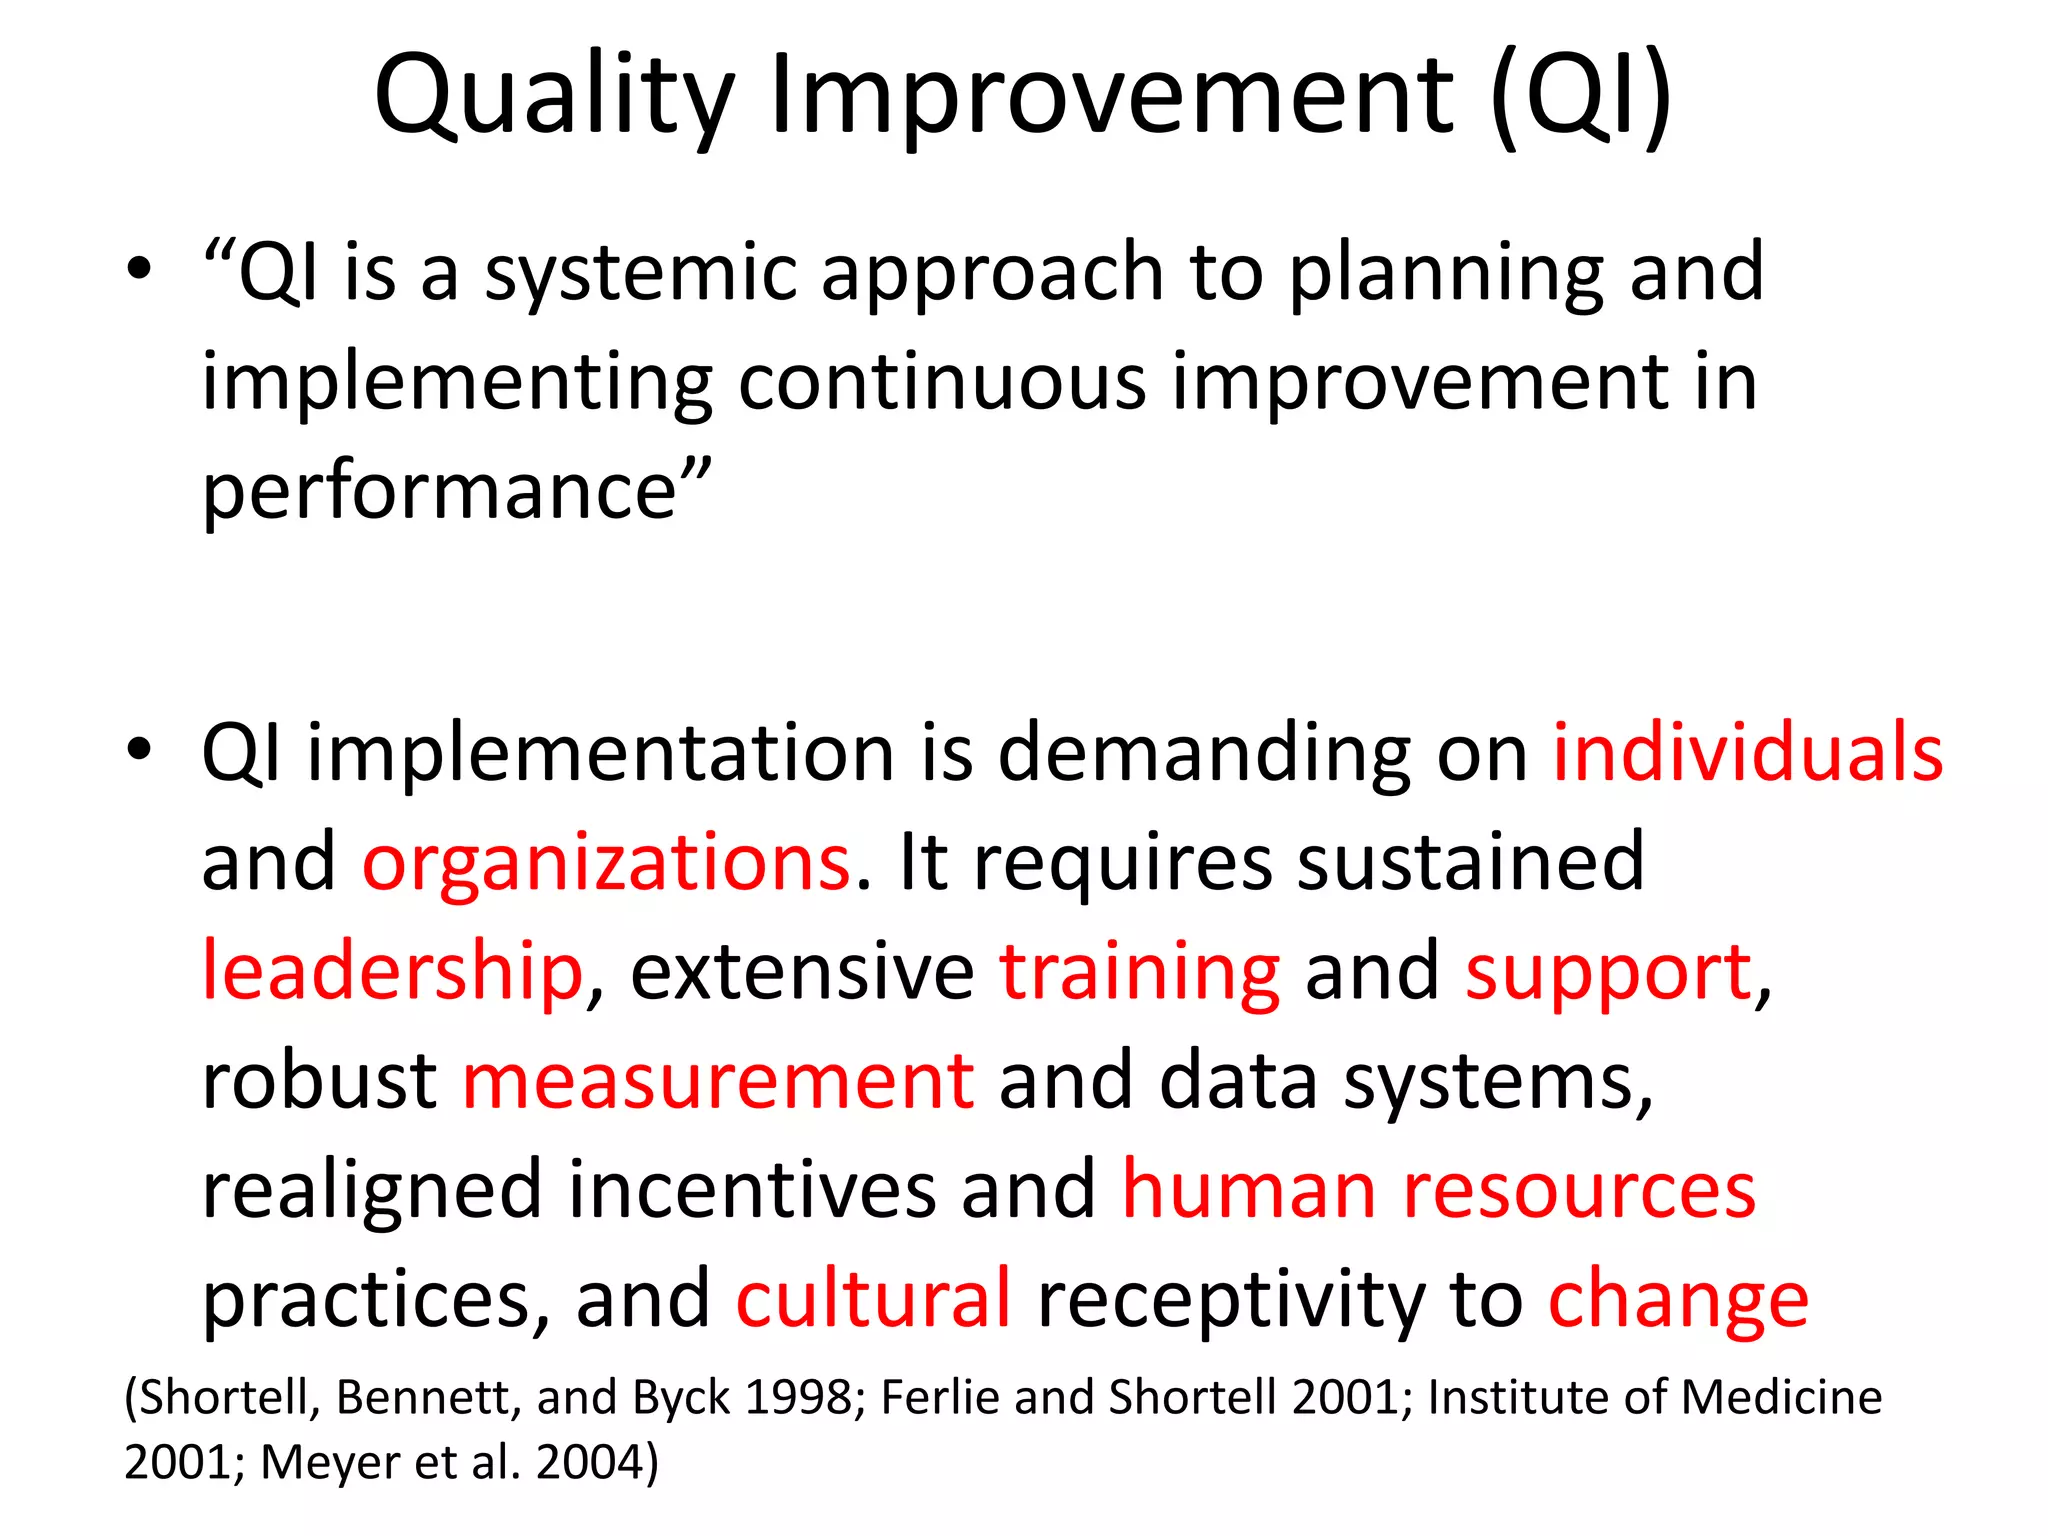
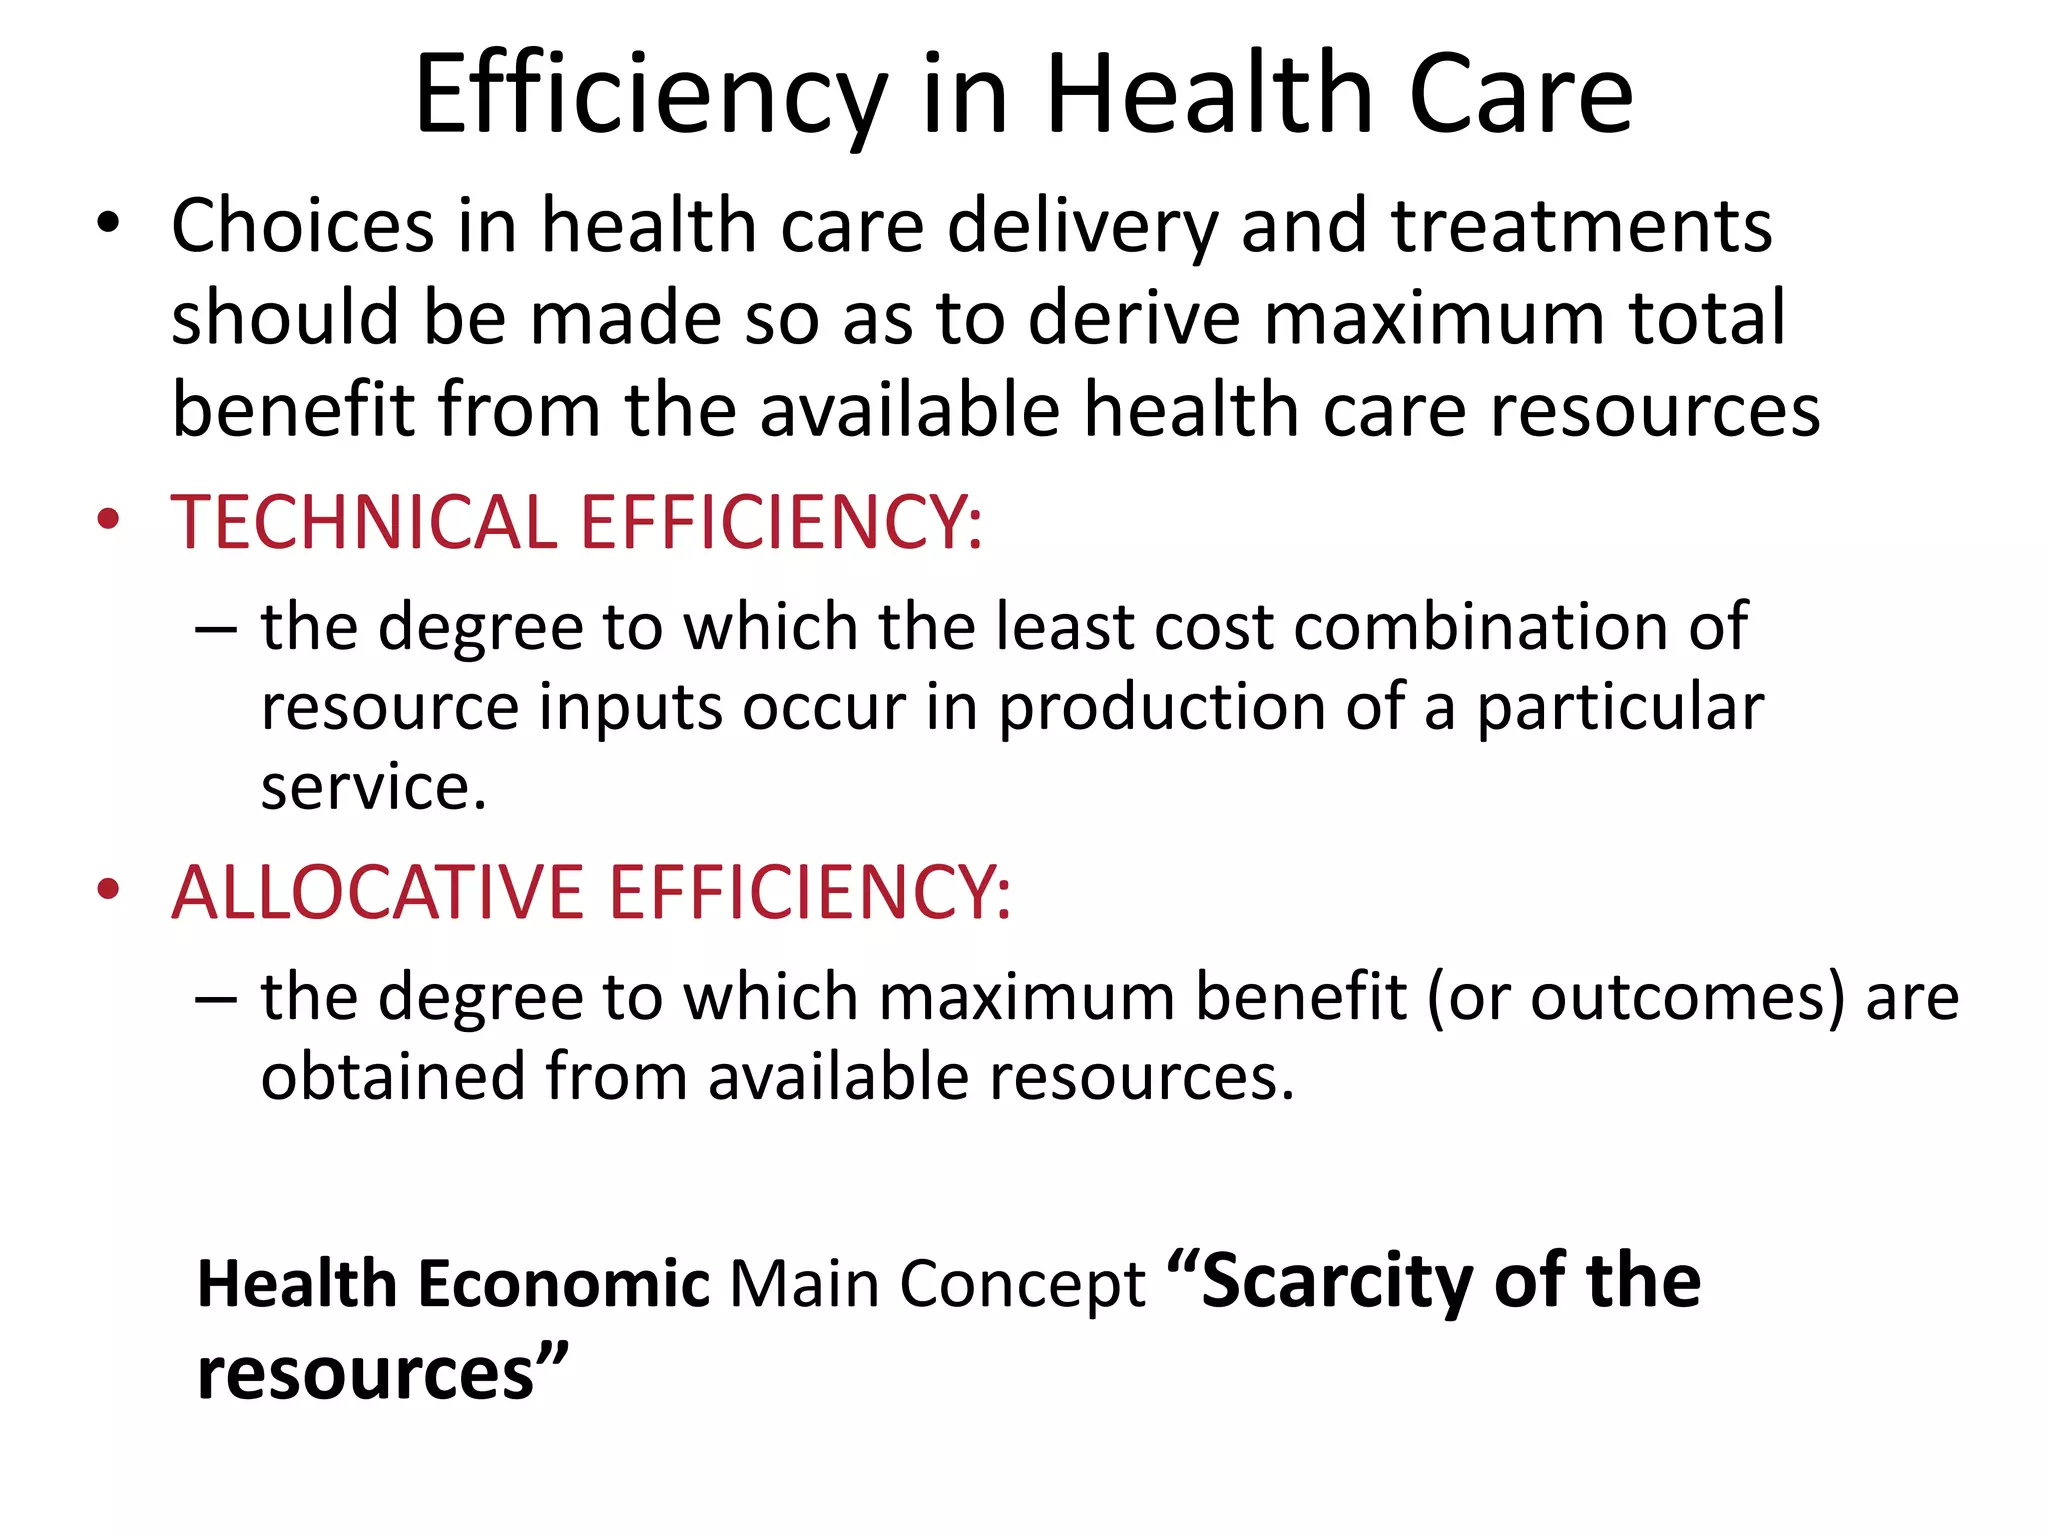
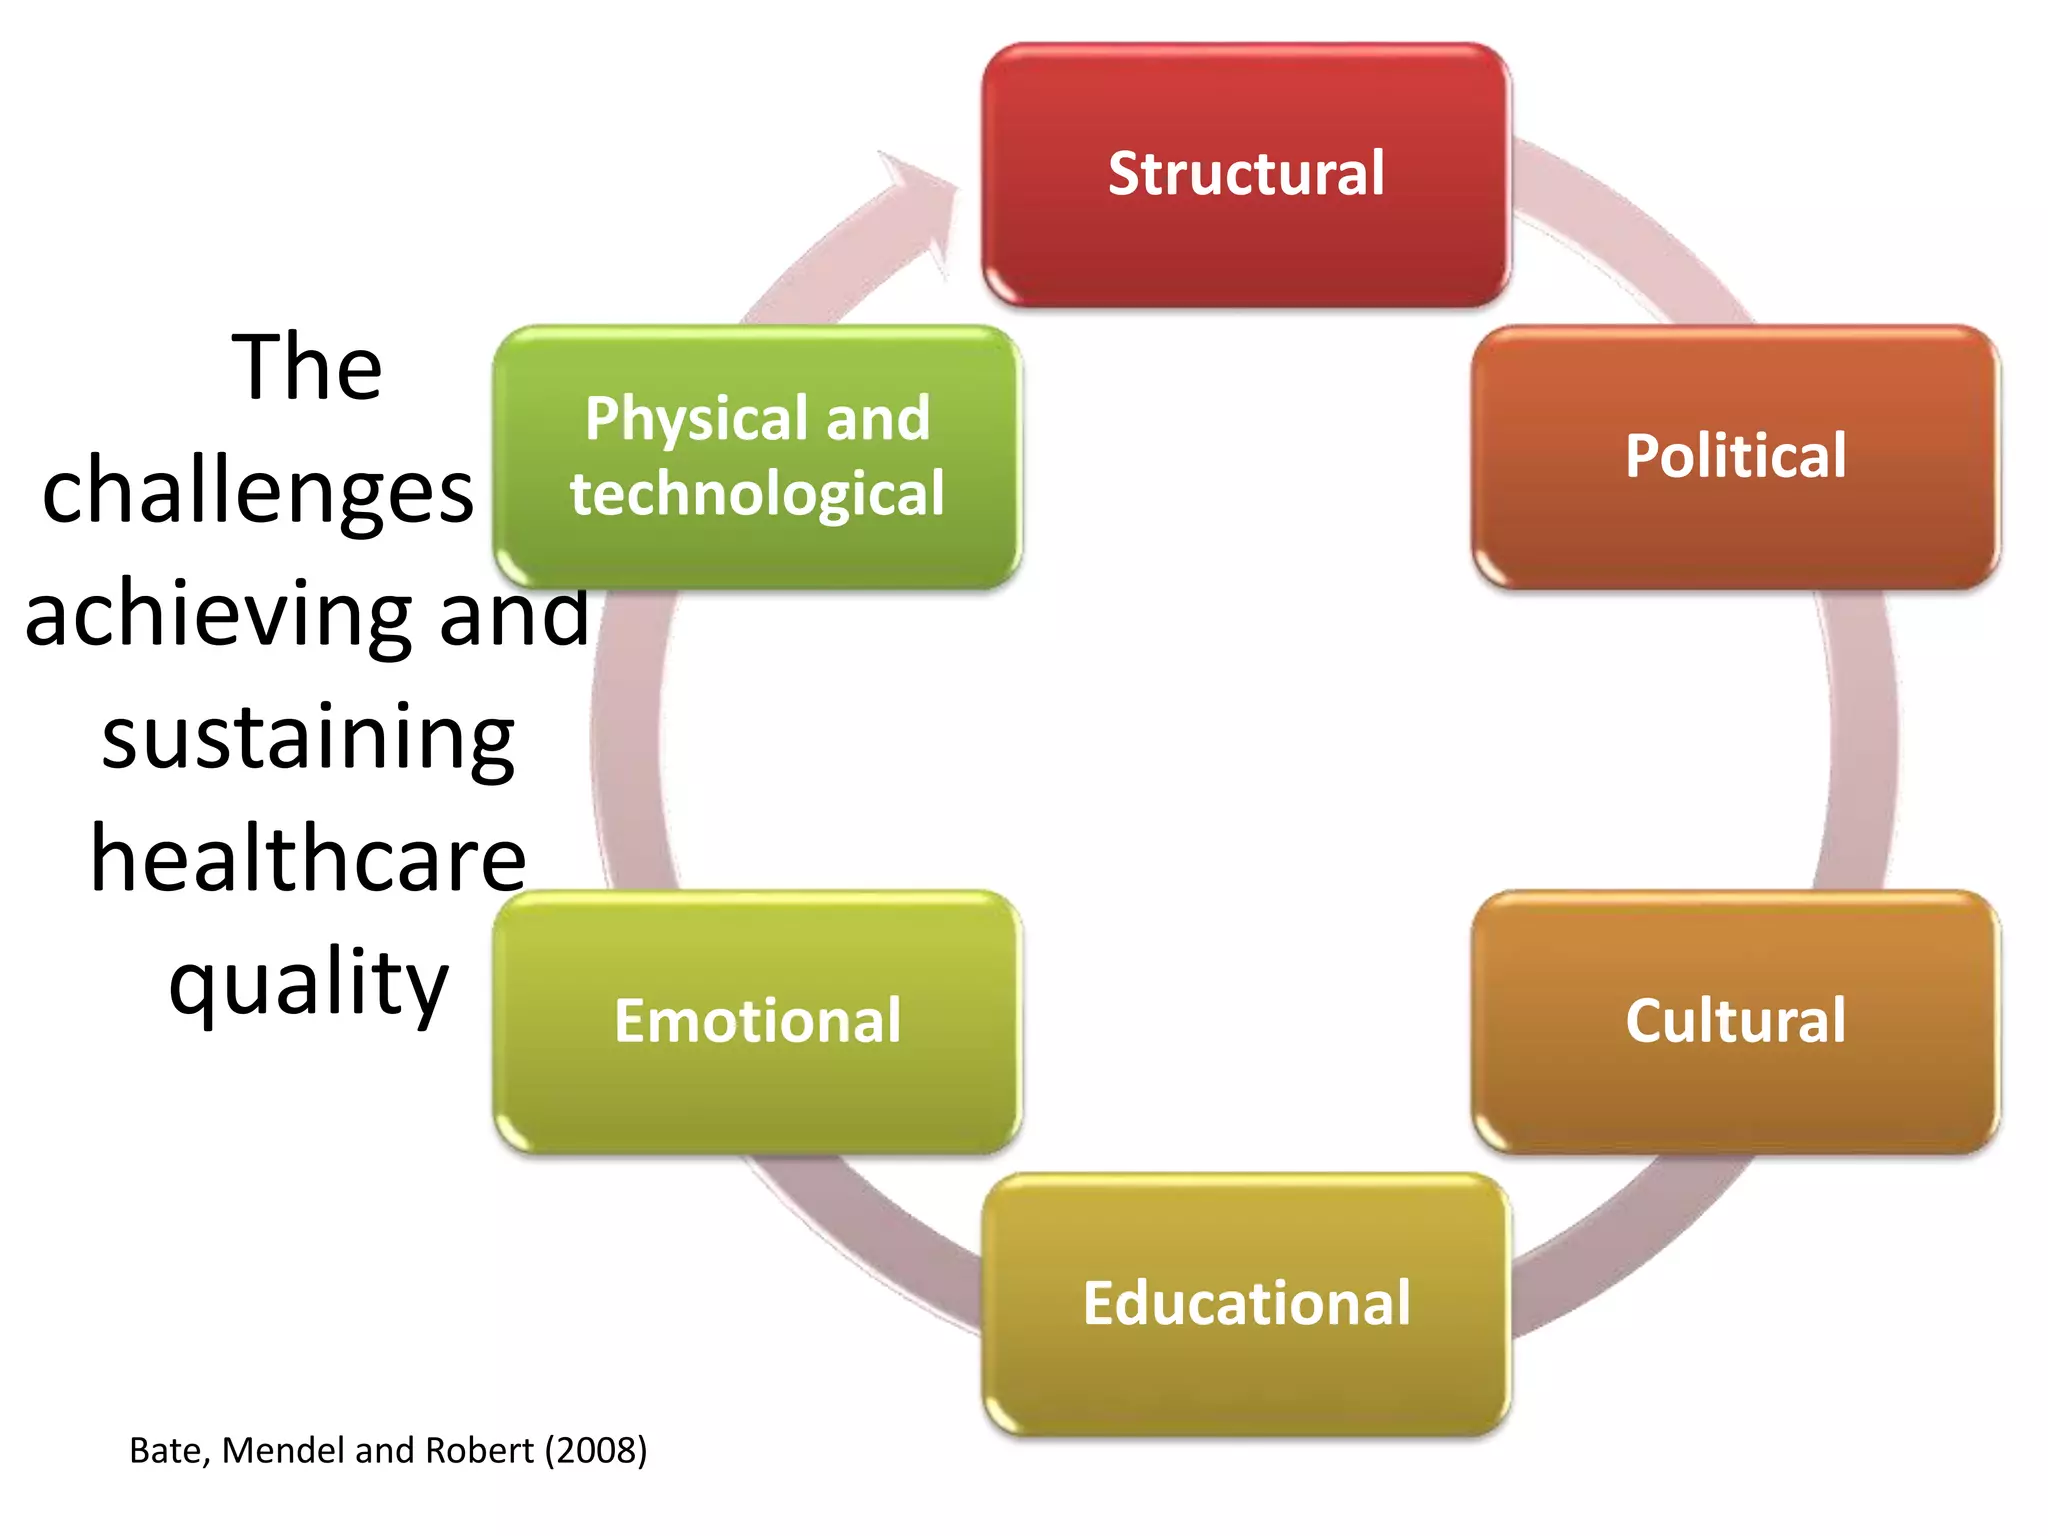
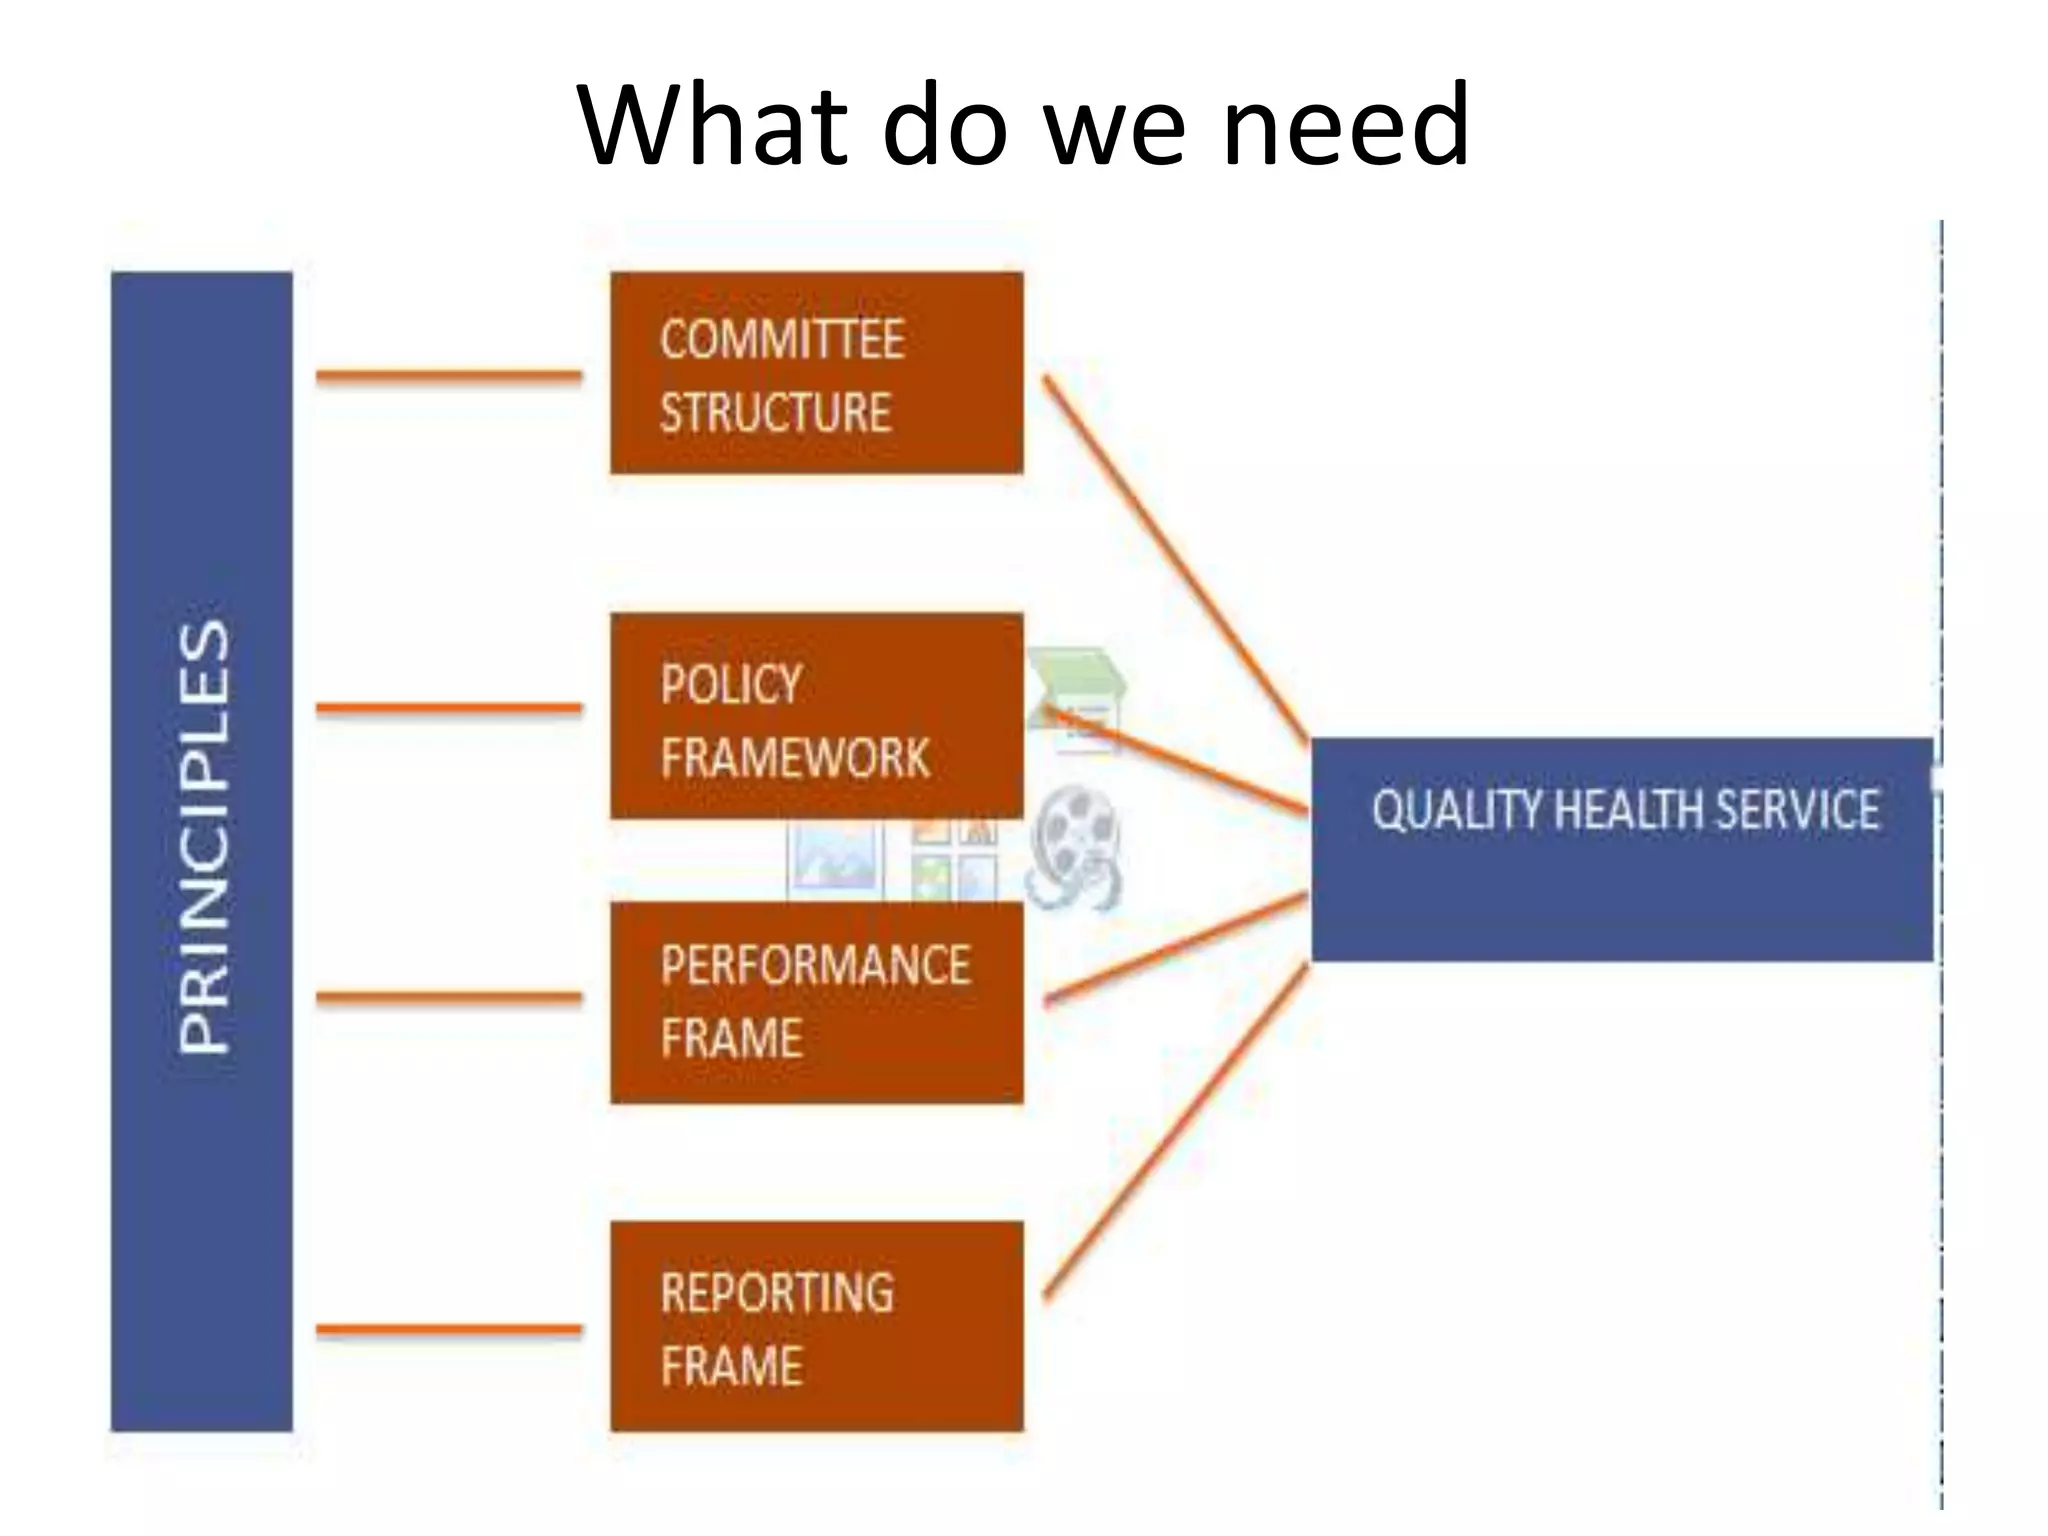
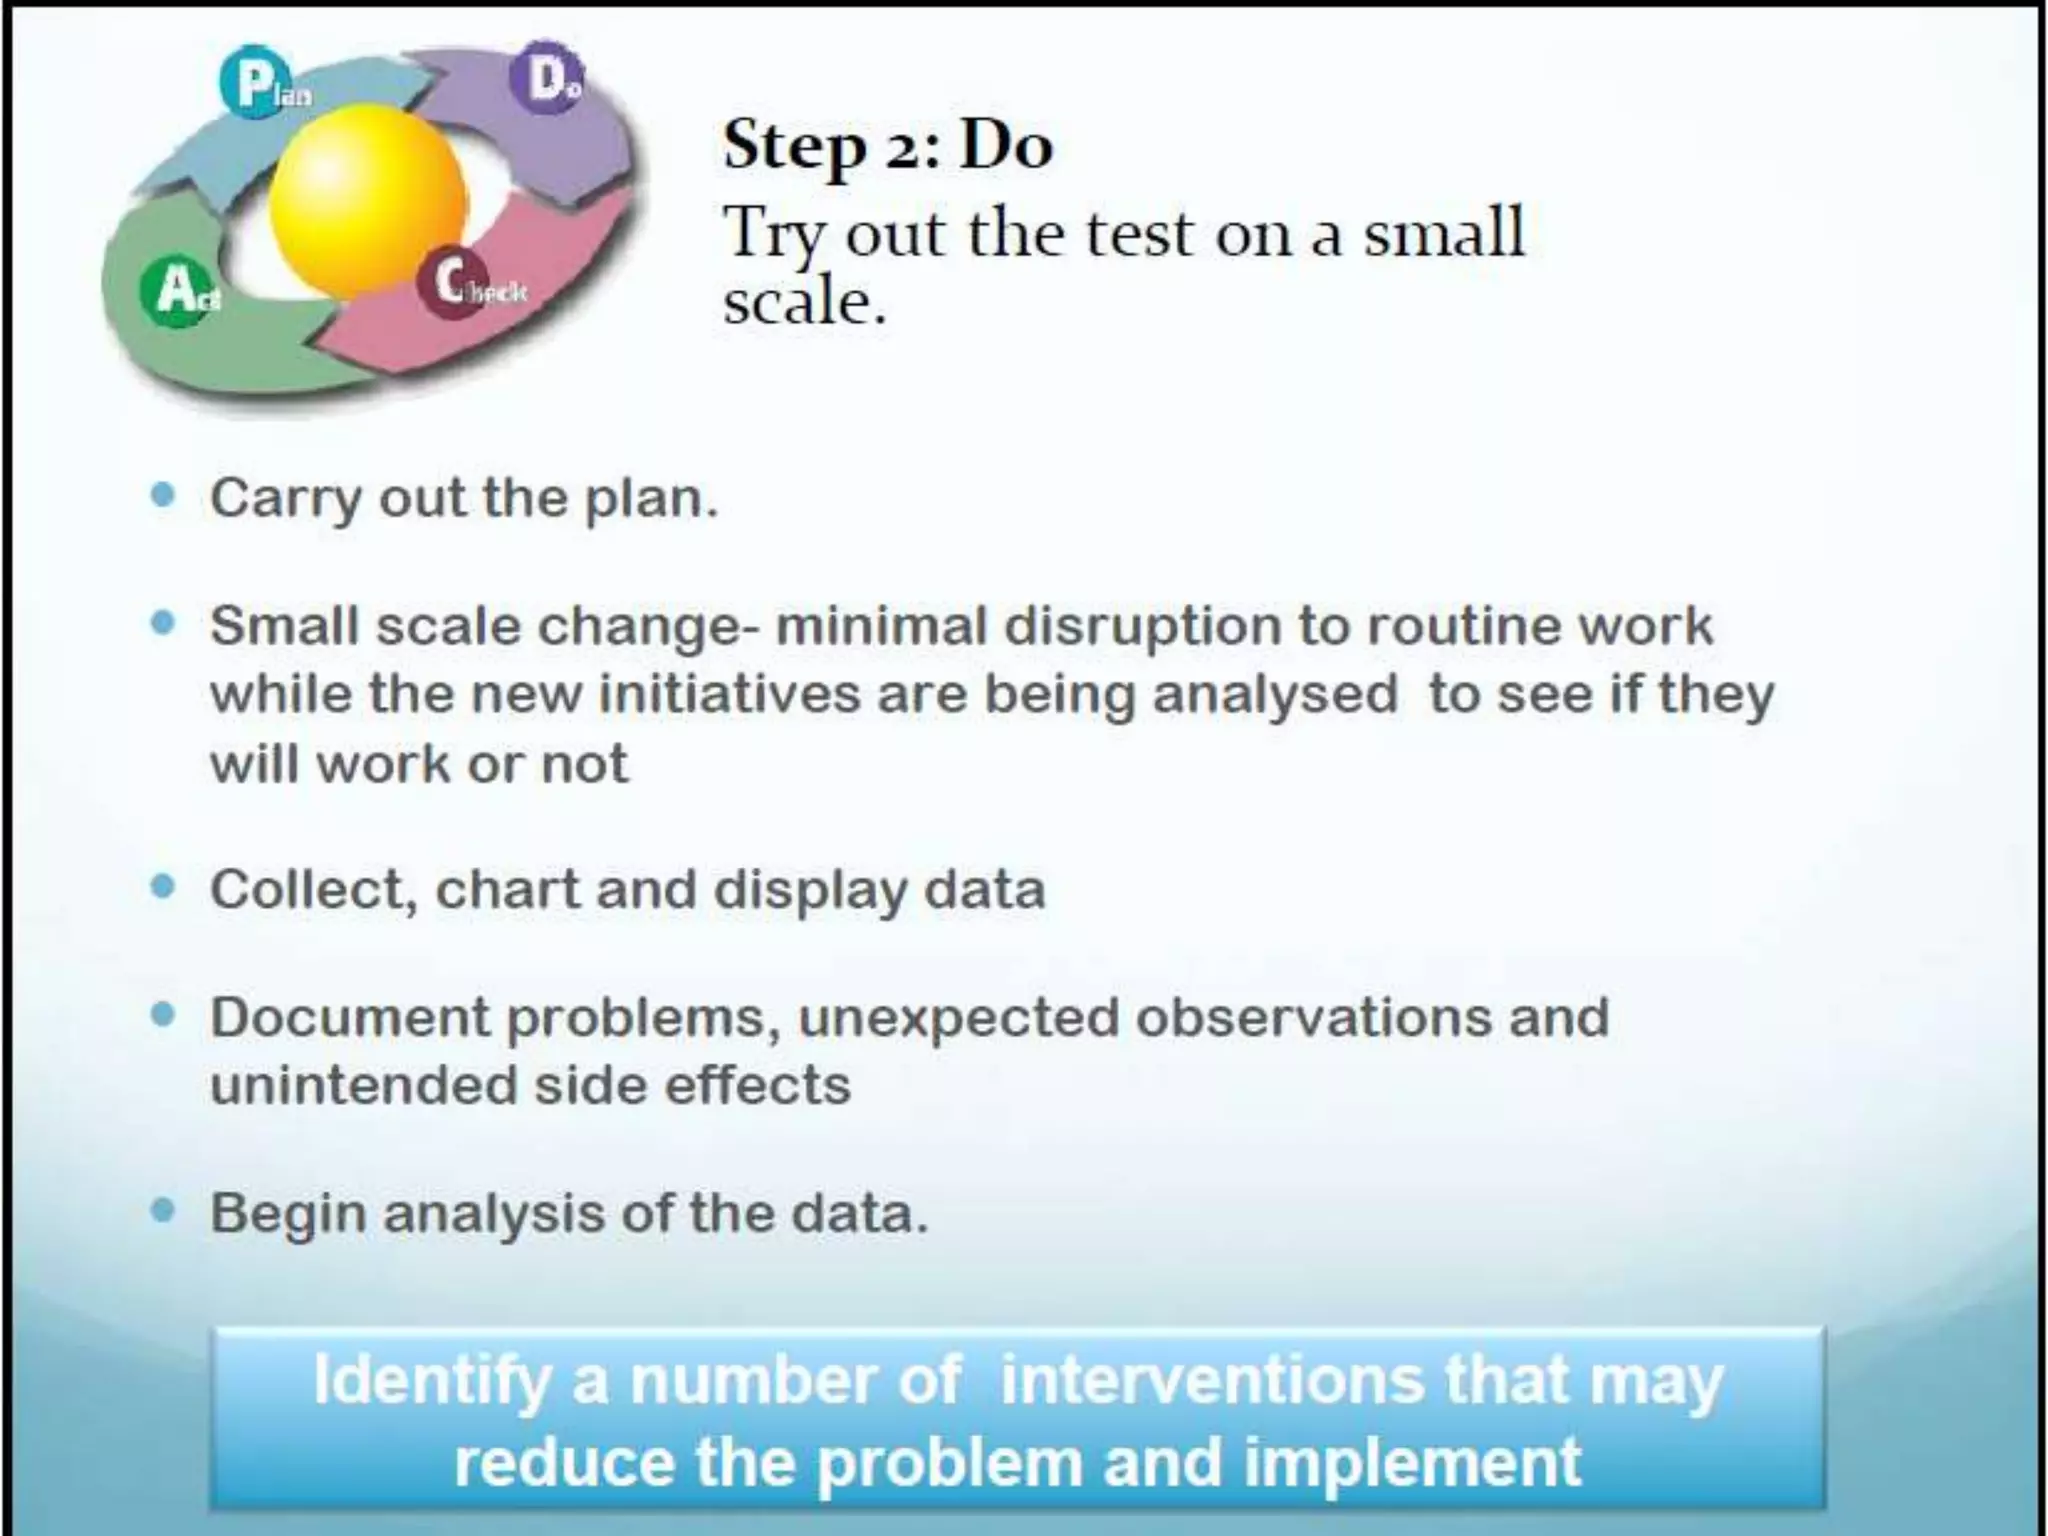
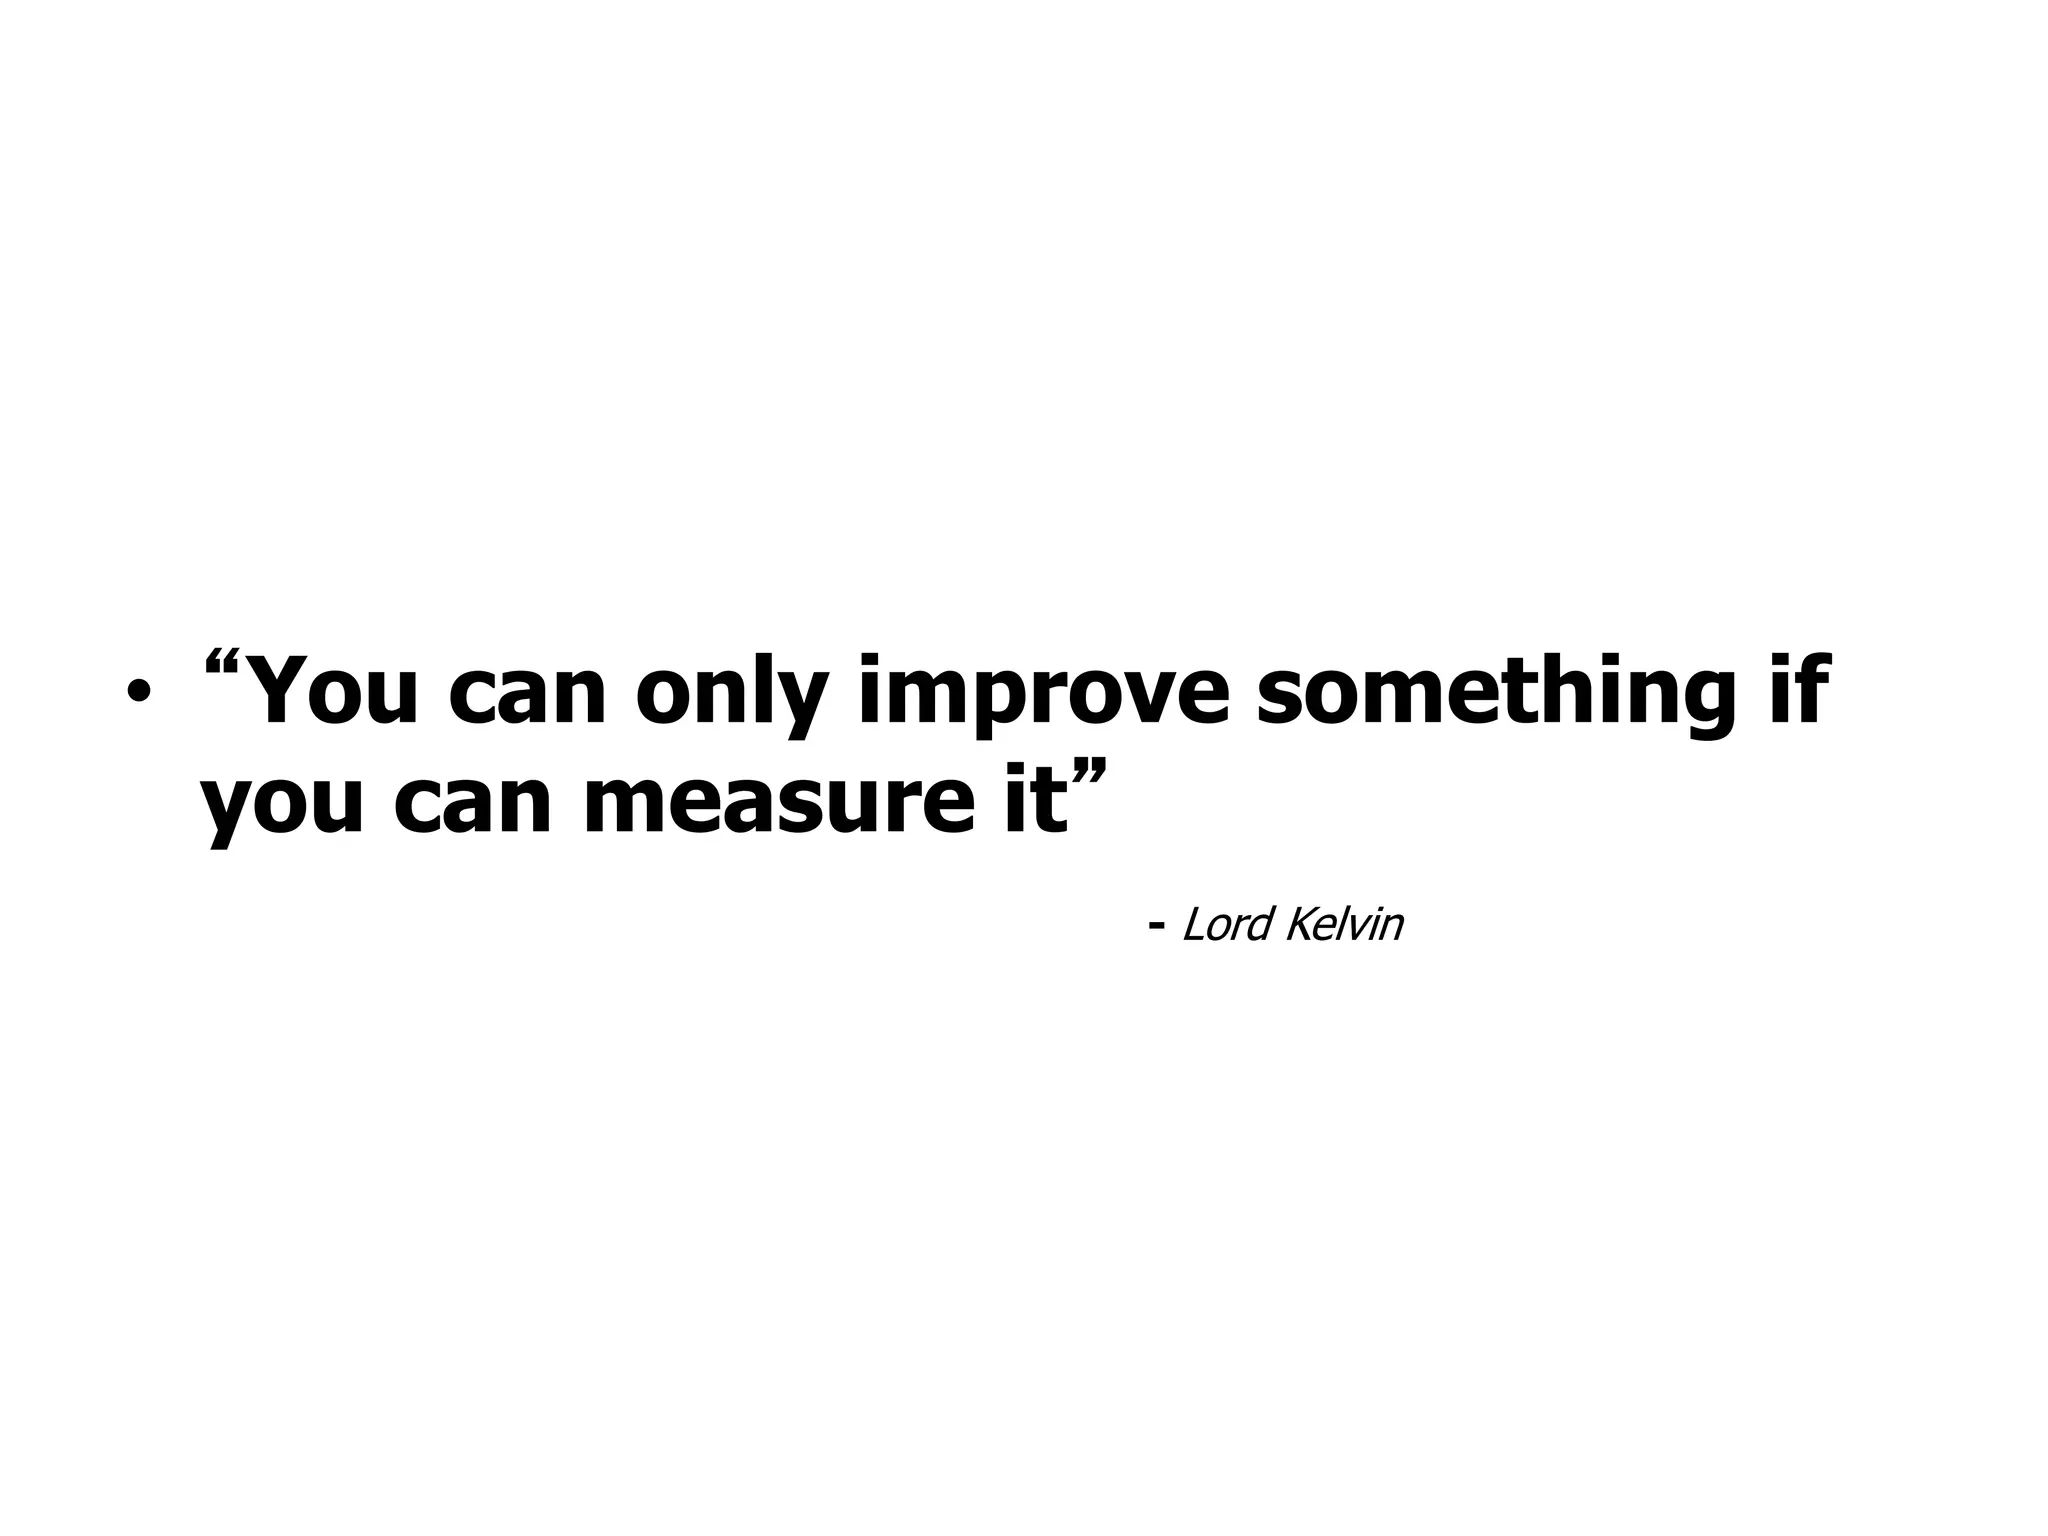
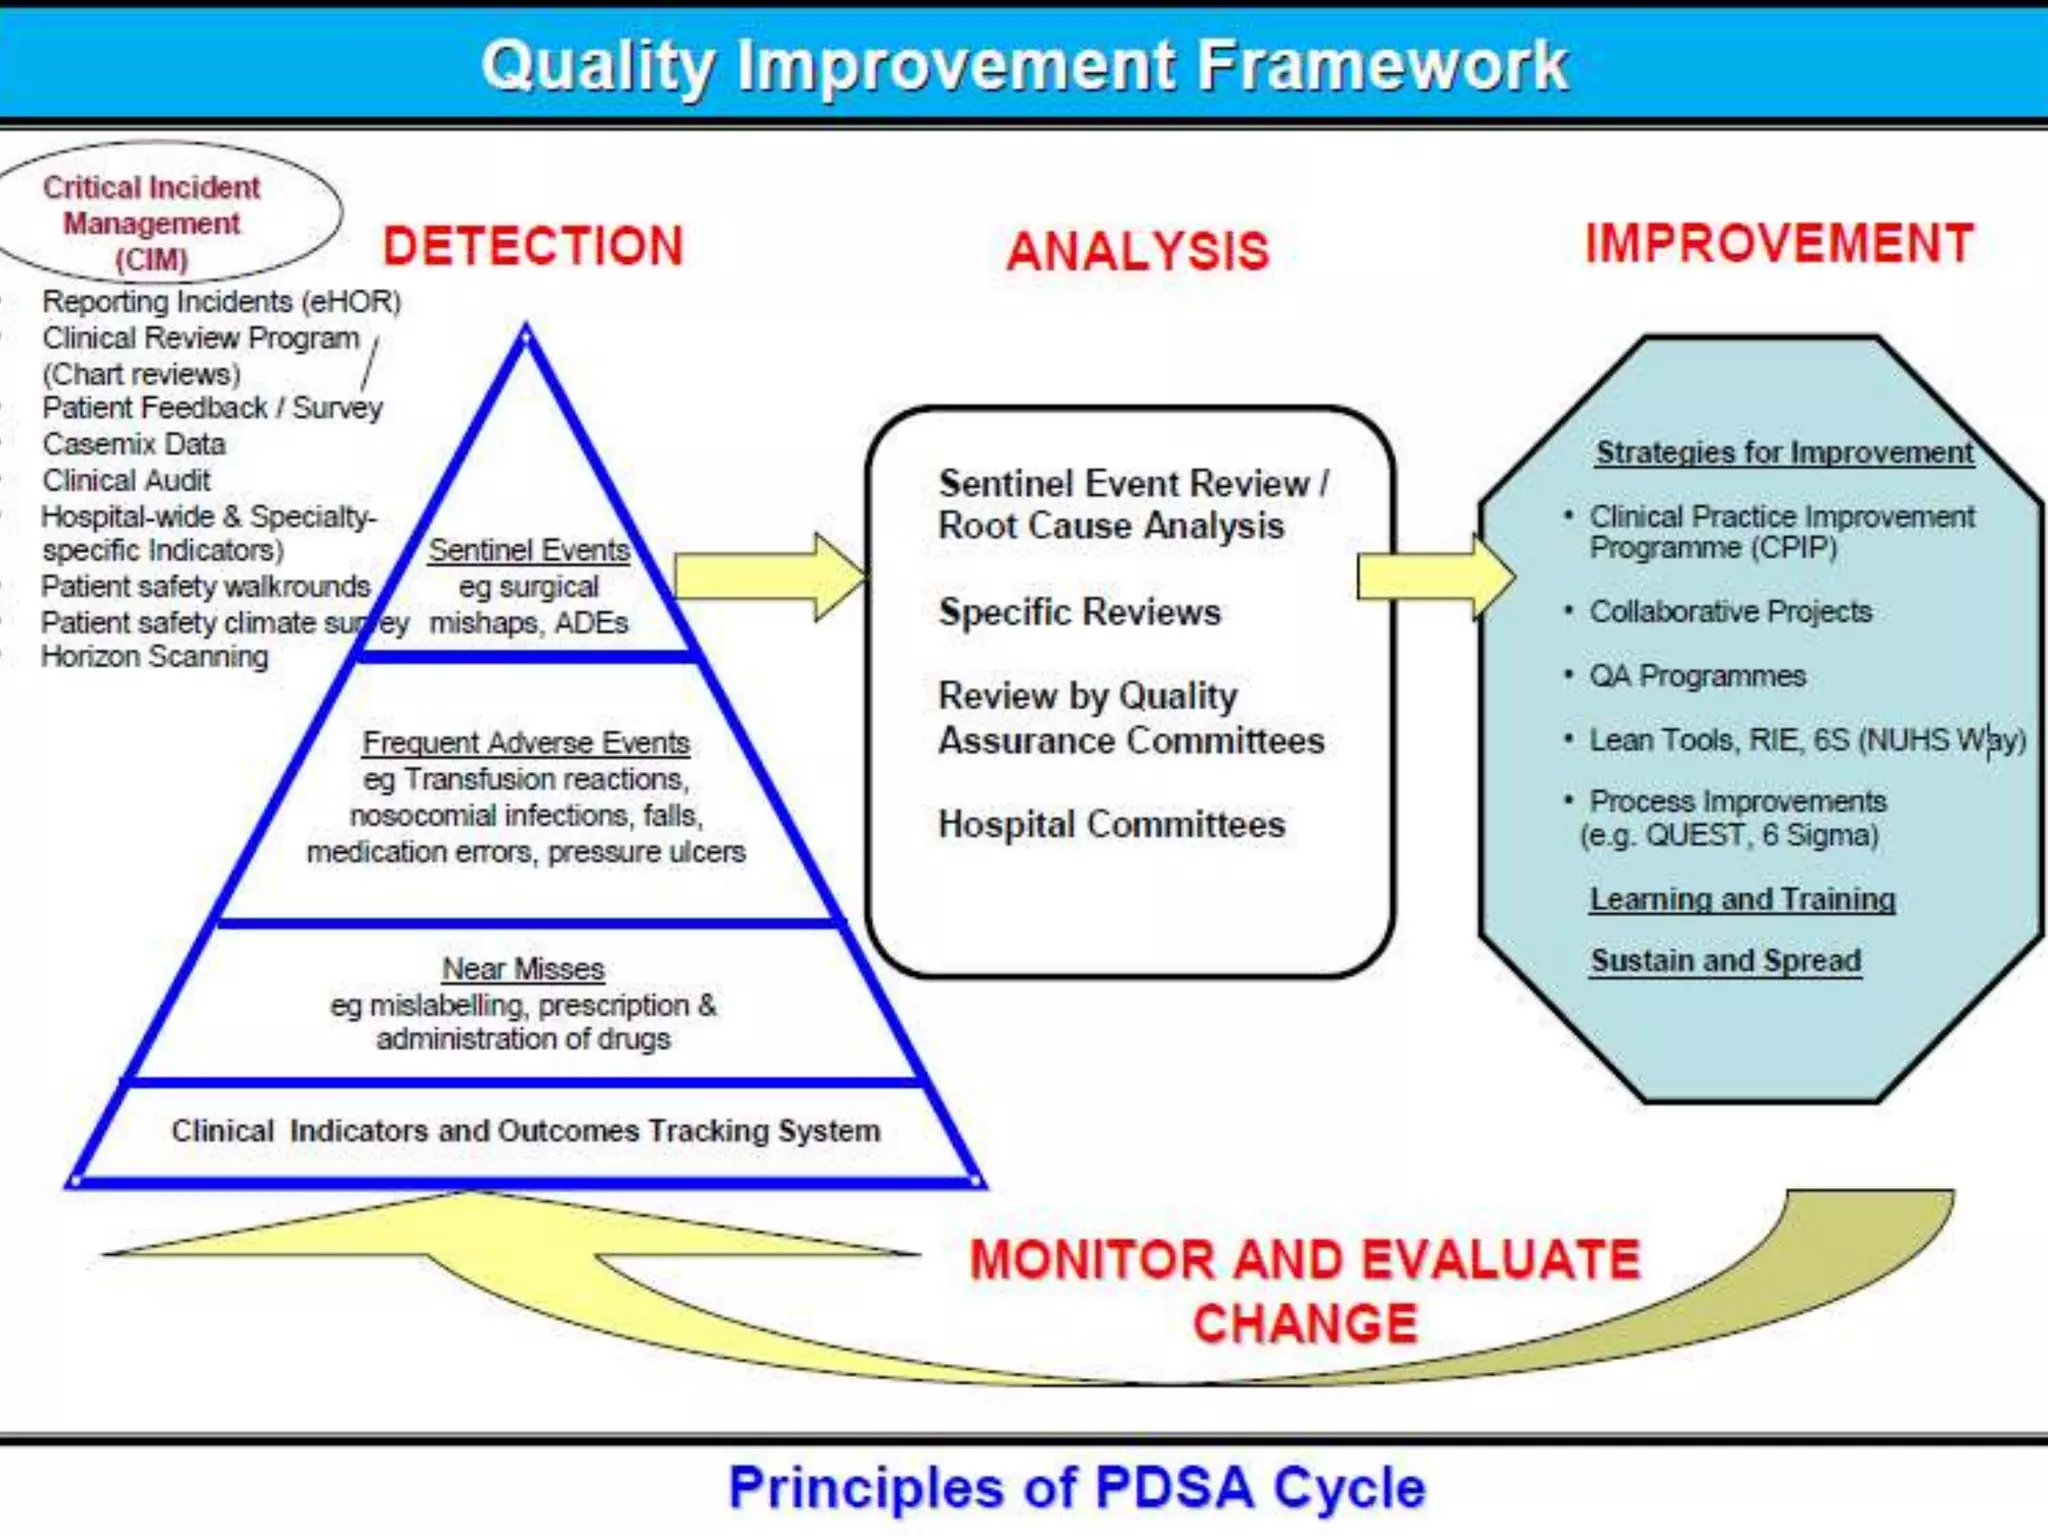
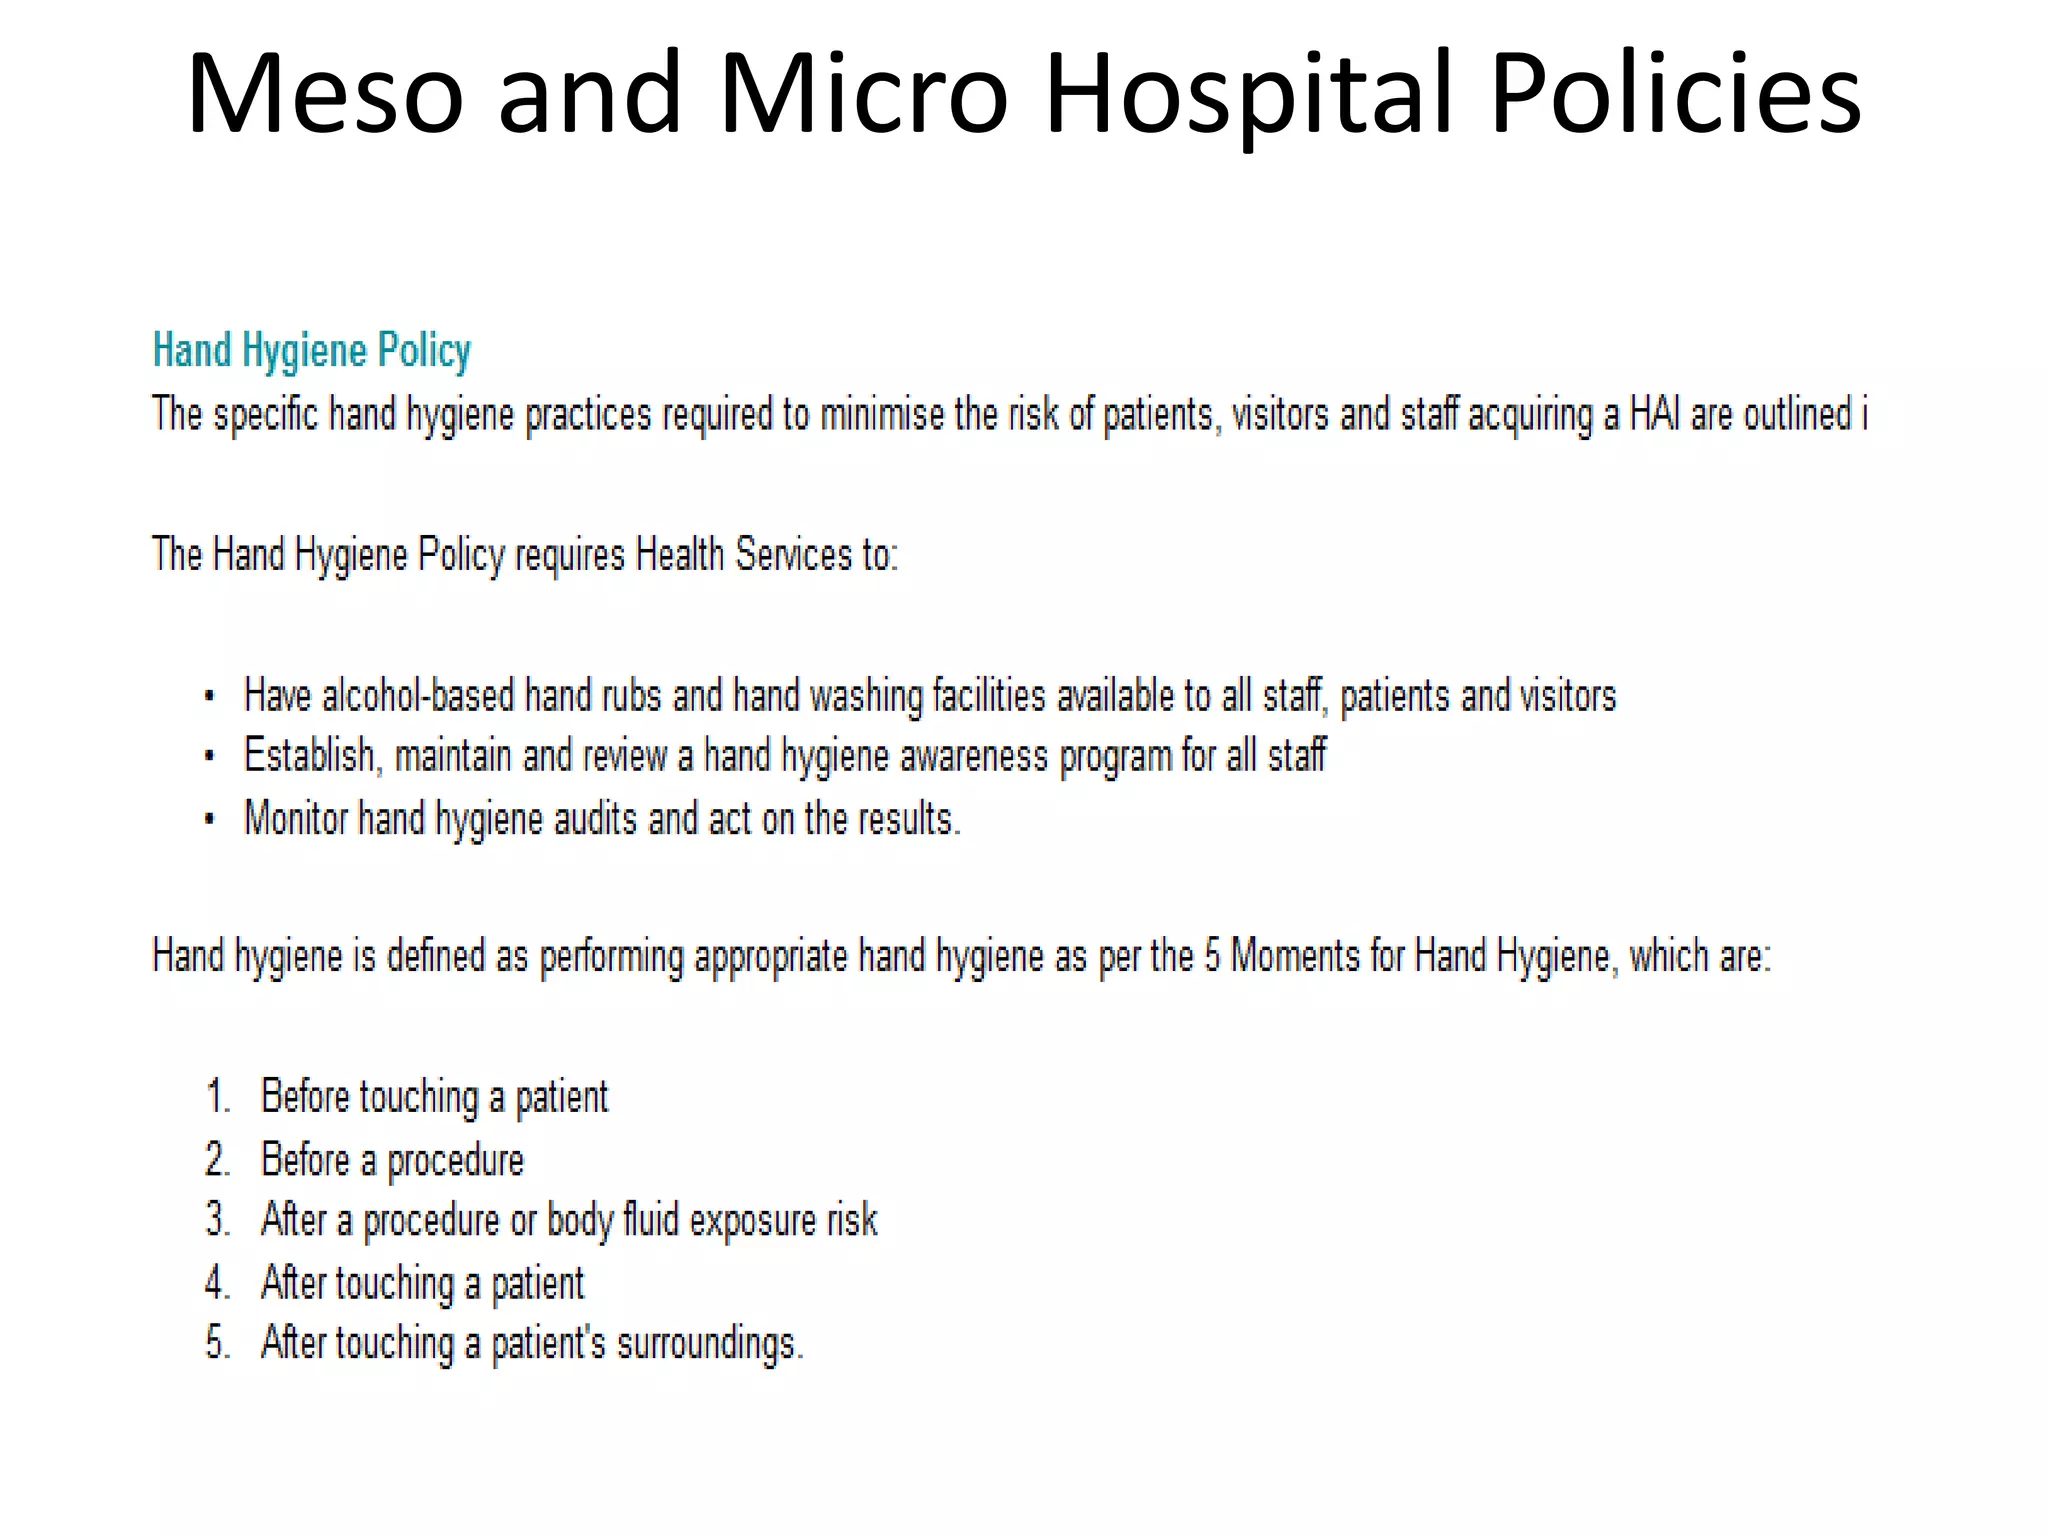
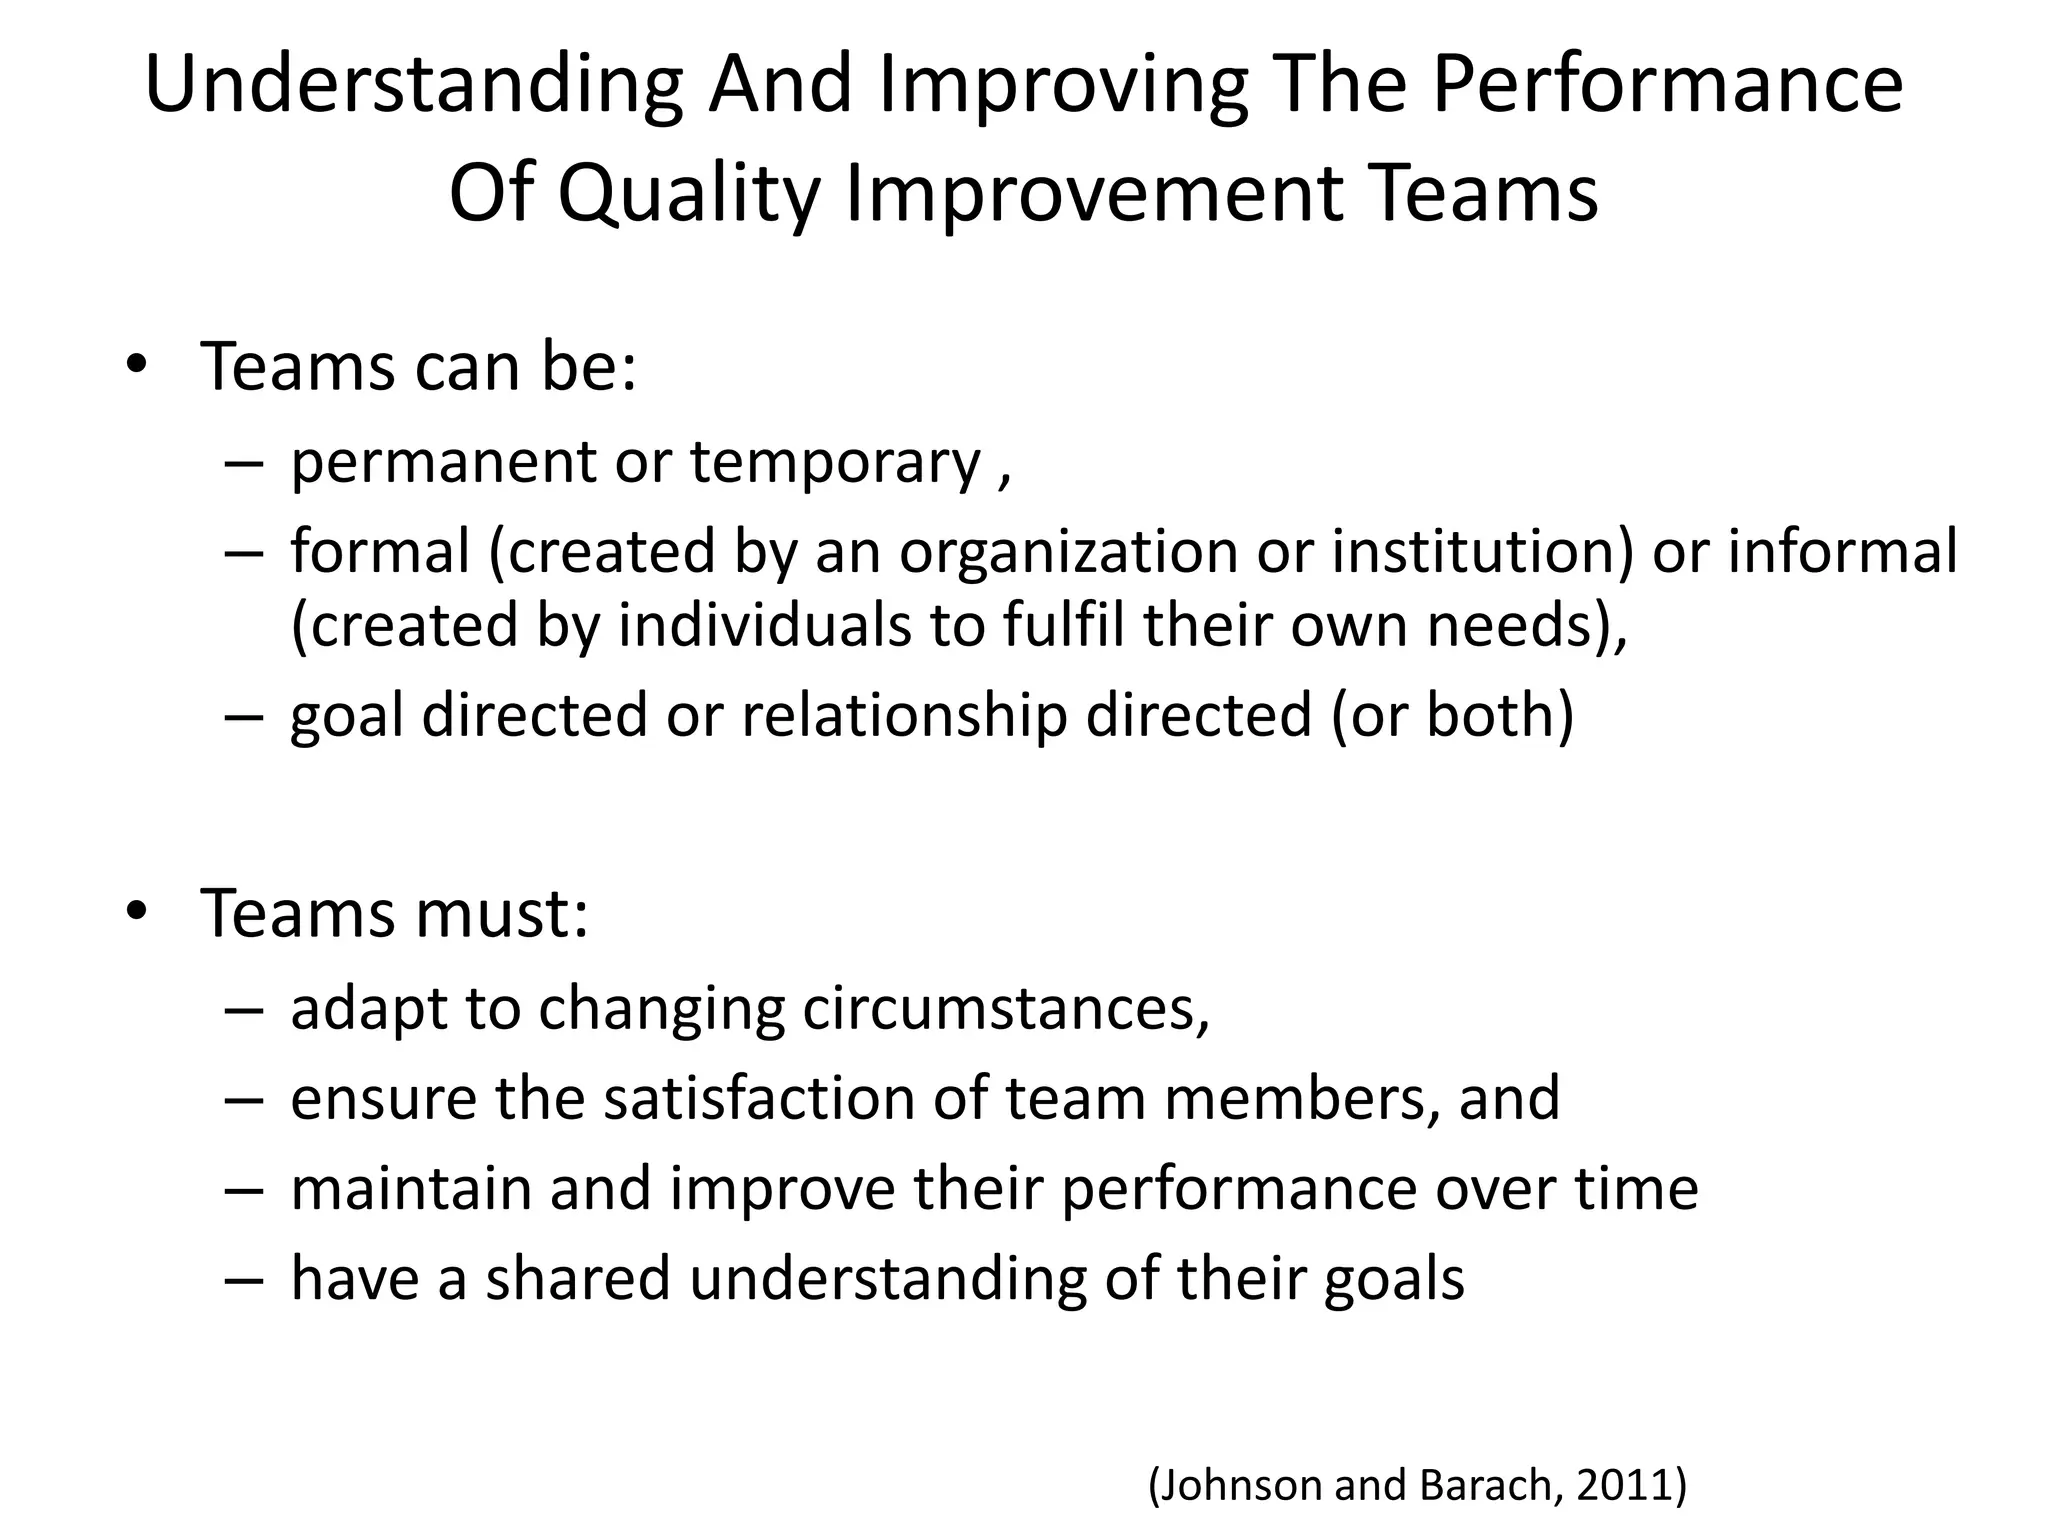
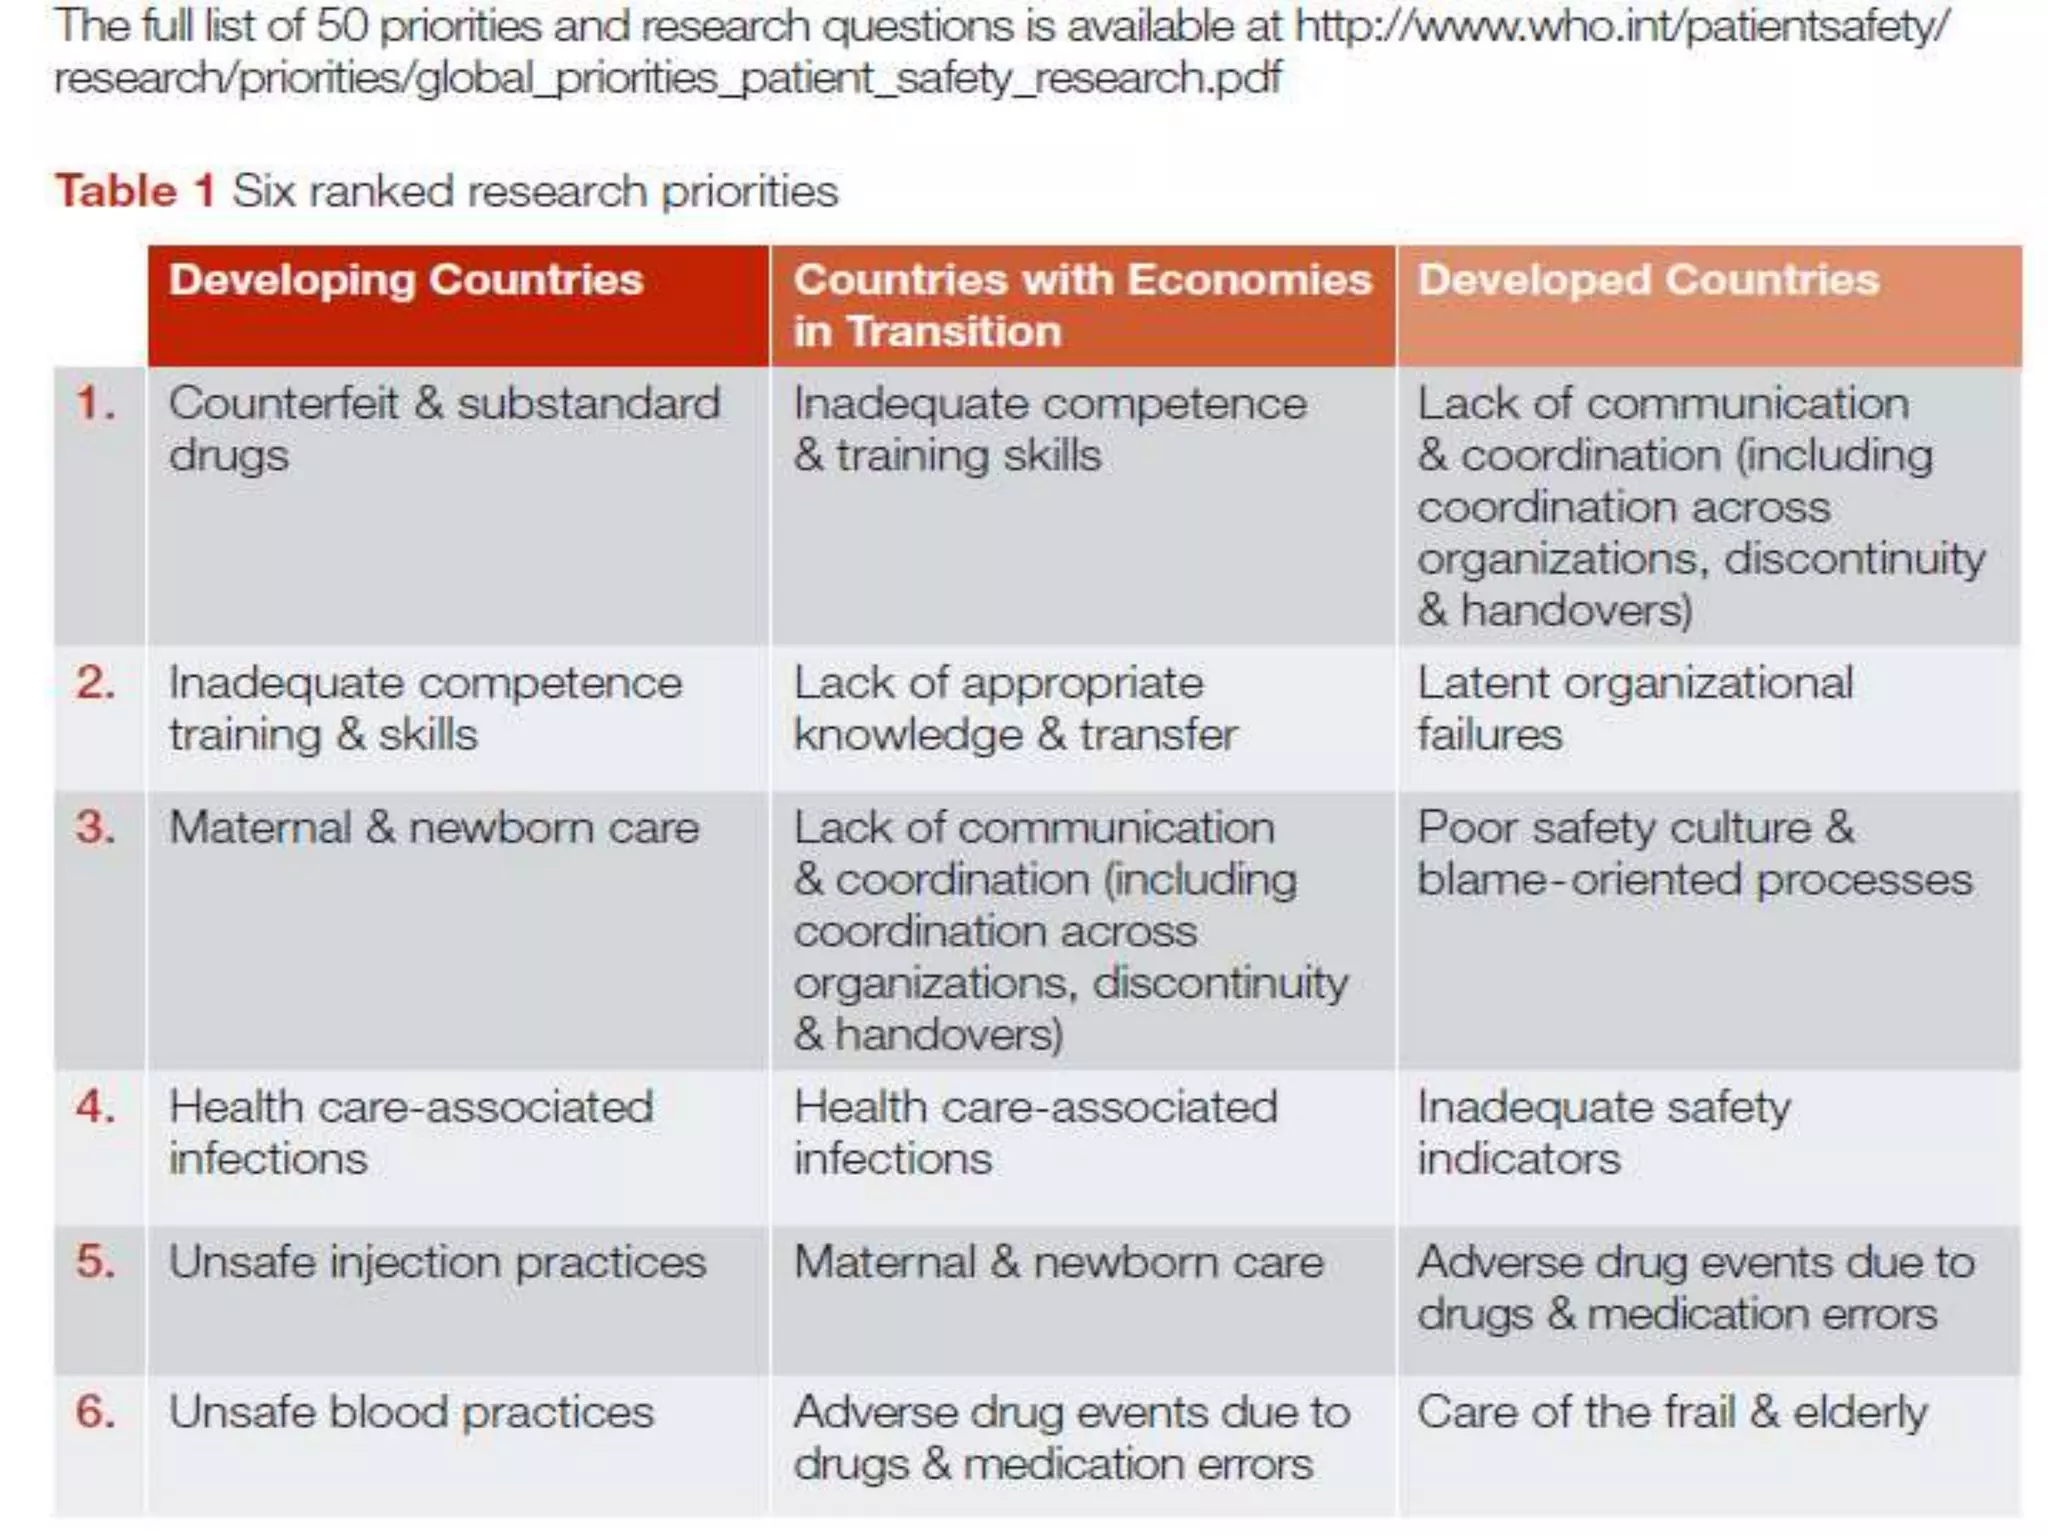
Quality Improvement in Hospitals
Dr Than Naing Htut
MBBS (UMM)
MPH (UOPH)
MHM, MIPH (UNSW)
Reflective &
Critical
Thinking
Critical
Reading
Critical
Writing
Understanding
• The illiterate of the 21st century will not be the
individual who cannot read and write, but the
one who cannot learn, unlearn and relearn.
Alan Toffler
THINKING
Reflective
Critical
Reflection
Reflective learning is a type of
learning where you link new
information to what you already
know
What is critical thinking?
(CT)
Consider that CT has 4 main parts
question
analysis
reflection
evaluation
Criticalcomes from the Greek words to
separateand to discern
I have no
time…
They don’t
read
enough!!
…To
understand and
link
to collect all
the stuff!
The how and the why
The what
Quality Improvement (QI)
• “QI is a systemic approach to planning and
implementing continuous improvement in
performance”
• QI implementation is demanding on individuals
and organizations. It requires sustained
leadership, extensive training and support,
robust measurement and data systems,
realigned incentives and human resources
practices, and cultural receptivity to change
(Shortell, Bennett, and Byck 1998; Ferlie and Shortell 2001; Institute of Medicine
2001; Meyer et al. 2004)
6 Dimensions of Quality
1. SAFETY (The extent to which potential risks are avoided
and inadvertent harm in minimised in care delivery
processes)
2. EFFECTIVENESS (The extent to which a treatment,
intervention or service achieves the desired outcome)
3. APPROPRIATENESS (The selection of the intervention that
is most likely to produce the desired outcome)
4. ACCESS (The extent to which an individual or population
can obtain health care services)
5. CONSUMER PARTICIPATION/ SATISFACTION
6. EFFICIENCY
Efficiency in Health Care
• Choices in health care delivery and treatments
should be made so as to derive maximum total
benefit from the available health care resources
• TECHNICAL EFFICIENCY:
– the degree to which the least cost combination of
resource inputs occur in production of a particular
service.
• ALLOCATIVE EFFICIENCY:
– the degree to which maximum benefit (or outcomes) are
obtained from available resources.
Health Economic Main Concept “Scarcity of the
resources”
The
challenges in
achieving and
sustaining
healthcare
quality
Structural
Political
Cultural
Educational
Emotional
Physical and
technological
Bate, Mendel and Robert (2008)
What do we need
Systems within Systems . . .
Self-care
System
Individual caregiver
& patient System Clinical
Microsystem
Macro
Organization
System
Community,
Market, Social
Policy System
Microsystems are everywhere;
however, some function better
than others
What Are The Characteristics of High
Performing Microsystems?
• Leadership
• Organizational Support
• Staff Focus
• Education and Training
• Interdependence
• Patient Focus
• Community and Market Focus
• Performance Results
• Process Improvement
• Information and Information Technology
Policy
PracticeManagement
Evidence
Based
WHO Strengthening Management
Capacity
http://www.who.int/management/strengthen/en/index.html
What is required of health services managers?
• Knowledge of the field; values; culture (Lawson & Rotem: 2004)
• Leadership; organisational planning; external relations; monitoring and
evaluation(Liang and Brown: 2008)
• Technical skills; industry knowledge; analytical and conceptual reasoning;
interpersonal and emotional intelligence (Robbins et al: 2001)
• Personal skills; interpersonal skills, group skills, communication skills (Carlopio and
Andrewartha: 2008)
• Leadership; communication; lifelong learning; consumer/community
responsiveness and public relations; political and health environment
awareness; conceptual skills; results oriented management; resources
management; compliance with standards, ethics and laws (CCHSE: 2005)
• Local knowledge; basic skills of working with people; basic skills of working with
data; library of theory; toolbox of technical knowledges and methods; repertoire
of different managerial personae; judgement or self knowledge, ethical practice
(Smyth et al, in Harris 2006)
• Wisdom (Rooney, Mintzberg, Reason, various)
‘Modern’ approaches to management
• The 20th Century has been called the ‘management’ century
• Roots of current management theory in engineering and
predominantly in the USA
• Three ages of management:
• The age of scientific management (productivity) from early
1900s until WWI
• The age of modern management (human relations and
strategic thinking) until the 1980s
• The age of change (‘nervous’ globalism, GFC and its causes,
focus on transformational leadership)
Manager to Leader
To make the transition successfully managers must
navigate a tricky set of changes in their leadership
focus and skills:
• 1. Specialist to generalist
• 2. Analyst to integrator
• 3. Tactician to strategist
• 4. Bricklayer to architect
• 5. Problem solver to agenda setter
• 6. Warrior to diplomat
• 7. Supporting cast member to lead role
(Watkins, M (2012) Harvard Business Review)
Leadership, Management and
Knowledge
• Leadership of a change effort involves setting a
direction, aligning people with a vision, and
motivating them to achieve it.
• Management by contrast, brings order and
consistency – it involves planning, budgeting ,
and monitoring
• Turning tacit knowledge into broadly shared
explicit knowledge is the only way to achieve
large-scale change in healthcare (Bate, Bevan &
Robert, 2014)
Why is implementing change so hard?
• Resistance –Fear, anxiety, uncertainty, lack of
control…… excitement??
• Innovation fatigue –Low morale
• Cultural inertia: collective human habits
• Emotional attachment
• No engagement
Change is only possible if:
(Di x De x P) > R
Where:
• Di = Dissatisfaction
• De = Desirability
• P = Practicality
• R = Resistance to Change
(Beckhard & Harris, 1977)
Why 70 % of changes fail
Kotter (1995) argued that organisational transformation efforts fail because:
• A (great enough) sense of urgency is not established
• A powerful (enough) coalition has not been established
• There is no clear vision for the change
• The vision is under-communicated
• Obstacles to the new vision are not removed
• Short term wins have not been planned or created
• Victory is declared too soon
• Changes are not anchored in the organisation’s culture
Visions are intended to create ‘… a coherent view of the future that forms an
over-arching objective for the organisation’
(Hussey, 2000: 72)
Youtube Quality
• https://www.youtube.com/watch?v=jq52ZjMz
qyI
Safety of Patient Care
• Across the world, people seeking care in hospitals are
harmed 9.2% of the time, with death occurring in 7.4% of
these events.
• Furthermore, it is estimated that 43.5% of these harm events
are preventable.
» de Vries E, Ramrattan M, Smorenburg S, Gouma DJ
• Healthcare, as an industry, has failed to make as many gains
in safety as other industries
– 44,000 to 98,000 individuals die from medical errors each year in the
US
» IOM, To Err is Human, 1999
– It is estimated that in Australia, 16.6% of people admitted to the
hospital suffer from an adverse event
» Wilson R, Runciman W, Gibberd R, Harrison B, Newby L, Hamilton J. The
Quality in Australia Health Care Study. Med J Aust. 1995(163):458-76.
Most Common Causes of Errors
• Communication problems
• Inadequate information flow
• Human (or performance) problems
• Patient-related issues
• Organizational transfer of knowledge
• Staffing patterns/work flow
• Technical failures
• Inadequate policies and procedures
AHRQ, Patient Safety Initiative: Building Foundations, Reducing Risk. Interim Report
to the Senate Committee on Appropriations. 2003, Agency for Healthcare Research
and Quality: Rockville, MD.
Many Ways to Detect Adverse Events
Passive methods of surveillance :
• Traditional voluntary reporting – useful, but identifies only
the tip of safety iceberg
• Clinical indicators tracking
• Nosocomial infection reporting systems
• ICD coding
Active methods of surveillance :
• Chart review – best, but expensive e.g. CRP, AE study
• Chart review - IHI Global Trigger Tool (GTT)
• Direct observation (e.g. HH, Medication Rounds, Code
Blue)
• IT – reduced costs and man hours but not all AEs can be
detected using coded data – improvements in techniques
to extract concepts from clinical narratives still needed.
Improvement always starts with a
question or problem!
• How can we improve the use of blood products
within theatre in line with current clinical practice
guidelines?
• Why is the post-surgery infection rate higher in
our hospital/department than other comparable
hospitals/departments?
• Are our patients satisfied with current waiting
times at our clinic?
• Is the use of sedatives on discharge appropriate
at our hospital and how can it be improved?
• How can we improve Quality?
Quality Improvement Model
• PDCA
• Lean
• Six-Sigma
• Change Management
• “You can only improve something if
you can measure it”
- Lord Kelvin
Types of Measurements
1. Input (e.g. no.staff, equipment, time spent)
2. Process (e.g. % patients receiving Aspirin on
admission)
3. Outcome (e.g. Wound infection rate, Fall
rate)
• Process measures are used to monitor
whether a change has occurred
• Outcome measures may be from provider
perspective and patient perspective
Variation
Two Types of Variation types (Shewhart)
1) Common Cause Variation
•Also known as random or unassignable variation
•Is inherent in the design of the process
•Has a consistent pattern
•Is due to constant, regular, natural or ordinary causes
•Results in a “stable” process that is predictable; process is in-control
2) Special Cause Variation
•Also known as non-random or assignable variation
•Is due to irregular or unnatural causes that are not inherent in the design of the
process
•Has a varying pattern
•Results in an “unstable” process that is not predictable; process is out-of-control
1) Common Cause Variation
•It does not mean “Good Variation”
•It only means that the process is stable and predictable
For example: A patient’s blood pressure averages around
165/100 mmHg and is usually between 170/110 and
160/90 mmHg. It is stable and predictable but
unacceptable
Understanding variation
2) Special Cause Variation
•It should not be viewed as “Bad Variation”
•You could have a special cause that represents a
very good result (e.g., a low turnaround time),
which you would want to emulate
•Special cause merely means that the process is
unstable and unpredictable
•Needs attention/effort to be fixed
1) Common Cause Variation
• It is about changing (re-design) the process
• It leads to an increase in process capability (conformance-to-requirements)
2) Special Cause Variation
• It is about fixing (eliminating causes and
adjustment) the process.
• It leads to stability in process (predictability)
How do we reduce variation?
Detecting Special Causes
Run Chart
A special cause is indicated when
there is:
• The presence of too much or too
little variability
• The presence of a shift in the process
• The presence of a trend
Control Charts
A special cause is indicated when:
• a single point falls outside a control
limit
• two out of three successive values
are on the same side of the
centerline and more than two
standard deviations from the
centerline
• eight or more successive values fall
on the same side of the centerline
• a trend of six or more values in a row
steadily increasing or decreasing
Run chart
• Plot data sequentially over time
• Central measure (median)
• Helps identify
 Trend over time
 Shifts
 Variation
Run chart
0
10
20
30
40
50
60
70
80
90
1 2 3 6 7 8 9 10 13 14 15 16 17 20 21 22 23 24 27 28 29 30
Timeinminutes
Date
Average time-to analysis for July 2011
• XmR chart – two components
• X chart (observed values)
• mR chart (moving range)
1. Calculate the average
• List the data in its time series order
• Calculate the average ( X )
• Plot the individual observations
• Use the average to mark the central line
Creating the Control (XmR) Chart
2. Calculate the moving range and its average
• Calculate the difference between successive
observations (the moving range)
• Use absolute values (Ignore any minus signs)
• There should be n-1 of entries for moving range
• Calculate the average of the moving range
• Multiply the average of the moving range by
the correction constant “E”
• Calculate the control limits
• X ± (E * mean mR)
• E is a correction factor that depends on subgroup size
• Correction Factor = 3 divided by the empirical
constant 1.128 = 2.66
• Control limits = X  (2.66 * mean moving range)
Mohammed MA et al, Plotting basic control charts: tutorial notes for healthcare
practitioners. Qual Saf Health Care 2008;17:137–145
Patient’s Systolic BP over 26 days
• Mohammed MA et al, Plotting basic control
charts:
• Co
Mean = 173.2
Mean moving range = 11
Control limits = Mean (173.2)  (2.66 *11 (Mean
moving range)
UCL 202.5
LCL 143.9
Control Chart of systolic BP
(Mohammed et al.)
Essentials of XmR Control Charts
• Display of data over time
• Center line is the mean
• Moving range is the point to point variation
in the data and is always needed to
calculate the control limits
• Control limits are generated from the
average moving range
• Information about special and common
cause variation is interpreted using specific
rules
• Standard deviation is calculated differently
in “basic statistics”
Bolman and Deal
Exercise: Strength of Intervention
• Remove unnecessary and dangerous steps from a process
• (Strong)
• Train staff on IV pump use
• (Weak)
• Add a checklist for surgical procedure
• (Intermediate)
• Write a new hospital policy about patient transport
• (Weak)
• Replace all IV pumps in the hospital with a single model
• (Strong)
• Redesign crash cart or supply room to keep easily confused
drugs apart
• (Strong)
Resources
Framework of factors influencing clinical practice
Factor types Influencing contributory factors Examples
Institutional context Economic and regulatory context; national health service
executive; clinical negligence scheme for trusts
Inconsistent policies, funding
problems
Organisational and
management factors
Financial resources and constraints; organisational structure;
policy standards and goals; safety culture and priorities
Lacking senior management
procedure for risk reduction
Work environment
factors
Staffing levels and skills mix; workload and shift patterns; design,
availability, and maintenance of equipment; administrative and
managerial support
High workload, inadequate staffing, or
limited access to essential equipment
Team factors
Verbal communication; written communication; supervision and
seeking help; team structure (consistency, leadership, etc)
Poor communication between staff
Individual (staff) factors Knowledge and skills; competence; physical and mental health
Lack of knowledge or experience of
specific staff
Task factors
Task design and clarity of structure; availability and use of
protocols; availability and accuracy of test results
Non-availability of test results or
protocols
Patient factors
Condition (complexity and seriousness); language and
communication; personality and social factors
Distressed patient or language
problem
Source: Vincent Charles, Taylor-Adams Sally, Chapman E Jane, Hewett David, Prior Sue, Strange Pam et al. How to investigate and analyse clinical incidents: Clinical Risk Unit and Association of
Litigation and Risk Management protocol BMJ 2000; 320:777
Some QI intiatives
• Ward based standard procedures, treatment guidelines
• Enhanced credentialing framework including “Train-the-Trainer”
• Mandatory attendance for MO/HO for BCLS and high-risk ward-based
procedures like CPR, chest tube
• Specific & Core Privileges
• Re-privileging for specific and core procedures based on evidence on
outcome
• Mandated setting up of Dept Credentialing Committee
• Quality & Safety as part of System Based Practice (SBP) CME program
, Case based study (Trainer - CEO),
• Residents’ participation in patient safety leadership walkrounds by
rotation
• 3.5 days workshop on quality improvement with completion of 1
project
• Story Board
Department-specific initiative of choice to reduce ALOS,
readmissions, short-stays or long-stays
• a) Discharge before noon & review at EMD
• b) Reduce long-stay patients (improve
coordination of care, delays, step-down and
home-care)
• c) Provide timely and appropriate access to
investigations (for CT, MRI, Echo)
• d) Improve Safety Standards
• e) measuring individual doctors’ performance,
and other
HOSPITAL QUALITY IMPROVEMENT:
STRATEGIES AND LESSONS FROM U.S. HOSPITALS
• 1. A trigger serving as a “wake-up call” that prompts the hospital to begin
or renew an emphasis on quality improvement, marking the beginning of
cultural shift and leading to . .
• 2. organizational and structural changes such as establishment of quality-
related councils and committees, empowerment of nurses and other staff,
and investments in new technology and infrastructure that facilitate . . .
• 3. a new problem-solving process, involving a standardized, systematic,
multidisciplinary team approach to identify and study a problem area,
conduct root cause analysis, develop action plans, and hold team leaders
accountable, resulting in establishment of . . .
• 4. new protocols and practices, including evidence-based policies and
procedures, clinical pathways and guidelines, error-reducing software, and
patient flow management techniques, leading to . . .
• 5. improved outcomes in process and health-related measures (e.g., patient
flow, errors, complications, mortality), satisfaction and work environment,
and “bottom line” indicators such as reduced length of stay and increased
market share. Experiencing such positive results then served as motivation
to hospital staff to expand their efforts, thus turning the above sequence
into a self-sustaining cycle.
Meso and Micro Hospital Policies
Understanding And Improving The Performance
Of Quality Improvement Teams
• Teams can be:
– permanent or temporary ,
– formal (created by an organization or institution) or informal
(created by individuals to fulfil their own needs),
– goal directed or relationship directed (or both)
• Teams must:
– adapt to changing circumstances,
– ensure the satisfaction of team members, and
– maintain and improve their performance over time
– have a shared understanding of their goals
(Johnson and Barach, 2011)
How does culture affect safety?
• Lack of integration of health care systems and services Resource, competing
priorities and inadequate staffing and work overload
• Financial incentives to conceal errors
• Acceptance of poor, expectation of good quality services and techniques e.g.
written and oral communication
• Teams and services that are fragmented
• Professional and organisational culture clashes including definitions of errors
(Sub-organizational culture)
• Lack of senior leadership involvement in safety strategies
• Lack of clinician engagement
• Blame and shame, the ‘eating of young’
• The catching and or concealment or errors and near misses by colleagues
• Treatment of whistle-blowers and other system critics
• Involvement of consumers and carers
• Resistance to change
• Rate of change and innovation
• Level(s) of commitment to organisational learning and improvement
• Integration of safety programs and the use of data
QI
• QI combines three elements:
– use of cross-functional teams to identify and solve quality
problems,
– use of scientific methods and statistical tools by these
teams to monitor and analyse work processes, and
– use of process-management tools (e.g., flow charts that
graphically depict steps in a clinical process) to help team
members use collective knowledge effectively.
• QI achieves its full potential when it pervasively
penetrates organizational routines and becomes a
‘‘way of doing business’’ throughout the
organization. Such penetration is critical for
sustainable success
Quality Improvement Collaborative (QIC)
• The most widely used QIC approach in controlled outcome
studies is the Breakthrough Series (BTS) developed by the
Institute for Healthcare Improvement (IHI 2003).
• The BTS’s components include
– formation of a planning group that decides on a target
objective and identifies areas for change, pre-work from
participants (e.g., identifying QI team members and roles and
planning for necessary supports),
– in-person learning sessions during which teams learn clinical
and QI approaches, and
– ongoing support (e.g., phone calls, visits, email, brief reports).
– Between learning sessions, participants engage in plan-do-
study-act (PDSA) cycles during which
– they make small interventions and assess their impact
Components of QIC
• fourteen crosscutting structural and process-oriented
components, including
– in-person learning sessions, phone meetings, data reporting,
feedback, training in QI methods, and use of process improvement
methods and Organizational involvement
• On average, each study implemented an average of six or seven
QIC components. The most commonly reported components
were in-person learning sessions (twenty out of twenty), PDSAs
(fifteen out of twenty), multidisciplinary QI team (fourteen out
of twenty)
• All the QICs in these studies included didactic training in a
particular care process or practice (e.g., the Chronic Care model,
pain management guidelines). They provided training in quality
improvement techniques, such as PDSA cycles, sharing of ideas
and experiences, the change package, interactions during in-
person sessions, and the collaborative Internet
A review of 1784 hospital QI
1. Percentage of hospital staff and percentage of
senior managers participating in formally
organized QI teams are associated with better
values on quality indicators
2. scope of QI implementation in hospitals is
significantly associated with hospital-level quality
indicators
Where are they heading
• The Accreditation Council for Graduate Medical
Education (ACGME) and the American Board of
Medical Specialties (ABMS) identified six core
competencies required of residents and
physicians to deliver high quality medical care—
– patient care,
– medical knowledge,
– practice-based learning and improvement,
– interpersonal and communication skills,
– professionalism, and
– systems-based practice.
Health Promoting Hospitals
• Standard 1. The organization has a written policy for health
promotion. The policy is implemented as part of the overall
organization quality improvement system, aiming at improving health
outcomes. This policy is aimed at patients, relatives and staff.
• Standard 2. The organization ensures that health professionals, in
partnership with patients, systematically assess needs for health
promotion activities.
• Standard 3. The organization provides patients with information on
significant factors concerning their disease or health condition and
health promotion interventions are established in all patient
pathways.
• Standard 4. The management establishes conditions for the
development of the hospital as a healthy workplace.
• Standard 5. The organization has a planned approach to
collaboration with other health service levels and other institutions
and sectors on an ongoing basis.
ကုသရ ေးဦေးစေးဌာန
• Vision
– May be same as Ministry of Health
မူဝါဒ (Mission)
• ၁။ မမ ြို့ ပြနှင့် ကက ျေးလကကေ ပြညသူမ းျေးားးျေးလျေး
မြျေးပြည့်စကသး
က ေျေးမးက ျေးကစးင့်က ှးကမှုလြငေျေးက
ား ညားကသျေးပြည့်မစး ှက ျေး
က းင ကကြျေး ေ
• ၂။ က ျေးရားကပြေပြ ကသက ျေးလြငေျေးနှင့်
ပြညသူလူထားတငျေး
ကငျေး ငျေးကသမှုလြငေျေးမ းျေးက းင ကကြျေးနင
ေ
ကုသရ ေးဦေးစေးဌာန
ညမှေျေးြေ က (Objectives)
၁။ က ေျေးမးက ျေးကစးင့ ့်က ှးကမှုားပ့က့ြေားကေ
လွှမျေးပြေ မှုတျေးတကလးကစက ျေး
၂။ ပြညသူ ့်က ျေးရမ းျေး၏
ကသမှုား ညားကသျေးပမင့ ့်မးျေးက ျေး
၃။ နငငကတး၏ က ေျေးမးက ျေးမူ၀ါဒနှင့ ့်ားည
ြဂ္ဂလက က ေျေးမးက ျေးလြငေျေးမ းျေး
တျေးတကပြစထေျေး ကစက ျေး
• Strategies
ကုသရ ေးဦေးစေးဌာန
၁။ စမကေျေးဌးေြေွဲ ၉။ စစက ျေးက ျေးဌးေြေွဲ
၂။ စမြေေ ့်ြေွဲက ျေးဌးေြေွဲ ၁၀။ သူေးပြ ဌးေြေွဲ
၃
။
ကသက ျေး/က ျေးားကးားကယ/
က ျေးြေဌးေြေွဲ
၁၁။ ားမ ျေးသးျေးက ေျေးမးက ျေးဓါတါတြေွဲ
မှု င းဌးေြေွဲ
၄
။
ြဂ္ဂလက က ေျေးမးက ျေးဌးေြေွဲ ၁၂။ ားမ ျေးသးျေးကသျေးဌးေြေွဲ
၅
။
က ျေးနှင့်က ျေးြစစညျေးဝယယူက ျေး
ဌးေြေွဲ
၁၃။ ဘဏ္ဍးက ျေးဌးေြေွဲ
၆
။
က ျေးနှင့်က ျေးြစစညျေး
ပ့ြေ ့်ပြ ျေးက ျေး ဌးေြေွဲ
၁၄။ သးျေးနှင့်ြေတငျေးက ေျေးမးက ျေးဌး
ေြေွဲ
၇
။
ကသမှုကထးကကူပြ ဌးေြေွဲ
၈ က းကလြက ျေးဌးေြေွဲ
ရ ေးရုမ ာေးတုေးတက်မှုအရ ြေအရန က န်ေးမာရ ေးဝန်ထမ်ေးနှင့််
လူဦေးရ အရ ြေအရန
ြေတငစစကြါငျေး - ၅၄၃၃၇ ြေင့်ပြ းဝေ -
၁၃၄၅၆
က ျေးရစစကြါငျေး - ၁၁၂၂ ြေင့်ပြ သူေးပြ -
၃၄၂၅၇
ဗဟား င့်က ျေးရ - ၃၇ လူဦျေးက -
၅၁၉၄၄၄၈၀.၆၅
ားထူျေးကက ျေးရ - ၃၃ းဝေနှင့်လူဦျေးက ားြေ ျေး - ၁ ့ျေး
၄၂၈၉
သငကကးျေးက ျေးက ျေးရကကျေး - ၇ းဝေနှင့်သူေးပြ ားြေ ျေး - ၁ ့ျေး
၃
ြေတင ၅၀၀ ့်က ျေးရကကျေး - ၁၁ းဝေနှင့်ြေတငားြေ ျေး - ၁ ့ျေး
၅
ြေတင ၃၀၀ ့်က ျေးရကကျေး - ၃ သူေးပြ နှင့်လူဦျေးက ားြေ ျေး - ၁ ့ျေး
၁၅၁၆
ြေတင ၂၀၀ ့်က ျေးရကကျေး - ၂၈ သူေးပြ နှင့် ြေတငားြေ ျေး - ၁ ့ျေး ၂
ြေတင ၁၅၀ ့်က ျေးရ - ၂ လူဦျေးက နှင့်ြေတငားြေ ျေး - ၉၅၆
့ျေး ၁
ြေတင ၁၀၀ ့်က ျေးရ - ၄၁
• ားထူျေးကက ျေးြေေျေး - ၅၀၁
• က ျေးရ - ၁၉၃
• သးျေးြးျေးြေေျေး -၂၇
• က းဂ္ါ ှးကြက ျေးလြငေျေး (ဓါတါတြေွဲ) -၁၆၈
• က းဂ္ါ ှးကြက ျေးလြငေျေး (ဓါတါတမှေ) - ၁၂၁
• သူေးပြ စက ျေးကဂ္ဟး - ၁
• က ေျေးမးက ျေးားက ျေးက းငလြငေျေး - ၁၃
• ားကထကထက ေျေးမးက ျေးလြငေျေး - ၁၆
• ားကထကထက းဂ္ါကက ျေးြေေျေး - ၄၆၈၇
Useful website, email, application
• http://www.who.int/management/en/
• http://www.safetyandquality.gov.au/
• http://erc.msh.org/toolkit/
• https://www.mindtools.com/pages/article/newLDR_84.ht
m
• http://www.businessballs.com/leadership-
theories.htm#overview-leadership-article
• http://www.health.nsw.gov.au/infectious/controlguideline/
pages/default.aspx
• http://www.gapminder.org/
• http://www.thelancet.com/journals/lancet/issue/current
• http://www.pyithuhluttaw.gov.mm/?q=laws
References and resources

Quality in hospital

  • 1.
    Quality Improvement inHospitals Dr Than Naing Htut MBBS (UMM) MPH (UOPH) MHM, MIPH (UNSW)
  • 2.
  • 3.
    • The illiterateof the 21st century will not be the individual who cannot read and write, but the one who cannot learn, unlearn and relearn. Alan Toffler
  • 4.
  • 5.
  • 6.
    Reflective learning isa type of learning where you link new information to what you already know
  • 7.
    What is criticalthinking? (CT) Consider that CT has 4 main parts question analysis reflection evaluation Criticalcomes from the Greek words to separateand to discern
  • 9.
    I have no time… Theydon’t read enough!! …To understand and link to collect all the stuff! The how and the why The what
  • 10.
    Quality Improvement (QI) •“QI is a systemic approach to planning and implementing continuous improvement in performance” • QI implementation is demanding on individuals and organizations. It requires sustained leadership, extensive training and support, robust measurement and data systems, realigned incentives and human resources practices, and cultural receptivity to change (Shortell, Bennett, and Byck 1998; Ferlie and Shortell 2001; Institute of Medicine 2001; Meyer et al. 2004)
  • 11.
    6 Dimensions ofQuality 1. SAFETY (The extent to which potential risks are avoided and inadvertent harm in minimised in care delivery processes) 2. EFFECTIVENESS (The extent to which a treatment, intervention or service achieves the desired outcome) 3. APPROPRIATENESS (The selection of the intervention that is most likely to produce the desired outcome) 4. ACCESS (The extent to which an individual or population can obtain health care services) 5. CONSUMER PARTICIPATION/ SATISFACTION 6. EFFICIENCY
  • 12.
    Efficiency in HealthCare • Choices in health care delivery and treatments should be made so as to derive maximum total benefit from the available health care resources • TECHNICAL EFFICIENCY: – the degree to which the least cost combination of resource inputs occur in production of a particular service. • ALLOCATIVE EFFICIENCY: – the degree to which maximum benefit (or outcomes) are obtained from available resources. Health Economic Main Concept “Scarcity of the resources”
  • 15.
  • 16.
  • 17.
    Systems within Systems. . . Self-care System Individual caregiver & patient System Clinical Microsystem Macro Organization System Community, Market, Social Policy System
  • 18.
    Microsystems are everywhere; however,some function better than others
  • 19.
    What Are TheCharacteristics of High Performing Microsystems? • Leadership • Organizational Support • Staff Focus • Education and Training • Interdependence • Patient Focus • Community and Market Focus • Performance Results • Process Improvement • Information and Information Technology
  • 20.
  • 21.
  • 22.
    What is requiredof health services managers? • Knowledge of the field; values; culture (Lawson & Rotem: 2004) • Leadership; organisational planning; external relations; monitoring and evaluation(Liang and Brown: 2008) • Technical skills; industry knowledge; analytical and conceptual reasoning; interpersonal and emotional intelligence (Robbins et al: 2001) • Personal skills; interpersonal skills, group skills, communication skills (Carlopio and Andrewartha: 2008) • Leadership; communication; lifelong learning; consumer/community responsiveness and public relations; political and health environment awareness; conceptual skills; results oriented management; resources management; compliance with standards, ethics and laws (CCHSE: 2005) • Local knowledge; basic skills of working with people; basic skills of working with data; library of theory; toolbox of technical knowledges and methods; repertoire of different managerial personae; judgement or self knowledge, ethical practice (Smyth et al, in Harris 2006) • Wisdom (Rooney, Mintzberg, Reason, various)
  • 23.
    ‘Modern’ approaches tomanagement • The 20th Century has been called the ‘management’ century • Roots of current management theory in engineering and predominantly in the USA • Three ages of management: • The age of scientific management (productivity) from early 1900s until WWI • The age of modern management (human relations and strategic thinking) until the 1980s • The age of change (‘nervous’ globalism, GFC and its causes, focus on transformational leadership)
  • 26.
    Manager to Leader Tomake the transition successfully managers must navigate a tricky set of changes in their leadership focus and skills: • 1. Specialist to generalist • 2. Analyst to integrator • 3. Tactician to strategist • 4. Bricklayer to architect • 5. Problem solver to agenda setter • 6. Warrior to diplomat • 7. Supporting cast member to lead role (Watkins, M (2012) Harvard Business Review)
  • 29.
    Leadership, Management and Knowledge •Leadership of a change effort involves setting a direction, aligning people with a vision, and motivating them to achieve it. • Management by contrast, brings order and consistency – it involves planning, budgeting , and monitoring • Turning tacit knowledge into broadly shared explicit knowledge is the only way to achieve large-scale change in healthcare (Bate, Bevan & Robert, 2014)
  • 32.
    Why is implementingchange so hard? • Resistance –Fear, anxiety, uncertainty, lack of control…… excitement?? • Innovation fatigue –Low morale • Cultural inertia: collective human habits • Emotional attachment • No engagement
  • 33.
    Change is onlypossible if: (Di x De x P) > R Where: • Di = Dissatisfaction • De = Desirability • P = Practicality • R = Resistance to Change (Beckhard & Harris, 1977)
  • 36.
    Why 70 %of changes fail Kotter (1995) argued that organisational transformation efforts fail because: • A (great enough) sense of urgency is not established • A powerful (enough) coalition has not been established • There is no clear vision for the change • The vision is under-communicated • Obstacles to the new vision are not removed • Short term wins have not been planned or created • Victory is declared too soon • Changes are not anchored in the organisation’s culture Visions are intended to create ‘… a coherent view of the future that forms an over-arching objective for the organisation’ (Hussey, 2000: 72)
  • 39.
  • 41.
    Safety of PatientCare • Across the world, people seeking care in hospitals are harmed 9.2% of the time, with death occurring in 7.4% of these events. • Furthermore, it is estimated that 43.5% of these harm events are preventable. » de Vries E, Ramrattan M, Smorenburg S, Gouma DJ • Healthcare, as an industry, has failed to make as many gains in safety as other industries – 44,000 to 98,000 individuals die from medical errors each year in the US » IOM, To Err is Human, 1999 – It is estimated that in Australia, 16.6% of people admitted to the hospital suffer from an adverse event » Wilson R, Runciman W, Gibberd R, Harrison B, Newby L, Hamilton J. The Quality in Australia Health Care Study. Med J Aust. 1995(163):458-76.
  • 43.
    Most Common Causesof Errors • Communication problems • Inadequate information flow • Human (or performance) problems • Patient-related issues • Organizational transfer of knowledge • Staffing patterns/work flow • Technical failures • Inadequate policies and procedures AHRQ, Patient Safety Initiative: Building Foundations, Reducing Risk. Interim Report to the Senate Committee on Appropriations. 2003, Agency for Healthcare Research and Quality: Rockville, MD.
  • 47.
    Many Ways toDetect Adverse Events Passive methods of surveillance : • Traditional voluntary reporting – useful, but identifies only the tip of safety iceberg • Clinical indicators tracking • Nosocomial infection reporting systems • ICD coding Active methods of surveillance : • Chart review – best, but expensive e.g. CRP, AE study • Chart review - IHI Global Trigger Tool (GTT) • Direct observation (e.g. HH, Medication Rounds, Code Blue) • IT – reduced costs and man hours but not all AEs can be detected using coded data – improvements in techniques to extract concepts from clinical narratives still needed.
  • 48.
    Improvement always startswith a question or problem! • How can we improve the use of blood products within theatre in line with current clinical practice guidelines? • Why is the post-surgery infection rate higher in our hospital/department than other comparable hospitals/departments? • Are our patients satisfied with current waiting times at our clinic? • Is the use of sedatives on discharge appropriate at our hospital and how can it be improved? • How can we improve Quality?
  • 49.
    Quality Improvement Model •PDCA • Lean • Six-Sigma • Change Management
  • 57.
    • “You canonly improve something if you can measure it” - Lord Kelvin
  • 58.
    Types of Measurements 1.Input (e.g. no.staff, equipment, time spent) 2. Process (e.g. % patients receiving Aspirin on admission) 3. Outcome (e.g. Wound infection rate, Fall rate) • Process measures are used to monitor whether a change has occurred • Outcome measures may be from provider perspective and patient perspective
  • 60.
    Variation Two Types ofVariation types (Shewhart) 1) Common Cause Variation •Also known as random or unassignable variation •Is inherent in the design of the process •Has a consistent pattern •Is due to constant, regular, natural or ordinary causes •Results in a “stable” process that is predictable; process is in-control 2) Special Cause Variation •Also known as non-random or assignable variation •Is due to irregular or unnatural causes that are not inherent in the design of the process •Has a varying pattern •Results in an “unstable” process that is not predictable; process is out-of-control
  • 61.
    1) Common CauseVariation •It does not mean “Good Variation” •It only means that the process is stable and predictable For example: A patient’s blood pressure averages around 165/100 mmHg and is usually between 170/110 and 160/90 mmHg. It is stable and predictable but unacceptable Understanding variation
  • 62.
    2) Special CauseVariation •It should not be viewed as “Bad Variation” •You could have a special cause that represents a very good result (e.g., a low turnaround time), which you would want to emulate •Special cause merely means that the process is unstable and unpredictable •Needs attention/effort to be fixed
  • 63.
    1) Common CauseVariation • It is about changing (re-design) the process • It leads to an increase in process capability (conformance-to-requirements) 2) Special Cause Variation • It is about fixing (eliminating causes and adjustment) the process. • It leads to stability in process (predictability) How do we reduce variation?
  • 64.
    Detecting Special Causes RunChart A special cause is indicated when there is: • The presence of too much or too little variability • The presence of a shift in the process • The presence of a trend Control Charts A special cause is indicated when: • a single point falls outside a control limit • two out of three successive values are on the same side of the centerline and more than two standard deviations from the centerline • eight or more successive values fall on the same side of the centerline • a trend of six or more values in a row steadily increasing or decreasing
  • 65.
    Run chart • Plotdata sequentially over time • Central measure (median) • Helps identify  Trend over time  Shifts  Variation
  • 66.
    Run chart 0 10 20 30 40 50 60 70 80 90 1 23 6 7 8 9 10 13 14 15 16 17 20 21 22 23 24 27 28 29 30 Timeinminutes Date Average time-to analysis for July 2011
  • 67.
    • XmR chart– two components • X chart (observed values) • mR chart (moving range) 1. Calculate the average • List the data in its time series order • Calculate the average ( X ) • Plot the individual observations • Use the average to mark the central line Creating the Control (XmR) Chart
  • 68.
    2. Calculate themoving range and its average • Calculate the difference between successive observations (the moving range) • Use absolute values (Ignore any minus signs) • There should be n-1 of entries for moving range • Calculate the average of the moving range • Multiply the average of the moving range by the correction constant “E”
  • 69.
    • Calculate thecontrol limits • X ± (E * mean mR) • E is a correction factor that depends on subgroup size • Correction Factor = 3 divided by the empirical constant 1.128 = 2.66 • Control limits = X  (2.66 * mean moving range) Mohammed MA et al, Plotting basic control charts: tutorial notes for healthcare practitioners. Qual Saf Health Care 2008;17:137–145
  • 70.
    Patient’s Systolic BPover 26 days • Mohammed MA et al, Plotting basic control charts: • Co Mean = 173.2 Mean moving range = 11 Control limits = Mean (173.2)  (2.66 *11 (Mean moving range) UCL 202.5 LCL 143.9
  • 71.
    Control Chart ofsystolic BP (Mohammed et al.)
  • 72.
    Essentials of XmRControl Charts • Display of data over time • Center line is the mean • Moving range is the point to point variation in the data and is always needed to calculate the control limits • Control limits are generated from the average moving range • Information about special and common cause variation is interpreted using specific rules • Standard deviation is calculated differently in “basic statistics”
  • 86.
  • 102.
    Exercise: Strength ofIntervention • Remove unnecessary and dangerous steps from a process • (Strong) • Train staff on IV pump use • (Weak) • Add a checklist for surgical procedure • (Intermediate) • Write a new hospital policy about patient transport • (Weak) • Replace all IV pumps in the hospital with a single model • (Strong) • Redesign crash cart or supply room to keep easily confused drugs apart • (Strong)
  • 103.
    Resources Framework of factorsinfluencing clinical practice Factor types Influencing contributory factors Examples Institutional context Economic and regulatory context; national health service executive; clinical negligence scheme for trusts Inconsistent policies, funding problems Organisational and management factors Financial resources and constraints; organisational structure; policy standards and goals; safety culture and priorities Lacking senior management procedure for risk reduction Work environment factors Staffing levels and skills mix; workload and shift patterns; design, availability, and maintenance of equipment; administrative and managerial support High workload, inadequate staffing, or limited access to essential equipment Team factors Verbal communication; written communication; supervision and seeking help; team structure (consistency, leadership, etc) Poor communication between staff Individual (staff) factors Knowledge and skills; competence; physical and mental health Lack of knowledge or experience of specific staff Task factors Task design and clarity of structure; availability and use of protocols; availability and accuracy of test results Non-availability of test results or protocols Patient factors Condition (complexity and seriousness); language and communication; personality and social factors Distressed patient or language problem Source: Vincent Charles, Taylor-Adams Sally, Chapman E Jane, Hewett David, Prior Sue, Strange Pam et al. How to investigate and analyse clinical incidents: Clinical Risk Unit and Association of Litigation and Risk Management protocol BMJ 2000; 320:777
  • 106.
    Some QI intiatives •Ward based standard procedures, treatment guidelines • Enhanced credentialing framework including “Train-the-Trainer” • Mandatory attendance for MO/HO for BCLS and high-risk ward-based procedures like CPR, chest tube • Specific & Core Privileges • Re-privileging for specific and core procedures based on evidence on outcome • Mandated setting up of Dept Credentialing Committee • Quality & Safety as part of System Based Practice (SBP) CME program , Case based study (Trainer - CEO), • Residents’ participation in patient safety leadership walkrounds by rotation • 3.5 days workshop on quality improvement with completion of 1 project • Story Board
  • 107.
    Department-specific initiative ofchoice to reduce ALOS, readmissions, short-stays or long-stays • a) Discharge before noon & review at EMD • b) Reduce long-stay patients (improve coordination of care, delays, step-down and home-care) • c) Provide timely and appropriate access to investigations (for CT, MRI, Echo) • d) Improve Safety Standards • e) measuring individual doctors’ performance, and other
  • 108.
    HOSPITAL QUALITY IMPROVEMENT: STRATEGIESAND LESSONS FROM U.S. HOSPITALS • 1. A trigger serving as a “wake-up call” that prompts the hospital to begin or renew an emphasis on quality improvement, marking the beginning of cultural shift and leading to . . • 2. organizational and structural changes such as establishment of quality- related councils and committees, empowerment of nurses and other staff, and investments in new technology and infrastructure that facilitate . . . • 3. a new problem-solving process, involving a standardized, systematic, multidisciplinary team approach to identify and study a problem area, conduct root cause analysis, develop action plans, and hold team leaders accountable, resulting in establishment of . . . • 4. new protocols and practices, including evidence-based policies and procedures, clinical pathways and guidelines, error-reducing software, and patient flow management techniques, leading to . . . • 5. improved outcomes in process and health-related measures (e.g., patient flow, errors, complications, mortality), satisfaction and work environment, and “bottom line” indicators such as reduced length of stay and increased market share. Experiencing such positive results then served as motivation to hospital staff to expand their efforts, thus turning the above sequence into a self-sustaining cycle.
  • 112.
    Meso and MicroHospital Policies
  • 113.
    Understanding And ImprovingThe Performance Of Quality Improvement Teams • Teams can be: – permanent or temporary , – formal (created by an organization or institution) or informal (created by individuals to fulfil their own needs), – goal directed or relationship directed (or both) • Teams must: – adapt to changing circumstances, – ensure the satisfaction of team members, and – maintain and improve their performance over time – have a shared understanding of their goals (Johnson and Barach, 2011)
  • 117.
    How does cultureaffect safety? • Lack of integration of health care systems and services Resource, competing priorities and inadequate staffing and work overload • Financial incentives to conceal errors • Acceptance of poor, expectation of good quality services and techniques e.g. written and oral communication • Teams and services that are fragmented • Professional and organisational culture clashes including definitions of errors (Sub-organizational culture) • Lack of senior leadership involvement in safety strategies • Lack of clinician engagement • Blame and shame, the ‘eating of young’ • The catching and or concealment or errors and near misses by colleagues • Treatment of whistle-blowers and other system critics • Involvement of consumers and carers • Resistance to change • Rate of change and innovation • Level(s) of commitment to organisational learning and improvement • Integration of safety programs and the use of data
  • 118.
    QI • QI combinesthree elements: – use of cross-functional teams to identify and solve quality problems, – use of scientific methods and statistical tools by these teams to monitor and analyse work processes, and – use of process-management tools (e.g., flow charts that graphically depict steps in a clinical process) to help team members use collective knowledge effectively. • QI achieves its full potential when it pervasively penetrates organizational routines and becomes a ‘‘way of doing business’’ throughout the organization. Such penetration is critical for sustainable success
  • 119.
    Quality Improvement Collaborative(QIC) • The most widely used QIC approach in controlled outcome studies is the Breakthrough Series (BTS) developed by the Institute for Healthcare Improvement (IHI 2003). • The BTS’s components include – formation of a planning group that decides on a target objective and identifies areas for change, pre-work from participants (e.g., identifying QI team members and roles and planning for necessary supports), – in-person learning sessions during which teams learn clinical and QI approaches, and – ongoing support (e.g., phone calls, visits, email, brief reports). – Between learning sessions, participants engage in plan-do- study-act (PDSA) cycles during which – they make small interventions and assess their impact
  • 120.
    Components of QIC •fourteen crosscutting structural and process-oriented components, including – in-person learning sessions, phone meetings, data reporting, feedback, training in QI methods, and use of process improvement methods and Organizational involvement • On average, each study implemented an average of six or seven QIC components. The most commonly reported components were in-person learning sessions (twenty out of twenty), PDSAs (fifteen out of twenty), multidisciplinary QI team (fourteen out of twenty) • All the QICs in these studies included didactic training in a particular care process or practice (e.g., the Chronic Care model, pain management guidelines). They provided training in quality improvement techniques, such as PDSA cycles, sharing of ideas and experiences, the change package, interactions during in- person sessions, and the collaborative Internet
  • 122.
    A review of1784 hospital QI 1. Percentage of hospital staff and percentage of senior managers participating in formally organized QI teams are associated with better values on quality indicators 2. scope of QI implementation in hospitals is significantly associated with hospital-level quality indicators
  • 125.
    Where are theyheading • The Accreditation Council for Graduate Medical Education (ACGME) and the American Board of Medical Specialties (ABMS) identified six core competencies required of residents and physicians to deliver high quality medical care— – patient care, – medical knowledge, – practice-based learning and improvement, – interpersonal and communication skills, – professionalism, and – systems-based practice.
  • 128.
    Health Promoting Hospitals •Standard 1. The organization has a written policy for health promotion. The policy is implemented as part of the overall organization quality improvement system, aiming at improving health outcomes. This policy is aimed at patients, relatives and staff. • Standard 2. The organization ensures that health professionals, in partnership with patients, systematically assess needs for health promotion activities. • Standard 3. The organization provides patients with information on significant factors concerning their disease or health condition and health promotion interventions are established in all patient pathways. • Standard 4. The management establishes conditions for the development of the hospital as a healthy workplace. • Standard 5. The organization has a planned approach to collaboration with other health service levels and other institutions and sectors on an ongoing basis.
  • 129.
  • 130.
    မူဝါဒ (Mission) • ၁။မမ ြို့ ပြနှင့် ကက ျေးလကကေ ပြညသူမ းျေးားးျေးလျေး မြျေးပြည့်စကသး က ေျေးမးက ျေးကစးင့်က ှးကမှုလြငေျေးက ား ညားကသျေးပြည့်မစး ှက ျေး က းင ကကြျေး ေ • ၂။ က ျေးရားကပြေပြ ကသက ျေးလြငေျေးနှင့် ပြညသူလူထားတငျေး ကငျေး ငျေးကသမှုလြငေျေးမ းျေးက းင ကကြျေးနင ေ
  • 131.
    ကုသရ ေးဦေးစေးဌာန ညမှေျေးြေ က(Objectives) ၁။ က ေျေးမးက ျေးကစးင့ ့်က ှးကမှုားပ့က့ြေားကေ လွှမျေးပြေ မှုတျေးတကလးကစက ျေး ၂။ ပြညသူ ့်က ျေးရမ းျေး၏ ကသမှုား ညားကသျေးပမင့ ့်မးျေးက ျေး ၃။ နငငကတး၏ က ေျေးမးက ျေးမူ၀ါဒနှင့ ့်ားည ြဂ္ဂလက က ေျေးမးက ျေးလြငေျေးမ းျေး တျေးတကပြစထေျေး ကစက ျေး
  • 132.
  • 133.
    ကုသရ ေးဦေးစေးဌာန ၁။ စမကေျေးဌးေြေွဲ၉။ စစက ျေးက ျေးဌးေြေွဲ ၂။ စမြေေ ့်ြေွဲက ျေးဌးေြေွဲ ၁၀။ သူေးပြ ဌးေြေွဲ ၃ ။ ကသက ျေး/က ျေးားကးားကယ/ က ျေးြေဌးေြေွဲ ၁၁။ ားမ ျေးသးျေးက ေျေးမးက ျေးဓါတါတြေွဲ မှု င းဌးေြေွဲ ၄ ။ ြဂ္ဂလက က ေျေးမးက ျေးဌးေြေွဲ ၁၂။ ားမ ျေးသးျေးကသျေးဌးေြေွဲ ၅ ။ က ျေးနှင့်က ျေးြစစညျေးဝယယူက ျေး ဌးေြေွဲ ၁၃။ ဘဏ္ဍးက ျေးဌးေြေွဲ ၆ ။ က ျေးနှင့်က ျေးြစစညျေး ပ့ြေ ့်ပြ ျေးက ျေး ဌးေြေွဲ ၁၄။ သးျေးနှင့်ြေတငျေးက ေျေးမးက ျေးဌး ေြေွဲ ၇ ။ ကသမှုကထးကကူပြ ဌးေြေွဲ ၈ က းကလြက ျေးဌးေြေွဲ
  • 134.
    ရ ေးရုမ ာေးတုေးတက်မှုအရြေအရန က န်ေးမာရ ေးဝန်ထမ်ေးနှင့်် လူဦေးရ အရ ြေအရန ြေတငစစကြါငျေး - ၅၄၃၃၇ ြေင့်ပြ းဝေ - ၁၃၄၅၆ က ျေးရစစကြါငျေး - ၁၁၂၂ ြေင့်ပြ သူေးပြ - ၃၄၂၅၇ ဗဟား င့်က ျေးရ - ၃၇ လူဦျေးက - ၅၁၉၄၄၄၈၀.၆၅ ားထူျေးကက ျေးရ - ၃၃ းဝေနှင့်လူဦျေးက ားြေ ျေး - ၁ ့ျေး ၄၂၈၉ သငကကးျေးက ျေးက ျေးရကကျေး - ၇ းဝေနှင့်သူေးပြ ားြေ ျေး - ၁ ့ျေး ၃ ြေတင ၅၀၀ ့်က ျေးရကကျေး - ၁၁ းဝေနှင့်ြေတငားြေ ျေး - ၁ ့ျေး ၅ ြေတင ၃၀၀ ့်က ျေးရကကျေး - ၃ သူေးပြ နှင့်လူဦျေးက ားြေ ျေး - ၁ ့ျေး ၁၅၁၆ ြေတင ၂၀၀ ့်က ျေးရကကျေး - ၂၈ သူေးပြ နှင့် ြေတငားြေ ျေး - ၁ ့ျေး ၂ ြေတင ၁၅၀ ့်က ျေးရ - ၂ လူဦျေးက နှင့်ြေတငားြေ ျေး - ၉၅၆ ့ျေး ၁ ြေတင ၁၀၀ ့်က ျေးရ - ၄၁
  • 135.
    • ားထူျေးကက ျေးြေေျေး- ၅၀၁ • က ျေးရ - ၁၉၃ • သးျေးြးျေးြေေျေး -၂၇ • က းဂ္ါ ှးကြက ျေးလြငေျေး (ဓါတါတြေွဲ) -၁၆၈ • က းဂ္ါ ှးကြက ျေးလြငေျေး (ဓါတါတမှေ) - ၁၂၁ • သူေးပြ စက ျေးကဂ္ဟး - ၁ • က ေျေးမးက ျေးားက ျေးက းငလြငေျေး - ၁၃ • ားကထကထက ေျေးမးက ျေးလြငေျေး - ၁၆ • ားကထကထက းဂ္ါကက ျေးြေေျေး - ၄၆၈၇
  • 136.
    Useful website, email,application • http://www.who.int/management/en/ • http://www.safetyandquality.gov.au/ • http://erc.msh.org/toolkit/ • https://www.mindtools.com/pages/article/newLDR_84.ht m • http://www.businessballs.com/leadership- theories.htm#overview-leadership-article • http://www.health.nsw.gov.au/infectious/controlguideline/ pages/default.aspx • http://www.gapminder.org/ • http://www.thelancet.com/journals/lancet/issue/current • http://www.pyithuhluttaw.gov.mm/?q=laws
  • 137.