Downloaded 268 times
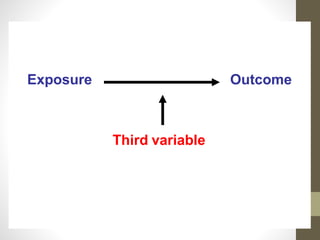
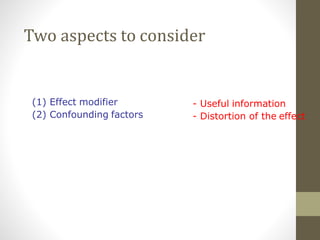
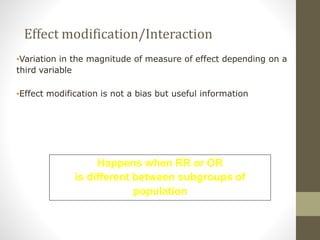
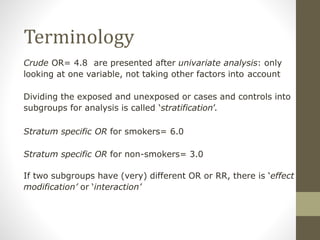
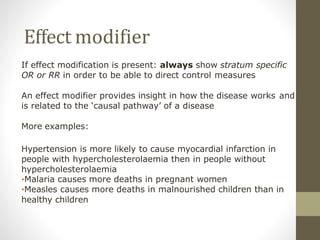
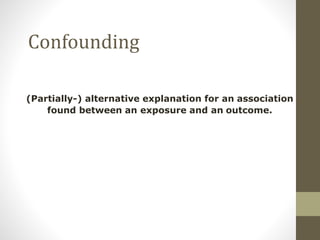


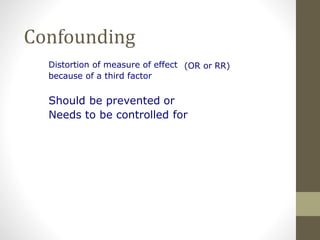
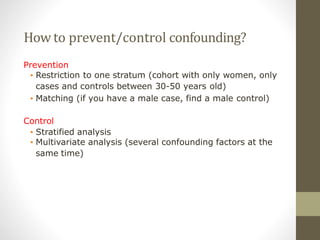
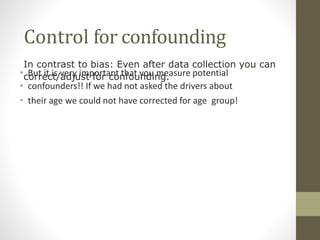
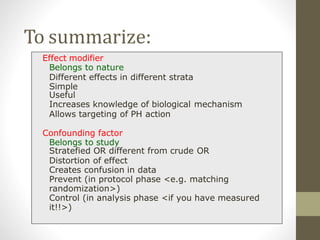
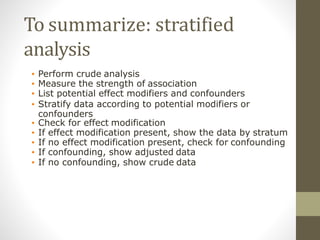
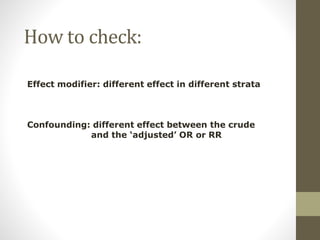
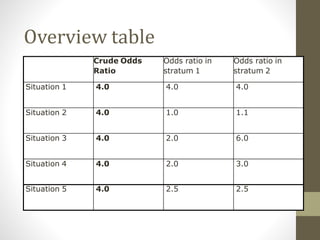
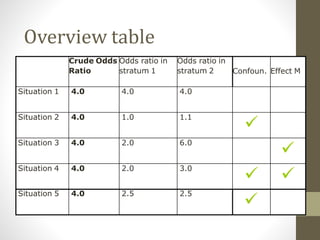
1. Effect modification and confounding are two aspects to consider when examining the relationship between an exposure and outcome. Effect modification provides useful information about how a third variable impacts the relationship, while confounding can distort the observed effect. 2. Stratifying the data and calculating stratum-specific odds ratios is a way to check for effect modification and confounding. Effect modification is present if the odds ratios differ substantially between strata. Confounding is present if the crude odds ratio differs from the stratified odds ratios. 3. It is important to measure potential confounding factors so they can be controlled for through stratification or multivariate analysis. This prevents confounding from distorting the observed effect between the exposure and outcome.