SlideShare a Scribd company logo
Table of Contents
Introduction……………..…………………………………………….1
Demography, Demographic Analysis, Population Studies
Sources of Demographic Data.……………………………………….2
Census, Civil Registration System, Uses of Civil Registration, Sample Surveys
Population Census………………………………………...…………..3
Features of population census, sponsorship, defined territory, university, simultaneity,
individual unity, compilation and publication
Vital Registration……………………………………………….…….4
Demographic Survey……………………………………………….....4
Age, Ethnicity, Education, Employment
Household Survey……………………………………………………..7
Components of Population Growth………………………………….7
Fertility, Mortality, Immigration, Natality
Population Composition………………………………………….…...7
Age structure, Sex composition, Rural-Urban Composition
Errors in Demographic Data…………………………………….……8
What is error, Coverage errors, Content errors, Errors in age data
Demographic Measures……………………………………….…….....9
Count, Rate, Ratio, Fertility, Fertility Rate, Mortality, Mortality Rate
Reference………..………..……………………………………………11
INTRODUCTION
Demography is the statistical analysis of population data. The term Demography,
was coined from two Greek words (demos meaning people, and graphein meaning to write or
describe). The term “Demography” is the statistical and mathematical study of the size,
composition, and spatial distribution of human population, and of changes over time in these
aspects through the operation of five processes of fertility, mortality, marriage, migration and
social mobility. Usually the demographic data are drawn from various sources such as national
censuses, civil registration system as well as the sample surveys. Modern demography is divided
into two parts, namely
Demographic Analysis – this deals with the study of the components of change in the population.
These components are also called population dynamics, i.e. fertility, mortality, and migration.
Population Studies – this deals with addressing demographic events and phenomenon in the socio
– economic context. It relates population dynamics to socio – economic, biological, and political
or other environmental factors.
Ideally, the study of demography requires extensive and accurate population statistics. The
demographer subsists by calculating rates, assuming implicitly a decision – making process
regarding when, how many and how far in – between to have babies; by explaining birth intervals
by postpartum amenorrhea, voluntary abstinence, contraceptive use – effectiveness, period of
Infecundability and related fertility – inhibiting indicators; by constructing elegant life tables; by
measuring activity rates and migration rates and by periodically projecting the size of the total
population by its components; by validating and updating the results usually presented in three
variants – high, medium and low, using census figures where available and vital registration where
these exist.
SOURCES OF DEMOGRAPHIC DATA
(A) CENSUS
It is compiling, evaluating, analysing and publishing demographic, economic and
social data pertaining, at a specific time, to all persons in a country or in a well-delimited part of
a country.” In other words, the enumeration of the entire population of a country or a region at a
particular time is known as census.
How a National Census is taken:
Census taking is a very complex and extensive task and is, therefore, usually
conducted by governments. In many countries, provision for census taking is made by law. While
such a law makes the co-operation of each citizen mandatory, it also ensures that confidential
nature of census information provided by individuals shall be preserved.
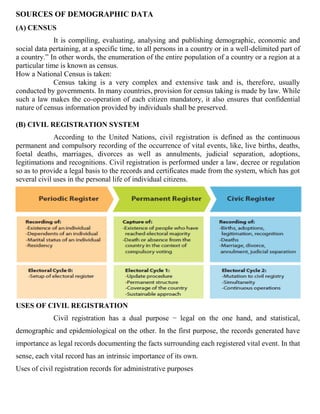
(B) CIVIL REGISTRATION SYSTEM
According to the United Nations, civil registration is defined as the continuous
permanent and compulsory recording of the occurrence of vital events, like, live births, deaths,
foetal deaths, marriages, divorces as well as annulments, judicial separation, adoptions,
legitimations and recognitions. Civil registration is performed under a law, decree or regulation
so as to provide a legal basis to the records and certificates made from the system, which has got
several civil uses in the personal life of individual citizens.
USES OF CIVIL REGISTRATION
Civil registration has a dual purpose − legal on the one hand, and statistical,
demographic and epidemiological on the other. In the first purpose, the records generated have
importance as legal records documenting the facts surrounding each registered vital event. In that
sense, each vital record has an intrinsic importance of its own.
Uses of civil registration records for administrative purposes
Live birth records are the basis for many public health programmes for post‐natal
care of mother and child, and may be used, when needed, for programmes of vaccination and
immunization, premature‐baby care, assistance to disabled persons. Death records are used to
provide legal permission for burial or other disposal of deceased individuals. They can also
provide information of epidemiological importance, and indicate the need for preventive control
measures. Death records are also necessary to clear a number of administrative files, such as
disease‐case registers, population registers, social security files, military service files, electoral
rolls, identity files and tax registers
(C) SAMPLE SURVEYS
There are three systems which provide data on vital rates at the national level. These
are National Sample Survey, Sample Registration System and in recent years, National Family
Health Surveys. These surveys provide different kinds of data, but all of them provide certain
fertility and mortality indicators. In other words Sample survey seeks to collect information only
from a fraction of the population. It is employed to arrive at estimates of demographic
characteristics, size, distribution, mortality, fertility and migration. In Pakistan, the efforts to
generate reliable demographic data has included the conduct of numerous national sample surveys.
POPULATION CENSUS
A census of population may be defined as the total process of collecting, compiling
and publishing demographic, economic and social data pertaining, at a specified time or times, to
all persons in a country or delimited territory.
Essential Features of the Census
Some of the essential features of an official national census are;
Sponsorship - an official national census is sponsored and carried out by the national government.
Defined Territory - the coverage of a census operation should relate to a precisely defined
territory.
Universality – the enumeration should include every member of the community within the scope
of the census without omission or duplication.
Simultaneity - the total population enumerated should refer to one well defined point of time.
Individual unity – a census implies that separate data are recorded for each individual by direct
enumeration and not by registration.
Compilation and publication – the compilation and publication of data by geographic areas and
by basic demographic variables is an integral part of a census.
VITAL REGISTRATION
The vital registration is the continuous, permanent and compulsory registration of the
occurrence and characteristics of vital events – births, deaths, marriages, change of name,
nationalisation e.t.c The statistics generated from the exercise is referred to as vital statistics
because they have to do with the individuals entry into, and departure out of life, with the changes
in the civil status of the individual in his/her life time.
In many developing countries, vital statistics are inadequate and defective to the extent that they
can hardly serve to measure demographic levels and trends. In Pakistan, the vital registration is
one of the major responsibilities of the National Population Commission of Pakistan.
DEMOGRAPHIC SURVEY
A demographic survey was used to estimate the level and determinants of perinatal
mortality in eight lower socio-economic squatter settlements of Karachi, Pakistan. The perinatal
mortality rate was 54.1 per 1000 births, with a stillbirth to early neonatal mortality ratio of 1:1.
About 65% of neonatal deaths occurred in the early neonatal period, and early neonatal mortality
contributed 32% of all infant deaths. Risk factor assessment was conducted on 375 perinatal deaths
and 6070 current survivors. Poorer socio-economic status variables such as maternal and paternal
illiteracy, maternal work outside the home and fewer household assets were significantly
associated with perinatal mortality as were biological factors of higher parental age, short birth
intervals and poor obstetric history. Multivariable logistic analysis indicated that some
socioeconomic factors retained their significance after adjusting for the more proximate biological
factors. Population attributable risk estimates suggest that public health measures for screening of
high-risk women and use of family planning to space births will not improve perinatal mortality
substantially without improvement of socio-economic conditions, particularly maternal education.
The results of this study indicate that an evaluation of perinatal mortality can be conducted using
pregnancy histories derived from demographic surveys.
AGE (OR BIRTH DATE)
Age is one of the most common demographic questions asked in surveys. How old a person
is will often determine his/her knowledge and experience with the focus of the survey. When
administering a survey about consumer electronics, a respondent in his 20s will most likely answer
the question differently than a respondent his 70s. Asking a respondent about Age is often one of
the first demographic questions asked in a survey.
Q. Age: What is your age?
• 0-14 years:
• 15-64 years:
• 65 years and over:
ETHNICITY
Capturing a respondent’s ethnicity or race is another common demographic question. A
person’s ethnicity or culture may influence his/her responses to survey questions. Answers may
be influenced by the respondents’ experiences with the survey topic. For example, someone raised
in a rural Native American culture may respond to questions about topics such as the environment
differently from someone raised in an urban culture.
Q. Ethnicity origin (or Race): Please specify your ethnicity.
• Punjabi
• Pushto
• Sindhi
• Siraiki
• Muhajirs
• Balochi
• Other
EDUCATION
Asking a respondent what their highest level of education completed is often found on
surveys. Respondents who completed a four-year degree at a college or university may answer
questions differently than those whose education ended in high school.
Q. Education: What is the highest degree or level of school you have completed? If currently
enrolled, highest degree received.
• No schooling completed
• Nursery school to 8th
grade
• Some high school, no diploma
• High school graduate, diploma or the equivalent (for example: GED)
• Some college credit, no degree
• Trade/technical/vocational training
• Associate degree
• Bachelor’s degree
• Master’s degree
• Professional degree
• Doctorate degree
PROFESSIONAL OR EMPLOYMENT STATUS
Profession or career questions are often asked in demographic surveys. A financial advisor
will likely answer questions about money and financial management differently than someone
from another profession. Profession questions allow survey researchers to factor in respondents’
experiences or biases when analyzing survey results.
Q. Employment Status: Are you currently…?
• Employed for wages
• Self-employed
• Out of work and looking for work
• Out of work but not currently looking for work
• A homemaker
• A student
• Military
• Retired
• Unable to
HOUSEHOLD SURVEY
Questions about the household composition, including marital status, are often important to
survey researchers. Respondents who are married may respond to questions differently than those
who are separated or divorced. The number of children in the household and their age ranges may
influence the type of television programming watched or the type of snack foods purchased
weekly.
Q. Marital Status: What is your marital status?
• Single, never married
• Married or domestic partnership
• Widowed
• Divorced
• Separated
COMPONENTS OF POPULATION GROWTH
Basic components of population growth are fertility, natality, immigration migration. These
components are causes of growth
Components of Population Growth
1. Fertility
Fertility is main component of population growth, it increases population.
2. Natality
Increases population size, each species will have its own maximum birth rate. Maximum birth
rates are seen when conditions are ideal. This can lead to exponential growth.
3. immigration
It increases population growth, it operates when populations are not completely isolated.
4. Migration
Migration is also component of population growth, it also increases population, because in rural
areas civic facilities and employment are not available, that’s why villagers go to the urban areas.
POPULATION COMPOSITION
Important characteristics of a population, besides its size and growth rate, are the way in
which its members are distributed according to age, sex, and urban/rural status.
1. Age Structure:
The age structure of a population refers to the number of people in different age groups.
A larger size of population in the age group of 15-59 years indicates the chances of having a larger
working population. On the other hand, if the number of children in the population is high, the
dependency ratio will be high. Similarly, a growing population in the age group of 60 plus
indicates greater expenditure on the care of the aged.
2. Sex Composition:
Another structural feature of populations is the relative numbers of males and females.
Defined as the number of females per 1000 males in the population, sex ratio is an important social
indicator of the equity prevailing between males and females at a given point of time. Factors
influencing the sex ratio are, mainly, the differentials in mortality, sex selective migration, and
sex ratio at birth and, at times, the sex differential in population enumeration.
3. Rural-Urban Composition:
The division between rural and urban areas is significant in terms of geographical
distribution of population. The percentage of rural population is higher in farm-based agricultural
countries, while industrially, developed regions have higher share of urban population.
ERRORS IN DEMOGRAPHIC DATA
What is error?
Error (statistical error) describes the difference between a value obtained from a data
collection process and the 'true' value for the population. The greater the error, the less
representative the data are of the population
The accuracy of demographic statistics varies from one country to another. The deficiencies
are most in the developing countries because among other problems of lack of administrative
machinery, individual ignorance about certain personal details and sometimes open hostility to
some types of inquiry, due to ignorance. Errors in the demographic data are mainly of two types,
namely, coverage and content errors.
Coverage Errors – are due to persons being missed or counted more than once. They are of two
types. Individual of a given age may have been missed by the census officials or erroneously
included in it (i.e. counted twice). The first type is called under enumeration at this age, while the
second type represents over enumeration, the balance of the two types of errors represents net
under enumeration at this age.
Content Errors - refers to instances where the characteristics of a person counted in a census
enumeration or in the registration of a vital event are incorrectly reported or tabulated. The five
principal sources of errors of content are:
The respondent - when he/she intentionally or unintentionally fail to give the appropriate
information required. A classic example is misstatement of age or the case where widows or
divorces report themselves as single.
The enumerator - where he/she classifies a person incorrectly even though give the correct
information.
The coding process - errors caused from the failure to allocate information on the census or survey
schedule to the proper code.
The editing process - Errors may arise at all stage of the compiling process or during tabulations.
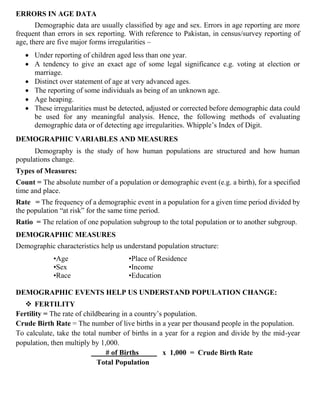
ERRORS IN AGE DATA
Demographic data are usually classified by age and sex. Errors in age reporting are more
frequent than errors in sex reporting. With reference to Pakistan, in census/survey reporting of
age, there are five major forms irregularities –
• Under reporting of children aged less than one year.
• A tendency to give an exact age of some legal significance e.g. voting at election or
marriage.
• Distinct over statement of age at very advanced ages.
• The reporting of some individuals as being of an unknown age.
• Age heaping.
• These irregularities must be detected, adjusted or corrected before demographic data could
be used for any meaningful analysis. Hence, the following methods of evaluating
demographic data or of detecting age irregularities. Whipple’s Index of Digit.
DEMOGRAPHIC VARIABLES AND MEASURES
Demography is the study of how human populations are structured and how human
populations change.
Types of Measures:
Count = The absolute number of a population or demographic event (e.g. a birth), for a specified
time and place.
Rate = The frequency of a demographic event in a population for a given time period divided by
the population “at risk” for the same time period.
Ratio = The relation of one population subgroup to the total population or to another subgroup.
DEMOGRAPHIC MEASURES
Demographic characteristics help us understand population structure:
•Age •Place of Residence
•Sex •Income
•Race •Education
DEMOGRAPHIC EVENTS HELP US UNDERSTAND POPULATION CHANGE:
❖ FERTILITY
Fertility = The rate of childbearing in a country’s population.
Crude Birth Rate = The number of live births in a year per thousand people in the population.
To calculate, take the total number of births in a year for a region and divide by the mid-year
population, then multiply by 1,000.
# of Births x 1,000 = Crude Birth Rate
Total Population
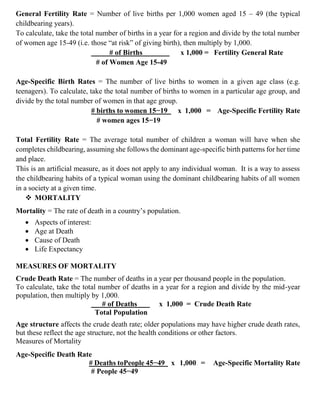
General Fertility Rate = Number of live births per 1,000 women aged 15 – 49 (the typical
childbearing years).
To calculate, take the total number of births in a year for a region and divide by the total number
of women age 15-49 (i.e. those “at risk” of giving birth), then multiply by 1,000.
# of Births x 1,000 = Fertility General Rate
# of Women Age 15-49
Age-Specific Birth Rates = The number of live births to women in a given age class (e.g.
teenagers). To calculate, take the total number of births to women in a particular age group, and
divide by the total number of women in that age group.
# births to women 15−19 x 1,000 = Age-Specific Fertility Rate
# women ages 15−19
Total Fertility Rate = The average total number of children a woman will have when she
completes childbearing, assuming she follows the dominant age-specific birth patterns for her time
and place.
This is an artificial measure, as it does not apply to any individual woman. It is a way to assess
the childbearing habits of a typical woman using the dominant childbearing habits of all women
in a society at a given time.
❖ MORTALITY
Mortality = The rate of death in a country’s population.
• Aspects of interest:
• Age at Death
• Cause of Death
• Life Expectancy
MEASURES OF MORTALITY
Crude Death Rate = The number of deaths in a year per thousand people in the population.
To calculate, take the total number of deaths in a year for a region and divide by the mid-year
population, then multiply by 1,000.
# of Deaths x 1,000 = Crude Death Rate
Total Population
Age structure affects the crude death rate; older populations may have higher crude death rates,
but these reflect the age structure, not the health conditions or other factors.
Measures of Mortality
Age-Specific Death Rate
# Deaths toPeople 45−49 x 1,000 = Age-Specific Mortality Rate
# People 45−49
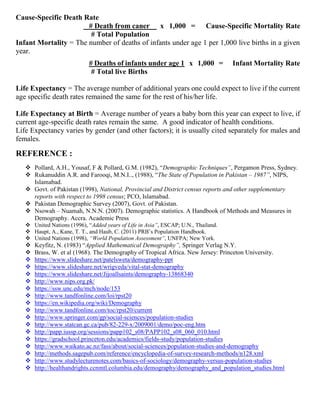
Cause-Specific Death Rate
# Death from caner x 1,000 = Cause-Specific Mortality Rate
# Total Population
Infant Mortality = The number of deaths of infants under age 1 per 1,000 live births in a given
year.
# Deaths of infants under age 1 x 1,000 = Infant Mortality Rate
# Total live Births
Life Expectancy = The average number of additional years one could expect to live if the current
age specific death rates remained the same for the rest of his/her life.
Life Expectancy at Birth = Average number of years a baby born this year can expect to live, if
current age-specific death rates remain the same. A good indicator of health conditions.
Life Expectancy varies by gender (and other factors); it is usually cited separately for males and
females.
REFERENCE :
❖ Pollard, A.H., Yousaf, F & Pollard, G.M. (1982), “Demographic Techniques”, Pergamon Press, Sydney.
❖ Rukanuddin A.R. and Farooqi, M.N.I.., (1988), “The State of Population in Pakistan – 1987”, NIPS,
Islamabad.
❖ Govt. of Pakistan (1998), National, Provincial and District census reports and other supplementary
reports with respect to 1998 census; PCO, Islamabad.
❖ Pakistan Demographic Survey (2007), Govt. of Pakistan.
❖ Nsowah – Nuamah, N.N.N. (2007). Demographic statistics. A Handbook of Methods and Measures in
Demography. Accra. Academic Press
❖ United Nations (1996), “Added years of Life in Asia”, ESCAP; U.N., Thailand.
❖ Haupt, A., Kane, T. T., and Haub, C. (2011) PRB’s Population Handbook.
❖ United Nations (1998), “World Population Assessment”, UNFPA; New York.
❖ Keyfitz, N. (1983) “Applied Mathematical Demography”, Springer Verlag N.Y.
❖ Brass, W. et al (1968). The Demography of Tropical Africa. New Jersey: Princeton University.
❖ https://www.slideshare.net/patelsweta/demography-ppt
❖ https://www.slideshare.net/wrigveda/vital-stat-demography
❖ https://www.slideshare.net/Jijoallsaints/demography-13868340
❖ http://www.nips.org.pk/
❖ https://ssw.unc.edu/mch/node/153
❖ http://www.tandfonline.com/loi/rpst20
❖ https://en.wikipedia.org/wiki/Demography
❖ http://www.tandfonline.com/toc/rpst20/current
❖ http://www.springer.com/gp/social-sciences/population-studies
❖ http://www.statcan.gc.ca/pub/82-229-x/2009001/demo/poc-eng.htm
❖ http://papp.iussp.org/sessions/papp102_s08/PAPP102_s08_060_010.html
❖ https://gradschool.princeton.edu/academics/fields-study/population-studies
❖ http://www.waikato.ac.nz/fass/about/social-sciences/population-studies-and-demography
❖ http://methods.sagepub.com/reference/encyclopedia-of-survey-research-methods/n128.xml
❖ http://www.studylecturenotes.com/basics-of-sociology/demography-versus-population-studies
❖ http://healthandrights.ccnmtl.columbia.edu/demography/demography_and_population_studies.html

More Related Content

What's hot

Demography
DemographyDemography
Demography
Marwa Salem
 
Human fertility and it's determinant
Human fertility and it's determinantHuman fertility and it's determinant
Human fertility and it's determinantsopyanbkkbn
 
Sources of population data
Sources of  population dataSources of  population data
Sources of population data
Manish Kothe
 
Sources of population data
Sources of population dataSources of population data
Sources of population data
MdLikeGES
 
Demographic transition theory and Optimum Population
Demographic transition theory and Optimum PopulationDemographic transition theory and Optimum Population
Demographic transition theory and Optimum Population
Pranjal Prateek
 
Lecture demography 2011 12
Lecture demography 2011 12Lecture demography 2011 12
Lecture demography 2011 12Rizwan Saeed
 
Sources of demographic data
Sources of demographic dataSources of demographic data
Sources of demographic dataTarique Azmi
 
Population Composition & Structure
Population Composition & StructurePopulation Composition & Structure
Population Composition & Structurekdjw
 
DEFINITIONS
DEFINITIONSDEFINITIONS
DEFINITIONS
Shahzaib Khan
 
Basic outline of Theoretical perspectives: Fertility, Mortality, Migration
Basic outline of Theoretical perspectives: Fertility, Mortality, MigrationBasic outline of Theoretical perspectives: Fertility, Mortality, Migration
Basic outline of Theoretical perspectives: Fertility, Mortality, Migration
Ramakrishna Mission Vivekananda Educational and Research Institute
 
Demographic transition-theory-optimum-population-1
Demographic transition-theory-optimum-population-1Demographic transition-theory-optimum-population-1
Demographic transition-theory-optimum-population-1Vishnu Sasikumar
 
Presentation about population studies
Presentation about population studiesPresentation about population studies
Presentation about population studies
S.m. Atik
 
Malthus' theory of population growth
Malthus' theory of population growthMalthus' theory of population growth
Malthus' theory of population growth
yahui_tan
 
Population projection (30 1-2017) by dr min ko ko
Population projection (30 1-2017)  by dr min ko koPopulation projection (30 1-2017)  by dr min ko ko
Population projection (30 1-2017) by dr min ko ko
Mmedsc Hahm
 
A Brief Discussion on demographic transition theory.
A Brief Discussion on demographic transition theory.A Brief Discussion on demographic transition theory.
A Brief Discussion on demographic transition theory.
Rizwan Khan
 
Age sex composition
Age sex compositionAge sex composition
Age sex composition
Bhupen Barman
 
Optimum
OptimumOptimum
Optimum
RADHUMS
 
Population and demography
Population and demographyPopulation and demography
Population and demographyKathy Clavano
 
Theories on population
Theories on populationTheories on population
Theories on populationKayon Ellis
 

What's hot (20)

Demography
DemographyDemography
Demography
 
Human fertility and it's determinant
Human fertility and it's determinantHuman fertility and it's determinant
Human fertility and it's determinant
 
Sources of population data
Sources of  population dataSources of  population data
Sources of population data
 
Sources of population data
Sources of population dataSources of population data
Sources of population data
 
Measures of fertility
Measures of fertilityMeasures of fertility
Measures of fertility
 
Demographic transition theory and Optimum Population
Demographic transition theory and Optimum PopulationDemographic transition theory and Optimum Population
Demographic transition theory and Optimum Population
 
Lecture demography 2011 12
Lecture demography 2011 12Lecture demography 2011 12
Lecture demography 2011 12
 
Sources of demographic data
Sources of demographic dataSources of demographic data
Sources of demographic data
 
Population Composition & Structure
Population Composition & StructurePopulation Composition & Structure
Population Composition & Structure
 
DEFINITIONS
DEFINITIONSDEFINITIONS
DEFINITIONS
 
Basic outline of Theoretical perspectives: Fertility, Mortality, Migration
Basic outline of Theoretical perspectives: Fertility, Mortality, MigrationBasic outline of Theoretical perspectives: Fertility, Mortality, Migration
Basic outline of Theoretical perspectives: Fertility, Mortality, Migration
 
Demographic transition-theory-optimum-population-1
Demographic transition-theory-optimum-population-1Demographic transition-theory-optimum-population-1
Demographic transition-theory-optimum-population-1
 
Presentation about population studies
Presentation about population studiesPresentation about population studies
Presentation about population studies
 
Malthus' theory of population growth
Malthus' theory of population growthMalthus' theory of population growth
Malthus' theory of population growth
 
Population projection (30 1-2017) by dr min ko ko
Population projection (30 1-2017)  by dr min ko koPopulation projection (30 1-2017)  by dr min ko ko
Population projection (30 1-2017) by dr min ko ko
 
A Brief Discussion on demographic transition theory.
A Brief Discussion on demographic transition theory.A Brief Discussion on demographic transition theory.
A Brief Discussion on demographic transition theory.
 
Age sex composition
Age sex compositionAge sex composition
Age sex composition
 
Optimum
OptimumOptimum
Optimum
 
Population and demography
Population and demographyPopulation and demography
Population and demography
 
Theories on population
Theories on populationTheories on population
Theories on population
 

Similar to Population Studies / Demography Introduction

Ori demography1 1
Ori demography1 1Ori demography1 1
Ori demography1 1
Mamatha Venkatesh
 
Demography - Methods of collection of demographic data
Demography - Methods of collection of demographic dataDemography - Methods of collection of demographic data
Demography - Methods of collection of demographic data
Nagamani Manjunath
 
Final Presentation- Tahsina Mame
Final Presentation- Tahsina MameFinal Presentation- Tahsina Mame
Final Presentation- Tahsina MameNadia Ayman
 
Seminar ppt vital statistics prince maurya 21 smas1050004
Seminar ppt vital statistics   prince maurya 21 smas1050004Seminar ppt vital statistics   prince maurya 21 smas1050004
Seminar ppt vital statistics prince maurya 21 smas1050004
Vamsi kumar
 
VITAL STATASTICS project.pptx
VITAL STATASTICS project.pptxVITAL STATASTICS project.pptx
VITAL STATASTICS project.pptx
Ruchika Kamble
 
VITAL STATISTICS
VITAL STATISTICSVITAL STATISTICS
VITAL STATISTICS
mkniranda
 
Health Statistics .pptx
Health Statistics .pptxHealth Statistics .pptx
Health Statistics .pptx
SulaimanShah13
 
Vital statistics
Vital statisticsVital statistics
Vital statistics
Soumya Ranjan Parida
 
Vital Statistics - Uses and Importance's
Vital Statistics - Uses and Importance'sVital Statistics - Uses and Importance's
SOURCES OF POPULATION DATA.pptx
SOURCES OF POPULATION DATA.pptxSOURCES OF POPULATION DATA.pptx
SOURCES OF POPULATION DATA.pptx
KRIPABHARDWAJ1
 
Population and development
Population and developmentPopulation and development
Population and development
Khushumanghnani
 
Vital statistics
Vital statistics Vital statistics
Vital statistics
NEHA MALIK
 
Census and national health survey
Census and national health surveyCensus and national health survey
Census and national health survey
PujaKushwaha3
 
Sources of Demo Data slides.pptx
Sources of Demo Data slides.pptxSources of Demo Data slides.pptx
Sources of Demo Data slides.pptx
OttoJunior3
 
National level survey relevant to health seminar (2)
National level survey relevant to health seminar (2)National level survey relevant to health seminar (2)
National level survey relevant to health seminar (2)vishal soyam
 
Vital statistics.pptx
Vital statistics.pptxVital statistics.pptx
Vital statistics.pptx
MsRadhaNursingIACN
 
Business Demography is a very important subject for business.
Business Demography is a very important subject for business.Business Demography is a very important subject for business.
Business Demography is a very important subject for business.
pakap3769
 
Demography
DemographyDemography
Demography
Harsh Rastogi
 
demography by sumit Pandey
demography  by sumit Pandey demography  by sumit Pandey
demography by sumit Pandey
SUMIT kr PANDEY
 
demography-210510094527.pdf
demography-210510094527.pdfdemography-210510094527.pdf
demography-210510094527.pdf
ShennieStephanie
 

Similar to Population Studies / Demography Introduction (20)

Ori demography1 1
Ori demography1 1Ori demography1 1
Ori demography1 1
 
Demography - Methods of collection of demographic data
Demography - Methods of collection of demographic dataDemography - Methods of collection of demographic data
Demography - Methods of collection of demographic data
 
Final Presentation- Tahsina Mame
Final Presentation- Tahsina MameFinal Presentation- Tahsina Mame
Final Presentation- Tahsina Mame
 
Seminar ppt vital statistics prince maurya 21 smas1050004
Seminar ppt vital statistics   prince maurya 21 smas1050004Seminar ppt vital statistics   prince maurya 21 smas1050004
Seminar ppt vital statistics prince maurya 21 smas1050004
 
VITAL STATASTICS project.pptx
VITAL STATASTICS project.pptxVITAL STATASTICS project.pptx
VITAL STATASTICS project.pptx
 
VITAL STATISTICS
VITAL STATISTICSVITAL STATISTICS
VITAL STATISTICS
 
Health Statistics .pptx
Health Statistics .pptxHealth Statistics .pptx
Health Statistics .pptx
 
Vital statistics
Vital statisticsVital statistics
Vital statistics
 
Vital Statistics - Uses and Importance's
Vital Statistics - Uses and Importance'sVital Statistics - Uses and Importance's
Vital Statistics - Uses and Importance's
 
SOURCES OF POPULATION DATA.pptx
SOURCES OF POPULATION DATA.pptxSOURCES OF POPULATION DATA.pptx
SOURCES OF POPULATION DATA.pptx
 
Population and development
Population and developmentPopulation and development
Population and development
 
Vital statistics
Vital statistics Vital statistics
Vital statistics
 
Census and national health survey
Census and national health surveyCensus and national health survey
Census and national health survey
 
Sources of Demo Data slides.pptx
Sources of Demo Data slides.pptxSources of Demo Data slides.pptx
Sources of Demo Data slides.pptx
 
National level survey relevant to health seminar (2)
National level survey relevant to health seminar (2)National level survey relevant to health seminar (2)
National level survey relevant to health seminar (2)
 
Vital statistics.pptx
Vital statistics.pptxVital statistics.pptx
Vital statistics.pptx
 
Business Demography is a very important subject for business.
Business Demography is a very important subject for business.Business Demography is a very important subject for business.
Business Demography is a very important subject for business.
 
Demography
DemographyDemography
Demography
 
demography by sumit Pandey
demography  by sumit Pandey demography  by sumit Pandey
demography by sumit Pandey
 
demography-210510094527.pdf
demography-210510094527.pdfdemography-210510094527.pdf
demography-210510094527.pdf
 

Recently uploaded

Lateral Ventricles.pdf very easy good diagrams comprehensive
Lateral Ventricles.pdf very easy good diagrams comprehensiveLateral Ventricles.pdf very easy good diagrams comprehensive
Lateral Ventricles.pdf very easy good diagrams comprehensive
silvermistyshot
 
Nutraceutical market, scope and growth: Herbal drug technology
Nutraceutical market, scope and growth: Herbal drug technologyNutraceutical market, scope and growth: Herbal drug technology
Nutraceutical market, scope and growth: Herbal drug technology
Lokesh Patil
 
Structural Classification Of Protein (SCOP)
Structural Classification Of Protein  (SCOP)Structural Classification Of Protein  (SCOP)
Structural Classification Of Protein (SCOP)
aishnasrivastava
 
GBSN - Biochemistry (Unit 5) Chemistry of Lipids
GBSN - Biochemistry (Unit 5) Chemistry of LipidsGBSN - Biochemistry (Unit 5) Chemistry of Lipids
GBSN - Biochemistry (Unit 5) Chemistry of Lipids
Areesha Ahmad
 
extra-chromosomal-inheritance[1].pptx.pdfpdf
extra-chromosomal-inheritance[1].pptx.pdfpdfextra-chromosomal-inheritance[1].pptx.pdfpdf
extra-chromosomal-inheritance[1].pptx.pdfpdf
DiyaBiswas10
 
justice-and-fairness-ethics with example
justice-and-fairness-ethics with examplejustice-and-fairness-ethics with example
justice-and-fairness-ethics with example
azzyixes
 
(May 29th, 2024) Advancements in Intravital Microscopy- Insights for Preclini...
(May 29th, 2024) Advancements in Intravital Microscopy- Insights for Preclini...(May 29th, 2024) Advancements in Intravital Microscopy- Insights for Preclini...
(May 29th, 2024) Advancements in Intravital Microscopy- Insights for Preclini...
Scintica Instrumentation
 
general properties of oerganologametal.ppt
general properties of oerganologametal.pptgeneral properties of oerganologametal.ppt
general properties of oerganologametal.ppt
IqrimaNabilatulhusni
 
Observation of Io’s Resurfacing via Plume Deposition Using Ground-based Adapt...
Observation of Io’s Resurfacing via Plume Deposition Using Ground-based Adapt...Observation of Io’s Resurfacing via Plume Deposition Using Ground-based Adapt...
Observation of Io’s Resurfacing via Plume Deposition Using Ground-based Adapt...
Sérgio Sacani
 
platelets_clotting_biogenesis.clot retractionpptx
platelets_clotting_biogenesis.clot retractionpptxplatelets_clotting_biogenesis.clot retractionpptx
platelets_clotting_biogenesis.clot retractionpptx
muralinath2
 
EY - Supply Chain Services 2018_template.pptx
EY - Supply Chain Services 2018_template.pptxEY - Supply Chain Services 2018_template.pptx
EY - Supply Chain Services 2018_template.pptx
AlguinaldoKong
 
Earliest Galaxies in the JADES Origins Field: Luminosity Function and Cosmic ...
Earliest Galaxies in the JADES Origins Field: Luminosity Function and Cosmic ...Earliest Galaxies in the JADES Origins Field: Luminosity Function and Cosmic ...
Earliest Galaxies in the JADES Origins Field: Luminosity Function and Cosmic ...
Sérgio Sacani
 
PRESENTATION ABOUT PRINCIPLE OF COSMATIC EVALUATION
PRESENTATION ABOUT PRINCIPLE OF COSMATIC EVALUATIONPRESENTATION ABOUT PRINCIPLE OF COSMATIC EVALUATION
PRESENTATION ABOUT PRINCIPLE OF COSMATIC EVALUATION
ChetanK57
 
SCHIZOPHRENIA Disorder/ Brain Disorder.pdf
SCHIZOPHRENIA Disorder/ Brain Disorder.pdfSCHIZOPHRENIA Disorder/ Brain Disorder.pdf
SCHIZOPHRENIA Disorder/ Brain Disorder.pdf
SELF-EXPLANATORY
 
Richard's aventures in two entangled wonderlands
Richard's aventures in two entangled wonderlandsRichard's aventures in two entangled wonderlands
Richard's aventures in two entangled wonderlands
Richard Gill
 
Lab report on liquid viscosity of glycerin
Lab report on liquid viscosity of glycerinLab report on liquid viscosity of glycerin
Lab report on liquid viscosity of glycerin
ossaicprecious19
 
Anemia_ different types_causes_ conditions
Anemia_ different types_causes_ conditionsAnemia_ different types_causes_ conditions
Anemia_ different types_causes_ conditions
muralinath2
 
plant biotechnology Lecture note ppt.pptx
plant biotechnology Lecture note ppt.pptxplant biotechnology Lecture note ppt.pptx
plant biotechnology Lecture note ppt.pptx
yusufzako14
 
Seminar of U.V. Spectroscopy by SAMIR PANDA
 Seminar of U.V. Spectroscopy by SAMIR PANDA Seminar of U.V. Spectroscopy by SAMIR PANDA
Seminar of U.V. Spectroscopy by SAMIR PANDA
SAMIR PANDA
 
Viksit bharat till 2047 India@2047.pptx
Viksit bharat till 2047  India@2047.pptxViksit bharat till 2047  India@2047.pptx
Viksit bharat till 2047 India@2047.pptx
rakeshsharma20142015
 

Recently uploaded (20)

Lateral Ventricles.pdf very easy good diagrams comprehensive
Lateral Ventricles.pdf very easy good diagrams comprehensiveLateral Ventricles.pdf very easy good diagrams comprehensive
Lateral Ventricles.pdf very easy good diagrams comprehensive
 
Nutraceutical market, scope and growth: Herbal drug technology
Nutraceutical market, scope and growth: Herbal drug technologyNutraceutical market, scope and growth: Herbal drug technology
Nutraceutical market, scope and growth: Herbal drug technology
 
Structural Classification Of Protein (SCOP)
Structural Classification Of Protein  (SCOP)Structural Classification Of Protein  (SCOP)
Structural Classification Of Protein (SCOP)
 
GBSN - Biochemistry (Unit 5) Chemistry of Lipids
GBSN - Biochemistry (Unit 5) Chemistry of LipidsGBSN - Biochemistry (Unit 5) Chemistry of Lipids
GBSN - Biochemistry (Unit 5) Chemistry of Lipids
 
extra-chromosomal-inheritance[1].pptx.pdfpdf
extra-chromosomal-inheritance[1].pptx.pdfpdfextra-chromosomal-inheritance[1].pptx.pdfpdf
extra-chromosomal-inheritance[1].pptx.pdfpdf
 
justice-and-fairness-ethics with example
justice-and-fairness-ethics with examplejustice-and-fairness-ethics with example
justice-and-fairness-ethics with example
 
(May 29th, 2024) Advancements in Intravital Microscopy- Insights for Preclini...
(May 29th, 2024) Advancements in Intravital Microscopy- Insights for Preclini...(May 29th, 2024) Advancements in Intravital Microscopy- Insights for Preclini...
(May 29th, 2024) Advancements in Intravital Microscopy- Insights for Preclini...
 
general properties of oerganologametal.ppt
general properties of oerganologametal.pptgeneral properties of oerganologametal.ppt
general properties of oerganologametal.ppt
 
Observation of Io’s Resurfacing via Plume Deposition Using Ground-based Adapt...
Observation of Io’s Resurfacing via Plume Deposition Using Ground-based Adapt...Observation of Io’s Resurfacing via Plume Deposition Using Ground-based Adapt...
Observation of Io’s Resurfacing via Plume Deposition Using Ground-based Adapt...
 
platelets_clotting_biogenesis.clot retractionpptx
platelets_clotting_biogenesis.clot retractionpptxplatelets_clotting_biogenesis.clot retractionpptx
platelets_clotting_biogenesis.clot retractionpptx
 
EY - Supply Chain Services 2018_template.pptx
EY - Supply Chain Services 2018_template.pptxEY - Supply Chain Services 2018_template.pptx
EY - Supply Chain Services 2018_template.pptx
 
Earliest Galaxies in the JADES Origins Field: Luminosity Function and Cosmic ...
Earliest Galaxies in the JADES Origins Field: Luminosity Function and Cosmic ...Earliest Galaxies in the JADES Origins Field: Luminosity Function and Cosmic ...
Earliest Galaxies in the JADES Origins Field: Luminosity Function and Cosmic ...
 
PRESENTATION ABOUT PRINCIPLE OF COSMATIC EVALUATION
PRESENTATION ABOUT PRINCIPLE OF COSMATIC EVALUATIONPRESENTATION ABOUT PRINCIPLE OF COSMATIC EVALUATION
PRESENTATION ABOUT PRINCIPLE OF COSMATIC EVALUATION
 
SCHIZOPHRENIA Disorder/ Brain Disorder.pdf
SCHIZOPHRENIA Disorder/ Brain Disorder.pdfSCHIZOPHRENIA Disorder/ Brain Disorder.pdf
SCHIZOPHRENIA Disorder/ Brain Disorder.pdf
 
Richard's aventures in two entangled wonderlands
Richard's aventures in two entangled wonderlandsRichard's aventures in two entangled wonderlands
Richard's aventures in two entangled wonderlands
 
Lab report on liquid viscosity of glycerin
Lab report on liquid viscosity of glycerinLab report on liquid viscosity of glycerin
Lab report on liquid viscosity of glycerin
 
Anemia_ different types_causes_ conditions
Anemia_ different types_causes_ conditionsAnemia_ different types_causes_ conditions
Anemia_ different types_causes_ conditions
 
plant biotechnology Lecture note ppt.pptx
plant biotechnology Lecture note ppt.pptxplant biotechnology Lecture note ppt.pptx
plant biotechnology Lecture note ppt.pptx
 
Seminar of U.V. Spectroscopy by SAMIR PANDA
 Seminar of U.V. Spectroscopy by SAMIR PANDA Seminar of U.V. Spectroscopy by SAMIR PANDA
Seminar of U.V. Spectroscopy by SAMIR PANDA
 
Viksit bharat till 2047 India@2047.pptx
Viksit bharat till 2047  India@2047.pptxViksit bharat till 2047  India@2047.pptx
Viksit bharat till 2047 India@2047.pptx
 

Population Studies / Demography Introduction

  • 1.
  • 2.
  • 3. Table of Contents Introduction……………..…………………………………………….1 Demography, Demographic Analysis, Population Studies Sources of Demographic Data.……………………………………….2 Census, Civil Registration System, Uses of Civil Registration, Sample Surveys Population Census………………………………………...…………..3 Features of population census, sponsorship, defined territory, university, simultaneity, individual unity, compilation and publication Vital Registration……………………………………………….…….4 Demographic Survey……………………………………………….....4 Age, Ethnicity, Education, Employment Household Survey……………………………………………………..7 Components of Population Growth………………………………….7 Fertility, Mortality, Immigration, Natality Population Composition………………………………………….…...7 Age structure, Sex composition, Rural-Urban Composition Errors in Demographic Data…………………………………….……8 What is error, Coverage errors, Content errors, Errors in age data Demographic Measures……………………………………….…….....9 Count, Rate, Ratio, Fertility, Fertility Rate, Mortality, Mortality Rate Reference………..………..……………………………………………11
  • 4. INTRODUCTION Demography is the statistical analysis of population data. The term Demography, was coined from two Greek words (demos meaning people, and graphein meaning to write or describe). The term “Demography” is the statistical and mathematical study of the size, composition, and spatial distribution of human population, and of changes over time in these aspects through the operation of five processes of fertility, mortality, marriage, migration and social mobility. Usually the demographic data are drawn from various sources such as national censuses, civil registration system as well as the sample surveys. Modern demography is divided into two parts, namely Demographic Analysis – this deals with the study of the components of change in the population. These components are also called population dynamics, i.e. fertility, mortality, and migration. Population Studies – this deals with addressing demographic events and phenomenon in the socio – economic context. It relates population dynamics to socio – economic, biological, and political or other environmental factors. Ideally, the study of demography requires extensive and accurate population statistics. The demographer subsists by calculating rates, assuming implicitly a decision – making process regarding when, how many and how far in – between to have babies; by explaining birth intervals by postpartum amenorrhea, voluntary abstinence, contraceptive use – effectiveness, period of Infecundability and related fertility – inhibiting indicators; by constructing elegant life tables; by measuring activity rates and migration rates and by periodically projecting the size of the total population by its components; by validating and updating the results usually presented in three variants – high, medium and low, using census figures where available and vital registration where these exist.
  • 5. SOURCES OF DEMOGRAPHIC DATA (A) CENSUS It is compiling, evaluating, analysing and publishing demographic, economic and social data pertaining, at a specific time, to all persons in a country or in a well-delimited part of a country.” In other words, the enumeration of the entire population of a country or a region at a particular time is known as census. How a National Census is taken: Census taking is a very complex and extensive task and is, therefore, usually conducted by governments. In many countries, provision for census taking is made by law. While such a law makes the co-operation of each citizen mandatory, it also ensures that confidential nature of census information provided by individuals shall be preserved. (B) CIVIL REGISTRATION SYSTEM According to the United Nations, civil registration is defined as the continuous permanent and compulsory recording of the occurrence of vital events, like, live births, deaths, foetal deaths, marriages, divorces as well as annulments, judicial separation, adoptions, legitimations and recognitions. Civil registration is performed under a law, decree or regulation so as to provide a legal basis to the records and certificates made from the system, which has got several civil uses in the personal life of individual citizens. USES OF CIVIL REGISTRATION Civil registration has a dual purpose − legal on the one hand, and statistical, demographic and epidemiological on the other. In the first purpose, the records generated have importance as legal records documenting the facts surrounding each registered vital event. In that sense, each vital record has an intrinsic importance of its own. Uses of civil registration records for administrative purposes
  • 6. Live birth records are the basis for many public health programmes for post‐natal care of mother and child, and may be used, when needed, for programmes of vaccination and immunization, premature‐baby care, assistance to disabled persons. Death records are used to provide legal permission for burial or other disposal of deceased individuals. They can also provide information of epidemiological importance, and indicate the need for preventive control measures. Death records are also necessary to clear a number of administrative files, such as disease‐case registers, population registers, social security files, military service files, electoral rolls, identity files and tax registers (C) SAMPLE SURVEYS There are three systems which provide data on vital rates at the national level. These are National Sample Survey, Sample Registration System and in recent years, National Family Health Surveys. These surveys provide different kinds of data, but all of them provide certain fertility and mortality indicators. In other words Sample survey seeks to collect information only from a fraction of the population. It is employed to arrive at estimates of demographic characteristics, size, distribution, mortality, fertility and migration. In Pakistan, the efforts to generate reliable demographic data has included the conduct of numerous national sample surveys. POPULATION CENSUS A census of population may be defined as the total process of collecting, compiling and publishing demographic, economic and social data pertaining, at a specified time or times, to all persons in a country or delimited territory. Essential Features of the Census Some of the essential features of an official national census are; Sponsorship - an official national census is sponsored and carried out by the national government. Defined Territory - the coverage of a census operation should relate to a precisely defined territory. Universality – the enumeration should include every member of the community within the scope of the census without omission or duplication. Simultaneity - the total population enumerated should refer to one well defined point of time. Individual unity – a census implies that separate data are recorded for each individual by direct enumeration and not by registration. Compilation and publication – the compilation and publication of data by geographic areas and by basic demographic variables is an integral part of a census.
  • 7. VITAL REGISTRATION The vital registration is the continuous, permanent and compulsory registration of the occurrence and characteristics of vital events – births, deaths, marriages, change of name, nationalisation e.t.c The statistics generated from the exercise is referred to as vital statistics because they have to do with the individuals entry into, and departure out of life, with the changes in the civil status of the individual in his/her life time. In many developing countries, vital statistics are inadequate and defective to the extent that they can hardly serve to measure demographic levels and trends. In Pakistan, the vital registration is one of the major responsibilities of the National Population Commission of Pakistan. DEMOGRAPHIC SURVEY A demographic survey was used to estimate the level and determinants of perinatal mortality in eight lower socio-economic squatter settlements of Karachi, Pakistan. The perinatal mortality rate was 54.1 per 1000 births, with a stillbirth to early neonatal mortality ratio of 1:1. About 65% of neonatal deaths occurred in the early neonatal period, and early neonatal mortality contributed 32% of all infant deaths. Risk factor assessment was conducted on 375 perinatal deaths and 6070 current survivors. Poorer socio-economic status variables such as maternal and paternal illiteracy, maternal work outside the home and fewer household assets were significantly associated with perinatal mortality as were biological factors of higher parental age, short birth intervals and poor obstetric history. Multivariable logistic analysis indicated that some socioeconomic factors retained their significance after adjusting for the more proximate biological factors. Population attributable risk estimates suggest that public health measures for screening of high-risk women and use of family planning to space births will not improve perinatal mortality substantially without improvement of socio-economic conditions, particularly maternal education. The results of this study indicate that an evaluation of perinatal mortality can be conducted using pregnancy histories derived from demographic surveys. AGE (OR BIRTH DATE) Age is one of the most common demographic questions asked in surveys. How old a person is will often determine his/her knowledge and experience with the focus of the survey. When administering a survey about consumer electronics, a respondent in his 20s will most likely answer the question differently than a respondent his 70s. Asking a respondent about Age is often one of the first demographic questions asked in a survey. Q. Age: What is your age? • 0-14 years: • 15-64 years: • 65 years and over:
  • 8. ETHNICITY Capturing a respondent’s ethnicity or race is another common demographic question. A person’s ethnicity or culture may influence his/her responses to survey questions. Answers may be influenced by the respondents’ experiences with the survey topic. For example, someone raised in a rural Native American culture may respond to questions about topics such as the environment differently from someone raised in an urban culture. Q. Ethnicity origin (or Race): Please specify your ethnicity. • Punjabi • Pushto • Sindhi • Siraiki • Muhajirs • Balochi • Other EDUCATION Asking a respondent what their highest level of education completed is often found on surveys. Respondents who completed a four-year degree at a college or university may answer questions differently than those whose education ended in high school. Q. Education: What is the highest degree or level of school you have completed? If currently enrolled, highest degree received. • No schooling completed • Nursery school to 8th grade • Some high school, no diploma • High school graduate, diploma or the equivalent (for example: GED) • Some college credit, no degree • Trade/technical/vocational training • Associate degree
  • 9. • Bachelor’s degree • Master’s degree • Professional degree • Doctorate degree PROFESSIONAL OR EMPLOYMENT STATUS Profession or career questions are often asked in demographic surveys. A financial advisor will likely answer questions about money and financial management differently than someone from another profession. Profession questions allow survey researchers to factor in respondents’ experiences or biases when analyzing survey results. Q. Employment Status: Are you currently…? • Employed for wages • Self-employed • Out of work and looking for work • Out of work but not currently looking for work • A homemaker • A student • Military • Retired • Unable to
  • 10. HOUSEHOLD SURVEY Questions about the household composition, including marital status, are often important to survey researchers. Respondents who are married may respond to questions differently than those who are separated or divorced. The number of children in the household and their age ranges may influence the type of television programming watched or the type of snack foods purchased weekly. Q. Marital Status: What is your marital status? • Single, never married • Married or domestic partnership • Widowed • Divorced • Separated COMPONENTS OF POPULATION GROWTH Basic components of population growth are fertility, natality, immigration migration. These components are causes of growth Components of Population Growth 1. Fertility Fertility is main component of population growth, it increases population. 2. Natality Increases population size, each species will have its own maximum birth rate. Maximum birth rates are seen when conditions are ideal. This can lead to exponential growth. 3. immigration It increases population growth, it operates when populations are not completely isolated. 4. Migration Migration is also component of population growth, it also increases population, because in rural areas civic facilities and employment are not available, that’s why villagers go to the urban areas. POPULATION COMPOSITION Important characteristics of a population, besides its size and growth rate, are the way in which its members are distributed according to age, sex, and urban/rural status. 1. Age Structure: The age structure of a population refers to the number of people in different age groups. A larger size of population in the age group of 15-59 years indicates the chances of having a larger working population. On the other hand, if the number of children in the population is high, the dependency ratio will be high. Similarly, a growing population in the age group of 60 plus indicates greater expenditure on the care of the aged. 2. Sex Composition: Another structural feature of populations is the relative numbers of males and females. Defined as the number of females per 1000 males in the population, sex ratio is an important social
  • 11. indicator of the equity prevailing between males and females at a given point of time. Factors influencing the sex ratio are, mainly, the differentials in mortality, sex selective migration, and sex ratio at birth and, at times, the sex differential in population enumeration. 3. Rural-Urban Composition: The division between rural and urban areas is significant in terms of geographical distribution of population. The percentage of rural population is higher in farm-based agricultural countries, while industrially, developed regions have higher share of urban population. ERRORS IN DEMOGRAPHIC DATA What is error? Error (statistical error) describes the difference between a value obtained from a data collection process and the 'true' value for the population. The greater the error, the less representative the data are of the population The accuracy of demographic statistics varies from one country to another. The deficiencies are most in the developing countries because among other problems of lack of administrative machinery, individual ignorance about certain personal details and sometimes open hostility to some types of inquiry, due to ignorance. Errors in the demographic data are mainly of two types, namely, coverage and content errors. Coverage Errors – are due to persons being missed or counted more than once. They are of two types. Individual of a given age may have been missed by the census officials or erroneously included in it (i.e. counted twice). The first type is called under enumeration at this age, while the second type represents over enumeration, the balance of the two types of errors represents net under enumeration at this age. Content Errors - refers to instances where the characteristics of a person counted in a census enumeration or in the registration of a vital event are incorrectly reported or tabulated. The five principal sources of errors of content are: The respondent - when he/she intentionally or unintentionally fail to give the appropriate information required. A classic example is misstatement of age or the case where widows or divorces report themselves as single. The enumerator - where he/she classifies a person incorrectly even though give the correct information. The coding process - errors caused from the failure to allocate information on the census or survey schedule to the proper code. The editing process - Errors may arise at all stage of the compiling process or during tabulations.
  • 12. ERRORS IN AGE DATA Demographic data are usually classified by age and sex. Errors in age reporting are more frequent than errors in sex reporting. With reference to Pakistan, in census/survey reporting of age, there are five major forms irregularities – • Under reporting of children aged less than one year. • A tendency to give an exact age of some legal significance e.g. voting at election or marriage. • Distinct over statement of age at very advanced ages. • The reporting of some individuals as being of an unknown age. • Age heaping. • These irregularities must be detected, adjusted or corrected before demographic data could be used for any meaningful analysis. Hence, the following methods of evaluating demographic data or of detecting age irregularities. Whipple’s Index of Digit. DEMOGRAPHIC VARIABLES AND MEASURES Demography is the study of how human populations are structured and how human populations change. Types of Measures: Count = The absolute number of a population or demographic event (e.g. a birth), for a specified time and place. Rate = The frequency of a demographic event in a population for a given time period divided by the population “at risk” for the same time period. Ratio = The relation of one population subgroup to the total population or to another subgroup. DEMOGRAPHIC MEASURES Demographic characteristics help us understand population structure: •Age •Place of Residence •Sex •Income •Race •Education DEMOGRAPHIC EVENTS HELP US UNDERSTAND POPULATION CHANGE: ❖ FERTILITY Fertility = The rate of childbearing in a country’s population. Crude Birth Rate = The number of live births in a year per thousand people in the population. To calculate, take the total number of births in a year for a region and divide by the mid-year population, then multiply by 1,000. # of Births x 1,000 = Crude Birth Rate Total Population
  • 13. General Fertility Rate = Number of live births per 1,000 women aged 15 – 49 (the typical childbearing years). To calculate, take the total number of births in a year for a region and divide by the total number of women age 15-49 (i.e. those “at risk” of giving birth), then multiply by 1,000. # of Births x 1,000 = Fertility General Rate # of Women Age 15-49 Age-Specific Birth Rates = The number of live births to women in a given age class (e.g. teenagers). To calculate, take the total number of births to women in a particular age group, and divide by the total number of women in that age group. # births to women 15−19 x 1,000 = Age-Specific Fertility Rate # women ages 15−19 Total Fertility Rate = The average total number of children a woman will have when she completes childbearing, assuming she follows the dominant age-specific birth patterns for her time and place. This is an artificial measure, as it does not apply to any individual woman. It is a way to assess the childbearing habits of a typical woman using the dominant childbearing habits of all women in a society at a given time. ❖ MORTALITY Mortality = The rate of death in a country’s population. • Aspects of interest: • Age at Death • Cause of Death • Life Expectancy MEASURES OF MORTALITY Crude Death Rate = The number of deaths in a year per thousand people in the population. To calculate, take the total number of deaths in a year for a region and divide by the mid-year population, then multiply by 1,000. # of Deaths x 1,000 = Crude Death Rate Total Population Age structure affects the crude death rate; older populations may have higher crude death rates, but these reflect the age structure, not the health conditions or other factors. Measures of Mortality Age-Specific Death Rate # Deaths toPeople 45−49 x 1,000 = Age-Specific Mortality Rate # People 45−49
  • 14. Cause-Specific Death Rate # Death from caner x 1,000 = Cause-Specific Mortality Rate # Total Population Infant Mortality = The number of deaths of infants under age 1 per 1,000 live births in a given year. # Deaths of infants under age 1 x 1,000 = Infant Mortality Rate # Total live Births Life Expectancy = The average number of additional years one could expect to live if the current age specific death rates remained the same for the rest of his/her life. Life Expectancy at Birth = Average number of years a baby born this year can expect to live, if current age-specific death rates remain the same. A good indicator of health conditions. Life Expectancy varies by gender (and other factors); it is usually cited separately for males and females. REFERENCE : ❖ Pollard, A.H., Yousaf, F & Pollard, G.M. (1982), “Demographic Techniques”, Pergamon Press, Sydney. ❖ Rukanuddin A.R. and Farooqi, M.N.I.., (1988), “The State of Population in Pakistan – 1987”, NIPS, Islamabad. ❖ Govt. of Pakistan (1998), National, Provincial and District census reports and other supplementary reports with respect to 1998 census; PCO, Islamabad. ❖ Pakistan Demographic Survey (2007), Govt. of Pakistan. ❖ Nsowah – Nuamah, N.N.N. (2007). Demographic statistics. A Handbook of Methods and Measures in Demography. Accra. Academic Press ❖ United Nations (1996), “Added years of Life in Asia”, ESCAP; U.N., Thailand. ❖ Haupt, A., Kane, T. T., and Haub, C. (2011) PRB’s Population Handbook. ❖ United Nations (1998), “World Population Assessment”, UNFPA; New York. ❖ Keyfitz, N. (1983) “Applied Mathematical Demography”, Springer Verlag N.Y. ❖ Brass, W. et al (1968). The Demography of Tropical Africa. New Jersey: Princeton University. ❖ https://www.slideshare.net/patelsweta/demography-ppt ❖ https://www.slideshare.net/wrigveda/vital-stat-demography ❖ https://www.slideshare.net/Jijoallsaints/demography-13868340 ❖ http://www.nips.org.pk/ ❖ https://ssw.unc.edu/mch/node/153 ❖ http://www.tandfonline.com/loi/rpst20 ❖ https://en.wikipedia.org/wiki/Demography ❖ http://www.tandfonline.com/toc/rpst20/current ❖ http://www.springer.com/gp/social-sciences/population-studies ❖ http://www.statcan.gc.ca/pub/82-229-x/2009001/demo/poc-eng.htm ❖ http://papp.iussp.org/sessions/papp102_s08/PAPP102_s08_060_010.html ❖ https://gradschool.princeton.edu/academics/fields-study/population-studies ❖ http://www.waikato.ac.nz/fass/about/social-sciences/population-studies-and-demography ❖ http://methods.sagepub.com/reference/encyclopedia-of-survey-research-methods/n128.xml ❖ http://www.studylecturenotes.com/basics-of-sociology/demography-versus-population-studies ❖ http://healthandrights.ccnmtl.columbia.edu/demography/demography_and_population_studies.html