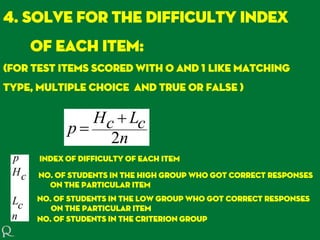
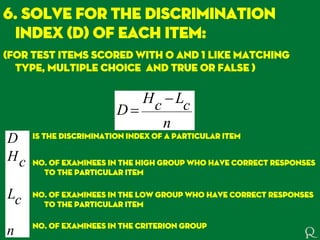
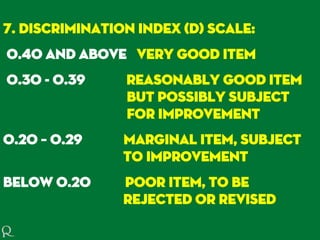
Item
analysis
Item Analysis can help
you evaluate how well
your objective items are
actually working.
These problems can be
corrected, resulting in
a better test, and
better measurement.
refers to a statistical
technique that helps
instructors identify the
effectiveness of their
test items.
indicates the
proportion of
students who got
the item right.
A high percentage
indicates an easy
item/question and a low
percentage indicates a
difficult item.
In general,
items should
have values of
difficulty no
less than 20%
correct and
no greater
than 80%.
Very difficult
or very easy
items
contribute
little to the
discriminating
power of a
test.
each of these groups
consists of
twenty-seven
percent of the
total group of
students who took
the test and is based
on the students’
total score for
the test
It is the difference
between the proportion
of the top scorers who
got an item correct
and the proportion of the
bottom scorers who got
the item right
each of these groups
consists of twenty-seven
percent of the total
group of students who
took the test and is based
on the students’ total
score for the test
The
discrimination
index range is
between -1 and +1
The closer the index is
to +1, the more
effectively the item
distinguishes between
the two groups of
students
Sometimes
an item will
discriminate
negatively.
Such an item should be
revised and eliminated
from scoring as it
indicates that the
lower performing
students actually
selected the key or
correct response more
frequently than the top
performers.
It is another useful step in
reviewing the effectiveness
of a test item. All of the
incorrect options, or
distractors, should
actually be distracting.
Preferably, each
distracter should be
selected by a greater
proportion of the lower
scorers than of the top
group.
In order for a
distractor to
be acceptable
it should
attract at
least one
candidate.
If no one selects
a distractor it is
important to
revise the option
and attempt to
make the
distractor a
more plausible
choice.
Item
analysis
WritingequationsinExcel
•
•
•
WritingequationsinExcel
•
•
•
•
1. Arrange the test scores
from highest to lowest.
2. Select the Criterion Group
- identify the high group
(top 27%)
and low group
(lowest 27%)
Note:
Top 50% and
bottom 50% for a
class with less
than 30 students
Top 27% and
bottom 27% for a
class with 30 or
more students
3. For each item, count the
number of examinees in the
upper group who have
correct responses. Do a
separate, similar procedure
for the lower group.
4. Solve for the difficulty index
of each item:
(for test items scored with 0 and 1 like matching
type, multiple choice and true or false )
n
cLcH
p
2


Index of difficulty of each item
No. of students in the high group who got correct responses
on the particular item
No. of students in the low group who got correct responses
on the particular item
n
cL
cH
p
No. of students in the criterion group
5. Difficulty index (p) scale:
below 0.25 item is very difficult
0.25 - 0.75 item is of average
difficulty
Above 0.75 item is easy
6. Solve for the discrimination
index (D) of each item:
(for test items scored with 0 and 1 like matching
type, multiple choice and true or false )
n
cLcH
D


n
cL
cH
D
No. of examinees in the high group who have correct responses
to the particular item
Is the discrimination index of a particular item
No. of examinees in the criterion group
No. of examinees in the low group who have correct responses
to the particular item
7. Discrimination index (D) scale:
0.40 and above very good item
0.30 - 0.39 reasonably good item
but possibly subject
for improvement
0.20 – 0.29 marginal item, subject
to improvement
Below 0.20 poor item, to be
rejected or revised
Item Analysis - Discrimination and Difficulty Index

Item Analysis - Discrimination and Difficulty Index

  • 1.
  • 5.
    Item Analysis canhelp you evaluate how well your objective items are actually working.
  • 6.
    These problems canbe corrected, resulting in a better test, and better measurement.
  • 7.
    refers to astatistical technique that helps instructors identify the effectiveness of their test items.
  • 8.
    indicates the proportion of studentswho got the item right.
  • 9.
    A high percentage indicatesan easy item/question and a low percentage indicates a difficult item.
  • 10.
    In general, items should havevalues of difficulty no less than 20% correct and no greater than 80%.
  • 11.
    Very difficult or veryeasy items contribute little to the discriminating power of a test.
  • 12.
    each of thesegroups consists of twenty-seven percent of the total group of students who took the test and is based on the students’ total score for the test
  • 13.
    It is thedifference between the proportion of the top scorers who got an item correct and the proportion of the bottom scorers who got the item right
  • 14.
    each of thesegroups consists of twenty-seven percent of the total group of students who took the test and is based on the students’ total score for the test
  • 15.
  • 16.
    The closer theindex is to +1, the more effectively the item distinguishes between the two groups of students
  • 17.
  • 18.
    Such an itemshould be revised and eliminated from scoring as it indicates that the lower performing students actually selected the key or correct response more frequently than the top performers.
  • 19.
    It is anotheruseful step in reviewing the effectiveness of a test item. All of the incorrect options, or distractors, should actually be distracting.
  • 20.
    Preferably, each distracter shouldbe selected by a greater proportion of the lower scorers than of the top group.
  • 21.
    In order fora distractor to be acceptable it should attract at least one candidate.
  • 22.
    If no oneselects a distractor it is important to revise the option and attempt to make the distractor a more plausible choice.
  • 23.
  • 24.
  • 25.
  • 26.
    1. Arrange thetest scores from highest to lowest. 2. Select the Criterion Group - identify the high group (top 27%) and low group (lowest 27%)
  • 27.
    Note: Top 50% and bottom50% for a class with less than 30 students Top 27% and bottom 27% for a class with 30 or more students
  • 28.
    3. For eachitem, count the number of examinees in the upper group who have correct responses. Do a separate, similar procedure for the lower group.
  • 29.
    4. Solve forthe difficulty index of each item: (for test items scored with 0 and 1 like matching type, multiple choice and true or false ) n cLcH p 2   Index of difficulty of each item No. of students in the high group who got correct responses on the particular item No. of students in the low group who got correct responses on the particular item n cL cH p No. of students in the criterion group
  • 30.
    5. Difficulty index(p) scale: below 0.25 item is very difficult 0.25 - 0.75 item is of average difficulty Above 0.75 item is easy
  • 31.
    6. Solve forthe discrimination index (D) of each item: (for test items scored with 0 and 1 like matching type, multiple choice and true or false ) n cLcH D   n cL cH D No. of examinees in the high group who have correct responses to the particular item Is the discrimination index of a particular item No. of examinees in the criterion group No. of examinees in the low group who have correct responses to the particular item
  • 32.
    7. Discrimination index(D) scale: 0.40 and above very good item 0.30 - 0.39 reasonably good item but possibly subject for improvement 0.20 – 0.29 marginal item, subject to improvement Below 0.20 poor item, to be rejected or revised