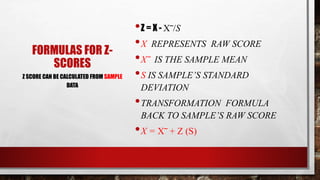
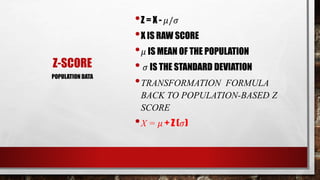
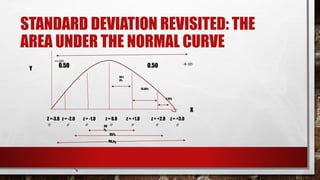
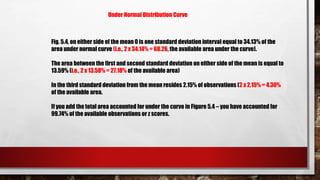
STANDARDIZATION: WHAT IS IT?
STANDARDIZATION INVOLVES CONSISTENT FORMS OF MEASUREMENT AND INTERPRETATION, AN ATTEMPT
TO CONSIDER THE RELATIVE POSITION OF OBJECTS ON A SINGLE DIMENSION.
1. IQ (INTELLIGENT QUOTIENT)
2. SAT (SCHOLASTIC APTITUDE TEST )
3. LSAT (LAW SCHOOL ADMISSION TEST)
4. GMAT ( GRADUATE MANAGEMENT ADMISSION TEST)
5. GRE ( GRADUATE RECORD EXAM)
Y
X
40 55 70 85 100 115 130 145 160
𝝁
Figure 5.1. Hypothetical distribution of scores on an IQ test
Third Second First First Second Third
𝜎 𝜎 𝜎 𝜎 𝜎 𝜎
Below 𝜇 Below𝜇 Below 𝜇 Above 𝜇 Above 𝜇 Above 𝜇
Pop mean (𝜇) of 100
Standard deviation 𝜎15
110 1st 𝜎 around the mean
CONVERTING RAW SCORE INTO A
STANDARD SCORE
• A RAW SCORE IS ANY SCORE OR DATUM THAT
HAS NOT BEEN ANALYZED OR OTHERWISE
TRANSFORMED BY A STATISTICAL PROCEDURE
• A STANDARDIZED SCORE IS DERIVED FROM A
RAW SCORE. STANDARDIZED SCORES REPORT
THE RELATIVE PLACEMENT OF INDIVIDUAL
SCORES IN DISTRIBUTION AND ARE USEFUL FOR
VARIOUS INFERENTIAL STATISTICAL
PROCEDURES.
IMPORTANCE
Converting raw scores to standard
scores promotes comparison and
inference
Z-SCORE
• A DESCRIPTIVE STATISTIC, THE Z SCORE INDICATES THE DISTANCE BETWEEN SOME OBSERVED SCORE (X)
AND THE MEAN OF A DISTRIBUTION IN STANDARD DEVIATION UNITS.
• THE Z-SCORE TELLS THIS: HOW MANY STANDARD DEVIATIONS AWAY FROM THE MEAN IS A GIVEN SCORE?
35 40 45 50 55 60 65
- 3.0 - 2..0 - 1.0 0.0 + 1.0 +2.0 +3.0
Figure 5.2 Distribution of Raw Scores and Corresponding Z Scores Where 𝜇 = 50 𝐚𝐧𝐝 𝜎 = 5
Y
X
RELATIVE DIFFERENCE BETWEEN MEAN
Mean = 50
i.E., 55 – 50 = 5
Standard deviation is 5, therefore 5 ÷ 5 = + 1.0
i.E., 40 – 50 = -10
Standard deviation is 5, therefore -10.0 ÷ 5 = -2.0
KEY POINTS: Z-SCORE
• 1. THE MEAN OF ANY Z DISTRIBUTION IS ALWAYS 0
• 2. THE STANDARD DEVIATION OF ANY Z DISTRIBUTION IS
ALWAYS 1.0
• 3. Z SCORE IS (+) WHEN THE SCORE FALLS ABOVE THE
MEAN OF 0, IT IS (-) WHEN IT FALLS BELOW IT. THE ONLY
TIME A Z SCORE LACKS A SIGN IS WHEN IT IS EQUAL TO 0.
• 4. THE DISTRIBUTION OF Z SCORES WILL ALWAYS RETAIN
THE SHAPE OF THE DISTRIBUTION OF THE ORIGINAL
SCORES.
Z-SCORE
FORMULAS FOR Z-
SCORES
•Z = X - X‾/S
•X REPRESENTS RAW SCORE
•X‾ IS THE SAMPLE MEAN
•S IS SAMPLE’S STANDARD
DEVIATION
•TRANSFORMATION FORMULA
BACK TO SAMPLE’S RAW SCORE
•X = X‾ + Z (S)
Z SCORE CAN BE CALCULATED FROM SAMPLE
DATA
Z-SCORE
•Z = X - 𝜇/𝜎
•X IS RAW SCORE
• 𝜇 IS MEAN OF THE POPULATION
• 𝜎 IS THE STANDARD DEVIATION
•TRANSFORMATION FORMULA
BACK TO POPULATION-BASED Z
SCORE
•X = 𝜇 + Z (𝜎)
POPULATION DATA
-2 - 1 0 + 1 + 2
Y
X
Figure 5.3 Bell-curve to represent a Distribution of z-scores
FORMULA OF THE SHAPE OF NORMAL
DISTRIBUTION
f(𝑥) =
1
√2𝜋𝝈2 𝑒‾
𝑥−𝜇 ²
2𝜎²
Relative frequency or function of any score (x) is dependent upon the population
mean (𝝁) and variance (𝝈𝟐), the constant 𝝅 (which is ≅
𝟑. 𝟏𝟒𝟔), 𝐚𝐧𝐝 𝐭𝐡𝐞 𝐜𝐨𝐧𝐬𝐭𝐚𝐧𝐭 𝐞 (𝐭𝐡𝐞 𝐛𝐚𝐬𝐞 𝐨𝐟 𝐭𝐡𝐞 𝐧𝐚𝐭𝐮𝐫𝐚𝐥 𝐥𝐨𝐠𝐚𝐫𝐢𝐭𝐡𝐦, 𝐰𝐡𝐢𝐜𝐡 𝐢𝐬 ≅
𝟐. 𝟕𝟏𝟖𝟑). In other words, if the relative frequencies of X were entered into the
equation, we would be able to see how they must form the now familiar normal
curve.
STANDARD DEVIATION REVISITED: THE
AREA UNDER THE NORMAL CURVE
Y
X
34.1
3%
13.59%
2.15%
0.500.50
−∞
+∞
Z =-3.0 z = -2.0 z = -1.0 z = 0.0 z = +1.0 z = +2.0 z = +3.0
𝜎 𝜎 𝜎 𝜎 𝜎 𝜎 𝜎68
%
95%
Fig. 5.4, on either side of the mean 0 is one standard deviation interval equal to 34.13% of the
area under normal curve (i.e., 2 x 34.14% = 68.26, the available area under the curve).
The area between the first and second standard deviation on either side of the mean is equal to
13.59% (i.e., 2 x 13.58% = 27.18% of the available area)
In the third standard deviation from the mean resides 2.15% of observations (2 x 2.15% = 4.30%
of the available area.
If you add the total area accounted for under the curve in Figure 5.4 – you have accounted for
99.74% of the available observations or z scores.
Under Normal Distribution Curve
Measure Raw score Pop. parameters Z-Score
Depression 80 𝜇= 110, 𝜎 = 15 -2.00
Self-esteem 90 𝜇 = 75, 𝜎= 8 +1.88
Life-satisfaction 25 𝜇 = 40, 𝜎= 5 -3.00
Fig.5.1 Scores on three hypothetical measures of psychological well-being
A. Z score for client’s depression level (z = -2.00) is relatively far below the mean, which
indicates a low likelihood of depression (i.e., higher scores reflect a greater incidence
of depression).
B. Z score of Life-satisfaction (z = -3.00) is not in the desired direction– the client is
clearly dissatisfied with salient aspects of his life– as it is the three standard
deviations below the mean.

Standard scores and normal distribution

  • 2.
    STANDARDIZATION: WHAT ISIT? STANDARDIZATION INVOLVES CONSISTENT FORMS OF MEASUREMENT AND INTERPRETATION, AN ATTEMPT TO CONSIDER THE RELATIVE POSITION OF OBJECTS ON A SINGLE DIMENSION. 1. IQ (INTELLIGENT QUOTIENT) 2. SAT (SCHOLASTIC APTITUDE TEST ) 3. LSAT (LAW SCHOOL ADMISSION TEST) 4. GMAT ( GRADUATE MANAGEMENT ADMISSION TEST) 5. GRE ( GRADUATE RECORD EXAM)
  • 3.
    Y X 40 55 7085 100 115 130 145 160 𝝁 Figure 5.1. Hypothetical distribution of scores on an IQ test Third Second First First Second Third 𝜎 𝜎 𝜎 𝜎 𝜎 𝜎 Below 𝜇 Below𝜇 Below 𝜇 Above 𝜇 Above 𝜇 Above 𝜇 Pop mean (𝜇) of 100 Standard deviation 𝜎15 110 1st 𝜎 around the mean
  • 4.
    CONVERTING RAW SCOREINTO A STANDARD SCORE • A RAW SCORE IS ANY SCORE OR DATUM THAT HAS NOT BEEN ANALYZED OR OTHERWISE TRANSFORMED BY A STATISTICAL PROCEDURE • A STANDARDIZED SCORE IS DERIVED FROM A RAW SCORE. STANDARDIZED SCORES REPORT THE RELATIVE PLACEMENT OF INDIVIDUAL SCORES IN DISTRIBUTION AND ARE USEFUL FOR VARIOUS INFERENTIAL STATISTICAL PROCEDURES.
  • 5.
    IMPORTANCE Converting raw scoresto standard scores promotes comparison and inference
  • 6.
    Z-SCORE • A DESCRIPTIVESTATISTIC, THE Z SCORE INDICATES THE DISTANCE BETWEEN SOME OBSERVED SCORE (X) AND THE MEAN OF A DISTRIBUTION IN STANDARD DEVIATION UNITS. • THE Z-SCORE TELLS THIS: HOW MANY STANDARD DEVIATIONS AWAY FROM THE MEAN IS A GIVEN SCORE?
  • 7.
    35 40 4550 55 60 65 - 3.0 - 2..0 - 1.0 0.0 + 1.0 +2.0 +3.0 Figure 5.2 Distribution of Raw Scores and Corresponding Z Scores Where 𝜇 = 50 𝐚𝐧𝐝 𝜎 = 5 Y X
  • 8.
    RELATIVE DIFFERENCE BETWEENMEAN Mean = 50 i.E., 55 – 50 = 5 Standard deviation is 5, therefore 5 ÷ 5 = + 1.0 i.E., 40 – 50 = -10 Standard deviation is 5, therefore -10.0 ÷ 5 = -2.0
  • 9.
    KEY POINTS: Z-SCORE •1. THE MEAN OF ANY Z DISTRIBUTION IS ALWAYS 0 • 2. THE STANDARD DEVIATION OF ANY Z DISTRIBUTION IS ALWAYS 1.0 • 3. Z SCORE IS (+) WHEN THE SCORE FALLS ABOVE THE MEAN OF 0, IT IS (-) WHEN IT FALLS BELOW IT. THE ONLY TIME A Z SCORE LACKS A SIGN IS WHEN IT IS EQUAL TO 0. • 4. THE DISTRIBUTION OF Z SCORES WILL ALWAYS RETAIN THE SHAPE OF THE DISTRIBUTION OF THE ORIGINAL SCORES. Z-SCORE
  • 10.
    FORMULAS FOR Z- SCORES •Z= X - X‾/S •X REPRESENTS RAW SCORE •X‾ IS THE SAMPLE MEAN •S IS SAMPLE’S STANDARD DEVIATION •TRANSFORMATION FORMULA BACK TO SAMPLE’S RAW SCORE •X = X‾ + Z (S) Z SCORE CAN BE CALCULATED FROM SAMPLE DATA
  • 11.
    Z-SCORE •Z = X- 𝜇/𝜎 •X IS RAW SCORE • 𝜇 IS MEAN OF THE POPULATION • 𝜎 IS THE STANDARD DEVIATION •TRANSFORMATION FORMULA BACK TO POPULATION-BASED Z SCORE •X = 𝜇 + Z (𝜎) POPULATION DATA
  • 12.
    -2 - 10 + 1 + 2 Y X Figure 5.3 Bell-curve to represent a Distribution of z-scores
  • 13.
    FORMULA OF THESHAPE OF NORMAL DISTRIBUTION f(𝑥) = 1 √2𝜋𝝈2 𝑒‾ 𝑥−𝜇 ² 2𝜎² Relative frequency or function of any score (x) is dependent upon the population mean (𝝁) and variance (𝝈𝟐), the constant 𝝅 (which is ≅ 𝟑. 𝟏𝟒𝟔), 𝐚𝐧𝐝 𝐭𝐡𝐞 𝐜𝐨𝐧𝐬𝐭𝐚𝐧𝐭 𝐞 (𝐭𝐡𝐞 𝐛𝐚𝐬𝐞 𝐨𝐟 𝐭𝐡𝐞 𝐧𝐚𝐭𝐮𝐫𝐚𝐥 𝐥𝐨𝐠𝐚𝐫𝐢𝐭𝐡𝐦, 𝐰𝐡𝐢𝐜𝐡 𝐢𝐬 ≅ 𝟐. 𝟕𝟏𝟖𝟑). In other words, if the relative frequencies of X were entered into the equation, we would be able to see how they must form the now familiar normal curve.
  • 14.
    STANDARD DEVIATION REVISITED:THE AREA UNDER THE NORMAL CURVE Y X 34.1 3% 13.59% 2.15% 0.500.50 −∞ +∞ Z =-3.0 z = -2.0 z = -1.0 z = 0.0 z = +1.0 z = +2.0 z = +3.0 𝜎 𝜎 𝜎 𝜎 𝜎 𝜎 𝜎68 % 95%
  • 15.
    Fig. 5.4, oneither side of the mean 0 is one standard deviation interval equal to 34.13% of the area under normal curve (i.e., 2 x 34.14% = 68.26, the available area under the curve). The area between the first and second standard deviation on either side of the mean is equal to 13.59% (i.e., 2 x 13.58% = 27.18% of the available area) In the third standard deviation from the mean resides 2.15% of observations (2 x 2.15% = 4.30% of the available area. If you add the total area accounted for under the curve in Figure 5.4 – you have accounted for 99.74% of the available observations or z scores. Under Normal Distribution Curve
  • 16.
    Measure Raw scorePop. parameters Z-Score Depression 80 𝜇= 110, 𝜎 = 15 -2.00 Self-esteem 90 𝜇 = 75, 𝜎= 8 +1.88 Life-satisfaction 25 𝜇 = 40, 𝜎= 5 -3.00 Fig.5.1 Scores on three hypothetical measures of psychological well-being A. Z score for client’s depression level (z = -2.00) is relatively far below the mean, which indicates a low likelihood of depression (i.e., higher scores reflect a greater incidence of depression). B. Z score of Life-satisfaction (z = -3.00) is not in the desired direction– the client is clearly dissatisfied with salient aspects of his life– as it is the three standard deviations below the mean.