Downloaded 435 times


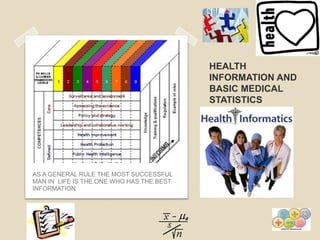


1. Dr. Ritesh Malik gave a presentation on health information and basic medical statistics at Theni Govt. Medical College in Tamil Nadu, India. 2. The presentation covered topics such as data versus information, measures of central tendency (mean, median, mode), standard deviation, standard error, and tests of significance. 3. Tests of significance allow researchers to determine whether observed differences are statistically significant or likely due to chance, such as the standard error of the mean, standard error of proportion, and chi square test.


