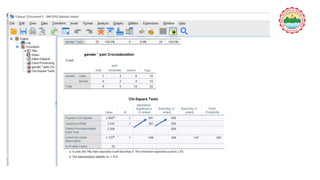
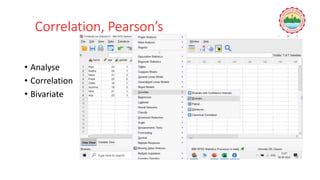
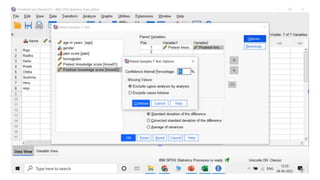
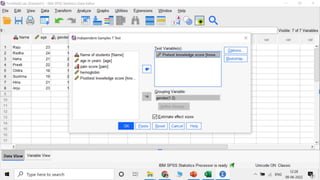
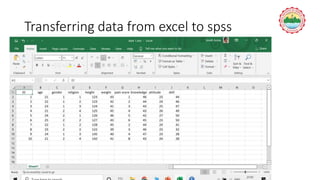
Quantitative Data Analysis
using SPSS
Prof. (Dr.) Smriti Arora
CON AIIMS Rishikesh
9th June 2022
•SPSS- Statistical Package for Social Sciences
Objectives
• How to fill data in spss
• Tests to be applied
• Assessing normality
• Chi square
• Correlation Coefficient
• T
• One way Anova
Types of Variables
Variables
Qualitative Quantitative
NOMINAL ORDINAL DISCRETE CONTINUOUS
Categorical variables
• Nominal – blood group, gender, religion
• Ordinal/ rank order- pain: mild, moderate, severe, anxiety, quality of
life, attitude, stages of wound healing
usually measured by Likert scale
• Discrete – no. of children, no. of chairs or beds
• Continuous- weight, height, BMI, Hemoglobin
Three Ways of Data Analysis
(For any data from any specialty / discipline)
1. Uni-variate analysis
2. Bi-variate analysis: (Cat, Cat)
(Cat, Quant)
(Quant, Quant)
3. Multi-variate analysis
May decide to perform one or all of the above depending on the need
There is no other way of data analysis
Inferential Statistics
Parametric tests Nonparametric tests
• Used when data is- normal
• Includes comparisons of means
• Used for continuous data
• Probability sampling
• Parametric tests usually have more
statistical power than
nonparametric tests.
• T test, ANOVA, regression analysis,
Correlation Coefficient
• Non normal
• Comparison of Medians
• Used for categorical
(nominal, ordinal or discrete)
data
• Non probability sampling
• Kruskal Wallis, Mc Nemar,
Man Whitney U, Friedman
test
Hypothesis testing procedure
• State null hypothesis
• Determine level of significance: 0.05 or 0.01
• Select the test statistic
• Compute the test statistic
• Calculate degrees of freedom
• Compare test value with tabled value.
X- Independent variable, Y – Dependent variable
Knowledge
Categorical
• Inadequate
• Moderately
adequate
• Adequate
Ordinal
• 1
• 2
• 3
• 2
• 3
Quantitative
• 20.5
• 32
• 53.9
• 34
• 56.5
 1- 0-30- Inadequate
 2- 31-50- moderately adequate
 3- 51-100- adequate
 Min score – 0, maximum score - 100
Entering variables
• Name
• write in letters, no space or special characters, only underscore is allowed
• Knowledge 
• knowledge_pretest 
• Knowledge pretest 
• Know ledge! 
• Type
• Numeric variables – numbers
• String – names
• Width- 8
• Label- spaces and special characters are allowed
• Values – eg for pain (1- mild, 2- moderate, 3 severe)
Data analysis – descriptive
0
1
2
3
4
5
6
Male female
Frequency
gender
gender
Assessing normality
• Analyze
• Descriptive statistics
• Explore
• Plots , normality tests,
Histogram
• P value should be above
0.05
• https://www.youtube.com
/watch?v=2GRZ_d4ftoo
Knowledge is normally distributed among male and females ?
Chi Square
• Categorical vs categorical
• Fisher Exact- used when observed frequency is less
than 5 in any cell
• E.g. Association between gender and pain
Chi square
• Descriptive
statistics
• Crosstabs
• Exact
• Statistics
• Chi square
Fisher exact test
Correlation, Pearson’s
• Analyse
• Correlation
• Bivariate
Correlation between K and A
T test
• Analyse
• Compare means
• Paired sample t test
Independent t test
• Analyze
• compare means
• Independent t test
• Test variable –
knowledge
• Grouping variable –
gender or exp
/control group
Independent t test
One way Anova
• Analyse
• Compare means
• One way Anova
• Options- Descriptive
• Example between pretest
knowledge and different
categories of religion
Transferring data from excel to spss
Summary
• Statistical Package for the Social Sciences is a versatile
and responsive program designed to undertake a range
of statistical procedures.
Thanks

spss for analysis.pptx

  • 1.
    Quantitative Data Analysis usingSPSS Prof. (Dr.) Smriti Arora CON AIIMS Rishikesh 9th June 2022
  • 2.
    •SPSS- Statistical Packagefor Social Sciences
  • 3.
    Objectives • How tofill data in spss • Tests to be applied • Assessing normality • Chi square • Correlation Coefficient • T • One way Anova
  • 4.
    Types of Variables Variables QualitativeQuantitative NOMINAL ORDINAL DISCRETE CONTINUOUS Categorical variables
  • 5.
    • Nominal –blood group, gender, religion • Ordinal/ rank order- pain: mild, moderate, severe, anxiety, quality of life, attitude, stages of wound healing usually measured by Likert scale • Discrete – no. of children, no. of chairs or beds • Continuous- weight, height, BMI, Hemoglobin
  • 6.
    Three Ways ofData Analysis (For any data from any specialty / discipline) 1. Uni-variate analysis 2. Bi-variate analysis: (Cat, Cat) (Cat, Quant) (Quant, Quant) 3. Multi-variate analysis May decide to perform one or all of the above depending on the need There is no other way of data analysis
  • 7.
    Inferential Statistics Parametric testsNonparametric tests • Used when data is- normal • Includes comparisons of means • Used for continuous data • Probability sampling • Parametric tests usually have more statistical power than nonparametric tests. • T test, ANOVA, regression analysis, Correlation Coefficient • Non normal • Comparison of Medians • Used for categorical (nominal, ordinal or discrete) data • Non probability sampling • Kruskal Wallis, Mc Nemar, Man Whitney U, Friedman test
  • 8.
    Hypothesis testing procedure •State null hypothesis • Determine level of significance: 0.05 or 0.01 • Select the test statistic • Compute the test statistic • Calculate degrees of freedom • Compare test value with tabled value.
  • 9.
    X- Independent variable,Y – Dependent variable
  • 13.
    Knowledge Categorical • Inadequate • Moderately adequate •Adequate Ordinal • 1 • 2 • 3 • 2 • 3 Quantitative • 20.5 • 32 • 53.9 • 34 • 56.5  1- 0-30- Inadequate  2- 31-50- moderately adequate  3- 51-100- adequate  Min score – 0, maximum score - 100
  • 16.
    Entering variables • Name •write in letters, no space or special characters, only underscore is allowed • Knowledge  • knowledge_pretest  • Knowledge pretest  • Know ledge!  • Type • Numeric variables – numbers • String – names • Width- 8 • Label- spaces and special characters are allowed • Values – eg for pain (1- mild, 2- moderate, 3 severe)
  • 21.
    Data analysis –descriptive
  • 23.
  • 24.
    Assessing normality • Analyze •Descriptive statistics • Explore • Plots , normality tests, Histogram • P value should be above 0.05 • https://www.youtube.com /watch?v=2GRZ_d4ftoo
  • 26.
    Knowledge is normallydistributed among male and females ?
  • 28.
    Chi Square • Categoricalvs categorical • Fisher Exact- used when observed frequency is less than 5 in any cell • E.g. Association between gender and pain
  • 29.
    Chi square • Descriptive statistics •Crosstabs • Exact • Statistics • Chi square
  • 31.
  • 32.
  • 34.
  • 35.
    T test • Analyse •Compare means • Paired sample t test
  • 39.
    Independent t test •Analyze • compare means • Independent t test • Test variable – knowledge • Grouping variable – gender or exp /control group
  • 41.
  • 42.
    One way Anova •Analyse • Compare means • One way Anova • Options- Descriptive • Example between pretest knowledge and different categories of religion
  • 45.
  • 46.
  • 47.
    Summary • Statistical Packagefor the Social Sciences is a versatile and responsive program designed to undertake a range of statistical procedures.
  • 48.