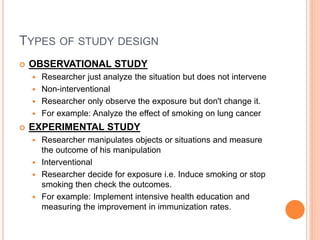
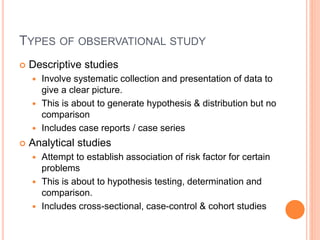
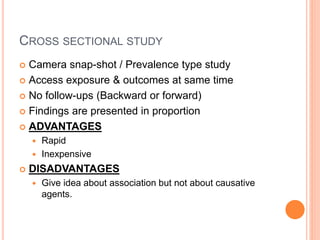
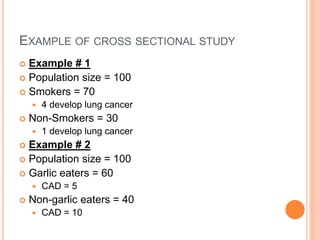
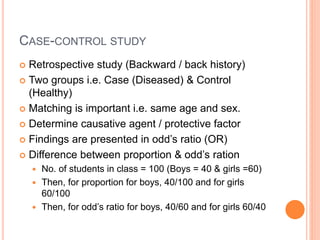
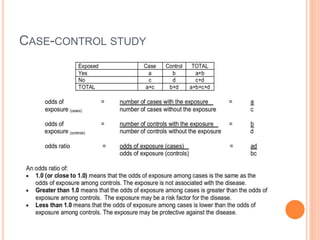
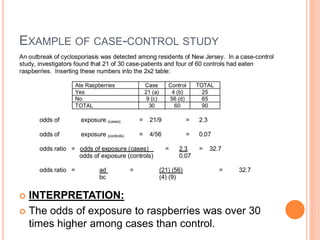
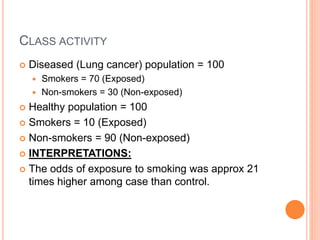
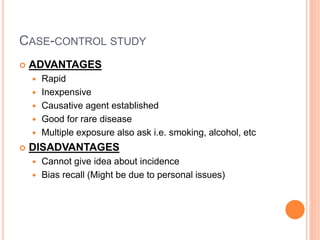
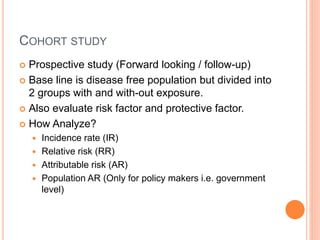
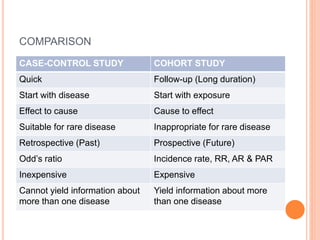
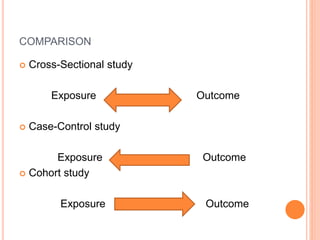
STUDY DESIGN (OBSERVATIONAL)
Prepared By A. Ahad Memon
Lecturer
Institute of Pharmaceutical Sciences
Jinnah Sindh Medical University
TYPES OF STUDY DESIGN
 OBSERVATIONAL STUDY
 Researcher just analyze the situation but does not intervene
 Non-interventional
 Researcher only observe the exposure but don't change it.
 For example: Analyze the effect of smoking on lung cancer
 EXPERIMENTAL STUDY
 Researcher manipulates objects or situations and measure
the outcome of his manipulation
 Interventional
 Researcher decide for exposure i.e. Induce smoking or stop
smoking then check the outcomes.
 For example: Implement intensive health education and
measuring the improvement in immunization rates.
TYPES OF OBSERVATIONAL STUDY
 Descriptive studies
 Involve systematic collection and presentation of data to
give a clear picture.
 This is about to generate hypothesis & distribution but no
comparison
 Includes case reports / case series
 Analytical studies
 Attempt to establish association of risk factor for certain
problems
 This is about to hypothesis testing, determination and
comparison.
 Includes cross-sectional, case-control & cohort studies
CROSS SECTIONAL STUDY
 Camera snap-shot / Prevalence type study
 Access exposure & outcomes at same time
 No follow-ups (Backward or forward)
 Findings are presented in proportion
 ADVANTAGES
 Rapid
 Inexpensive
 DISADVANTAGES
 Give idea about association but not about causative
agents.
EXAMPLE OF CROSS SECTIONAL STUDY
 Example # 1
 Population size = 100
 Smokers = 70
 4 develop lung cancer
 Non-Smokers = 30
 1 develop lung cancer
 Example # 2
 Population size = 100
 Garlic eaters = 60
 CAD = 5
 Non-garlic eaters = 40
 CAD = 10
CASE-CONTROL STUDY
 Retrospective study (Backward / back history)
 Two groups i.e. Case (Diseased) & Control
(Healthy)
 Matching is important i.e. same age and sex.
 Determine causative agent / protective factor
 Findings are presented in odd’s ratio (OR)
 Difference between proportion & odd’s ration
 No. of students in class = 100 (Boys = 40 & girls =60)
 Then, for proportion for boys, 40/100 and for girls
60/100
 Then, for odd’s ratio for boys, 40/60 and for girls 60/40
CASE-CONTROL STUDY
EXAMPLE OF CASE-CONTROL STUDY
 INTERPRETATION:
 The odds of exposure to raspberries was over 30
times higher among cases than control.
CLASS ACTIVITY
 Diseased (Lung cancer) population = 100
 Smokers = 70 (Exposed)
 Non-smokers = 30 (Non-exposed)
 Healthy population = 100
 Smokers = 10 (Exposed)
 Non-smokers = 90 (Non-exposed)
 INTERPRETATIONS:
 The odds of exposure to smoking was approx 21
times higher among case than control.
CASE-CONTROL STUDY
 ADVANTAGES
 Rapid
 Inexpensive
 Causative agent established
 Good for rare disease
 Multiple exposure also ask i.e. smoking, alcohol, etc
 DISADVANTAGES
 Cannot give idea about incidence
 Bias recall (Might be due to personal issues)
COHORT STUDY
 Prospective study (Forward looking / follow-up)
 Base line is disease free population but divided into
2 groups with and with-out exposure.
 Also evaluate risk factor and protective factor.
 How Analyze?
 Incidence rate (IR)
 Relative risk (RR)
 Attributable risk (AR)
 Population AR (Only for policy makers i.e. government
level)
EXAMPLE
 Total population (Exposed) i.e. smoking = 100
 Diseased i.e. lung cancer = 80
 Non-diseased = 20
 Total population (Non-Exposed) = 100
 Diseases = 10
 Non-diseased = 90
EXAMPLE
 Incidence rate (IR)
 = No. of new cases among exposed persons / Total no.
of exposed persons (a/a+b)
OR
 = No. of new cases among Non-exposed persons / Total
no. of Non-exposed persons (c/c+d)
Results: 0.8 or 80% incidence rate in exposed
category while 0.1 or 10% incidence rate in non-
exposed category
EXAMPLE
 Relative Risk (RR)
 Results: 8 which shows smokers are 8 times more
chances to induce lung cancer
CONCEPT……..
 If Odd’s ratio is 10 and relative risk is also 10,
then….
 Interpretation?????
 OR=10, Lung cancer is 10 times more common in
smokers than non-smokers (Past)
 RR=10, Smokers are 10 times more chances to
develop lung cancer as compare to non-smokers
(Future)
EXAMPLE
 Attributable Risk (AR) = (IE=INE/IE) * 100
 Results = 88%
 It shows that Incidence of lung cancer due to
smoking i.e. 88% while 12% without smoking.
 So, to stop smoking, 88% lung cancer will be
reduced.
COHORT STUDY
 ADVANTAGES
 Evaluate incidence
 Temporal sequence of causation
 After 2 year, HTN occur then after 4 year Diabetes shown.
 Multiple exposures like smoking, alcohol, etc
 Multiple outcomes also occur i.e. due to smoking, it has
been shown that oral cancer / lung cancer / GI ulcers.
 DISADVANTAGES
 Long duration (Follow-up)
 Expensive
 Subject may dropout during study
 Not good for rare diseases
COMPARISON
CASE-CONTROL STUDY COHORT STUDY
Quick Follow-up (Long duration)
Start with disease Start with exposure
Effect to cause Cause to effect
Suitable for rare disease Inappropriate for rare disease
Retrospective (Past) Prospective (Future)
Odd’s ratio Incidence rate, RR, AR & PAR
Inexpensive Expensive
Cannot yield information about
more than one disease
Yield information about more
than one disease
COMPARISON
 Cross-Sectional study
Exposure Outcome
 Case-Control study
Exposure Outcome
 Cohort study
Exposure Outcome
Study design

Study design

  • 1.
    STUDY DESIGN (OBSERVATIONAL) PreparedBy A. Ahad Memon Lecturer Institute of Pharmaceutical Sciences Jinnah Sindh Medical University
  • 3.
    TYPES OF STUDYDESIGN  OBSERVATIONAL STUDY  Researcher just analyze the situation but does not intervene  Non-interventional  Researcher only observe the exposure but don't change it.  For example: Analyze the effect of smoking on lung cancer  EXPERIMENTAL STUDY  Researcher manipulates objects or situations and measure the outcome of his manipulation  Interventional  Researcher decide for exposure i.e. Induce smoking or stop smoking then check the outcomes.  For example: Implement intensive health education and measuring the improvement in immunization rates.
  • 4.
    TYPES OF OBSERVATIONALSTUDY  Descriptive studies  Involve systematic collection and presentation of data to give a clear picture.  This is about to generate hypothesis & distribution but no comparison  Includes case reports / case series  Analytical studies  Attempt to establish association of risk factor for certain problems  This is about to hypothesis testing, determination and comparison.  Includes cross-sectional, case-control & cohort studies
  • 5.
    CROSS SECTIONAL STUDY Camera snap-shot / Prevalence type study  Access exposure & outcomes at same time  No follow-ups (Backward or forward)  Findings are presented in proportion  ADVANTAGES  Rapid  Inexpensive  DISADVANTAGES  Give idea about association but not about causative agents.
  • 6.
    EXAMPLE OF CROSSSECTIONAL STUDY  Example # 1  Population size = 100  Smokers = 70  4 develop lung cancer  Non-Smokers = 30  1 develop lung cancer  Example # 2  Population size = 100  Garlic eaters = 60  CAD = 5  Non-garlic eaters = 40  CAD = 10
  • 7.
    CASE-CONTROL STUDY  Retrospectivestudy (Backward / back history)  Two groups i.e. Case (Diseased) & Control (Healthy)  Matching is important i.e. same age and sex.  Determine causative agent / protective factor  Findings are presented in odd’s ratio (OR)  Difference between proportion & odd’s ration  No. of students in class = 100 (Boys = 40 & girls =60)  Then, for proportion for boys, 40/100 and for girls 60/100  Then, for odd’s ratio for boys, 40/60 and for girls 60/40
  • 8.
  • 9.
    EXAMPLE OF CASE-CONTROLSTUDY  INTERPRETATION:  The odds of exposure to raspberries was over 30 times higher among cases than control.
  • 10.
    CLASS ACTIVITY  Diseased(Lung cancer) population = 100  Smokers = 70 (Exposed)  Non-smokers = 30 (Non-exposed)  Healthy population = 100  Smokers = 10 (Exposed)  Non-smokers = 90 (Non-exposed)  INTERPRETATIONS:  The odds of exposure to smoking was approx 21 times higher among case than control.
  • 11.
    CASE-CONTROL STUDY  ADVANTAGES Rapid  Inexpensive  Causative agent established  Good for rare disease  Multiple exposure also ask i.e. smoking, alcohol, etc  DISADVANTAGES  Cannot give idea about incidence  Bias recall (Might be due to personal issues)
  • 12.
    COHORT STUDY  Prospectivestudy (Forward looking / follow-up)  Base line is disease free population but divided into 2 groups with and with-out exposure.  Also evaluate risk factor and protective factor.  How Analyze?  Incidence rate (IR)  Relative risk (RR)  Attributable risk (AR)  Population AR (Only for policy makers i.e. government level)
  • 13.
    EXAMPLE  Total population(Exposed) i.e. smoking = 100  Diseased i.e. lung cancer = 80  Non-diseased = 20  Total population (Non-Exposed) = 100  Diseases = 10  Non-diseased = 90
  • 14.
    EXAMPLE  Incidence rate(IR)  = No. of new cases among exposed persons / Total no. of exposed persons (a/a+b) OR  = No. of new cases among Non-exposed persons / Total no. of Non-exposed persons (c/c+d) Results: 0.8 or 80% incidence rate in exposed category while 0.1 or 10% incidence rate in non- exposed category
  • 15.
    EXAMPLE  Relative Risk(RR)  Results: 8 which shows smokers are 8 times more chances to induce lung cancer
  • 16.
    CONCEPT……..  If Odd’sratio is 10 and relative risk is also 10, then….  Interpretation?????  OR=10, Lung cancer is 10 times more common in smokers than non-smokers (Past)  RR=10, Smokers are 10 times more chances to develop lung cancer as compare to non-smokers (Future)
  • 17.
    EXAMPLE  Attributable Risk(AR) = (IE=INE/IE) * 100  Results = 88%  It shows that Incidence of lung cancer due to smoking i.e. 88% while 12% without smoking.  So, to stop smoking, 88% lung cancer will be reduced.
  • 18.
    COHORT STUDY  ADVANTAGES Evaluate incidence  Temporal sequence of causation  After 2 year, HTN occur then after 4 year Diabetes shown.  Multiple exposures like smoking, alcohol, etc  Multiple outcomes also occur i.e. due to smoking, it has been shown that oral cancer / lung cancer / GI ulcers.  DISADVANTAGES  Long duration (Follow-up)  Expensive  Subject may dropout during study  Not good for rare diseases
  • 19.
    COMPARISON CASE-CONTROL STUDY COHORTSTUDY Quick Follow-up (Long duration) Start with disease Start with exposure Effect to cause Cause to effect Suitable for rare disease Inappropriate for rare disease Retrospective (Past) Prospective (Future) Odd’s ratio Incidence rate, RR, AR & PAR Inexpensive Expensive Cannot yield information about more than one disease Yield information about more than one disease
  • 20.
    COMPARISON  Cross-Sectional study ExposureOutcome  Case-Control study Exposure Outcome  Cohort study Exposure Outcome